Article Text

Abstract
Objectives We aimed to assess the associations between night-time sleep duration and fasting glucose (FG), triglyceride (TG) to high-density lipoprotein cholesterol (HDL-C) ratio and body mass index (BMI) among adults free of type 2 diabetes (T2D) or without diagnosed T2D.
Design Cross-sectional study.
Setting Medical examination centres at six hospitals in Beijing-Tianjin-Hebei region, China.
Participants Participants were recruited via multistage, stratified cluster sampling. We included adults free of T2D or without diagnosed T2D who attended for physical examination and completed the validated questionnaire. 32 497 participants were included in the study, of whom 52.50% were men.
Primary and secondary outcome measures FG, TG, HDL-C, height and weight were measured.
Results Overall, 12.80% and 9.67% reported night sleep duration <7 hours and ≥9 hours, respectively; 6.91% had elevated FG and 3.57% had undiagnosed T2D. Sleep duration had an independent, U-shaped associated with FG (β1 (linear term)=−0.111, p=0.047; β2 (quadratic term)=0.008, p=0.026) with 6.9 hours of sleep associated with the lowest FG and a negative association with BMI (β=−0.154, p<0.001). BMI mediated a U-shaped association of sleep duration with TG/HDL-C (β1=−0.040, p=0.017; β2=0.003, p=0.023).
Conclusions Both short and long night-time sleep was associated with elevated FG, and short sleep duration was associated with increased BMI. BMI mediated a U-shaped association between sleep duration and TG/HDL-C.
- EPIDEMIOLOGY
- SLEEP MEDICINE
- DIABETES & ENDOCRINOLOGY
Data availability statement
Data are available on reasonable request. The datasets used and/or analysed during the current study are available from the corresponding author on reasonable request. Data will be shared with bona fide researchers submitting a research proposal requesting access to data. Data use is subject to approval by the independent review board.
This is an open access article distributed in accordance with the Creative Commons Attribution Non Commercial (CC BY-NC 4.0) license, which permits others to distribute, remix, adapt, build upon this work non-commercially, and license their derivative works on different terms, provided the original work is properly cited, appropriate credit is given, any changes made indicated, and the use is non-commercial. See: http://creativecommons.org/licenses/by-nc/4.0/.
Statistics from Altmetric.com
Strengths and limitations of this study
A multistage, stratified cluster sampling of attendees at physical examination centres was used to obtain a diverse population with respect to sociodemographic characteristics, lifestyle and metabolic status, to ensure the reliability of the findings.
A broad range of covariates were controlled for in the analysis, including age, sex, education, marital status, occupation, body mass index, physical exercise, subjective sleep quality and taking sleep medications.
The cross-sectional nature of the research prohibits it from being used to evaluate the temporal sequences and causal relationships between sleep duration and study outcome, and the findings need to be further verified in longitudinal studies.
Introduction
According to the International Diabetes Federation Diabetes Atlas (ninth edition) data, released in 2019, approximately 463 million adults aged 20–79 were suffering from diabetes globally, with a crude prevalence rate of 9.3%.1 Type 2 diabetes (T2D), accounting for around 90% of all diabetes worldwide, has shown an increased prevalence in China in recent decades. In parallel, there has been an increased sleep deprivation in China.2 Sleep is a fundamental and complex physiological process. Long-term sleep deprivation will cause a series of physical and mental illnesses.3 Optimal sleep duration is one of the critical factors to maintain metabolic balance.4 Both short and long sleep duration reduce insulin sensitivity and induce the production of a variety of inflammatory cytokines, which will affect the body’s glucose and lipid metabolism and induce or accelerate the occurrence and development of metabolic diseases such as obesity, metabolic syndrome and T2D.5 Besides, sleep deprivation can also cause physiological and behavioural changes, such as an increase in wakefulness that leads to increased energy consumption, which leads to an unbalanced increase in food intake, reduction in physical activity and overweight, thus further increases T2D risk.6
In general, T2D may be completely symptomless, and the exact time of the onset of T2D is usually impossible to determine. As a result, there is often a long prediagnostic period, and as many as one-third to one-half of people with T2D in the population may be undiagnosed.1 T2D is characterised by insulin resistance, which occurs before the clinical diagnosis of T2D.7 A substantial number of individuals free of T2D or without diagnosed T2D are suffering from insulin resistance and will be later diagnosed with diabetes. Consequently, early identification of insulin resistance in these high-risk groups is essential in preventing T2D.
Although there has mounting evidence that short or long sleep duration is related to the risk of T2D and the control of fasting glucose (FG) among patients with T2D,8 9 only a few have examined the association between sleep duration and predictors of insulin resistance, FG and triglycerides (TG) to high-density lipoprotein cholesterol (HDL-C) ratio (TG/HDL-C),10 11 and the results were equivocal.12 13 As such, this study aims to explore the associations of self-reported night sleep duration and FG, TG/HDL-C and body mass index (BMI) among people free of T2D or without diagnosed T2D, which will provide evidence to sensitively and directly identify the impact of sleep duration on insulin resistance.
Methods
Study design and recruitment
We conducted a cross-sectional study among adults for health screening using cluster sampling from January 2018 to January 2020 in the Beijing-Tianjin-Hebei region, China. First, we recorded the physical examination centres in tertiary care hospitals with more than 200 organisations, institutions or companies registered for health screening per year, and then selected 2–3 medical examination centres by systematic sampling in Beijing, Tianjin and Hebei, respectively. Second, we consecutively selected the registered organisations, institutions and companies with stable employees and categorised them by occupation (white, pink and blue collar) for each selected medical examination centre, and then proportionally selected 100–200 registered organisations, institutions and companies for each occupation category. Employees of those selected organisations, institutions and companies were enrolled if they (1) aged 18 years and above; (2) agreed to participate in the study and signed the informed consent. Individuals were excluded from this analysis if they (1) were with cognitive impairment, hearing impairment, articulate problems or severe mental illness that cannot complete the survey; (2) were in acute infection status, such as fever, diarrhoea, etc and (3) were with missing one of the measurements of FG, TG, HDL-C, height and weight. In addition, to prevent the confounding effects caused by the lowering of blood glucose and lipids attributable to the medications, we excluded people who (1) had been diagnosed with type 1 or type 2 diabetes and were taking hypoglycaemic drugs or injecting insulin; (2) had been diagnosed with hyperlipidaemia and were taking lipid-lowering drugs.
Data collection and measurement
Sleep assessments
The modified Pittsburgh Sleep Quality Index (PSQI) questionnaire, which has been proved to have high reliability and validity in Chinese population,14 was used to determine self-reported items. Participants were asked questions regarding sleep in the past month: ‘when have you usually gone to bed at night?’, ‘when have you usually gotten up in the morning?’ and ‘how long does it usually take you to fall asleep each night?’. We calculated participants’ average daily night sleep duration based on these questions. The average self-reported sleep duration was reported by hours and was calculated by the time to fall asleep and the time to get up. If they did not indicate an exact period, we used the filled period’s middle time point. For example, if participants report they usually go to bed at 22:00–23:00, then we used 22:30 as the point of time. According to the distribution of different night sleep duration and studies,15 the self-reported sleep duration was analysed categorically (<7 hours, 7 to <8 hours, 8 to <9 hours and ≥9 hours). Subjective sleep quality was asked by the following question: ‘What do you think of your sleep quality in the prior month?’. Answer options included excellent, good, bad and awful. Subjective sleep quality has been proved to have the highest correlation with the global score among the seven factors when researchers evaluated the Chinese version of PSQI,16 thus we used it to assess the participants’ sleep quality. Besides, participants were also asked, ‘How often do you work at night shift in the past month?’ and ‘how often do you use sleeping medication?’. Response options included (1) not during the past month; (2) less than once a week; (3) once or twice a week and (4) three times or more a week.
FG, TG and HDL-C
Participants were required to fast for at least 12 hours before the blood sample was obtained the following morning. TC and HDL-C were measured using the Hitachi 7600 automated biochemical analyser (Hitachi, Tokyo, Japan). All procedures were performed by the trained professional medical assistant and staff at the medical examination centres.
Anthropometric measurement
All anthropometric measurements were assessed with participants wearing light clothing without shoes before breakfast. Height was measured to the nearest 0.1 (cm), and weight (kg) was measured to the nearest 0.1 (kg) by the professional medical staff of the medical examination centres using the same calibrated electronic scale (GL-310, Seoul, Korea), zeroed before each measurement. BMI was expressed as body weight (kg) divided by squared body height (m2).
Demographic characteristics
Participants were asked to report their age, gender, ethnic group, highest education level, marital status and employment status.
T2D definition
We defined T2D as having diagnosed medical history of T2D and/or FG concentration ≥7.0 mmol/L.17
Other covariates
Alcohol drinking, smoking and physical exercise were also evaluated in the questionnaire. Participants who reported had been smoking for more than half a year were defined as smokers. In contrast, those who reported having smoked but later quit for a sustained period of half a year or longer by the interview time were former smokers. Those who indicated consuming alcohol at least once a week were defined as alcohol drinkers. Those that had been away from drinking alcohol for half a year or longer by the time of the interview were drinking abstainers. Physical exercise was described as an exercise once a week or more for at least half an hour each time.
Statistical analysis
Data were input, stored, and managed centrally. Sleep duration was categorised into four groups (<7 hours, 7 to <8 hours, 8 to <9 hours and ≥9 hours) in the statistical analyses. Outcomes in this study were FG, TG/HDL-C and BMI. Continuous variables tested normally distributed were expressed as mean±SD. TG/HDL-C, which conformed to a right-skewed distribution, was logarithmically converted to lg (TG/HDL-C). One-way analysis of variance (ANOVA) was used to perform the unadjusted group comparisons of normally distributed continuous variables. The other continuous variables not normally distributed were summarised as median with IQR. Categorical variables were described as percentages and compared using Pearson’s  test.
test.
Based on the scatter plot and the mean graph of ANOVA, we assumed that night sleep duration has curvilinear (U-shaped) correlations with FG and TG/HDL-C and linear correlation with BMI. Multiple linear and curvilinear regression models were performed to identify the assumed independent linear or U-shaped associations of FG, TG/HDL-C and BMI with sleep duration using FG and TG/HDL-C as dependent variables. In Model 1, FG and TG/HDL-C were regressed on night sleep duration after adjusting for sex, age, occupation, highest education, marriage status, physical exercise, BMI, subjective sleep quality, and sleeping drug use. In model 2, FG and TG/HDL-C were regressed on night sleep duration using both a linear and a quadratic term to identify the assumed U-shaped relation after adjusting for sex and age. In model 3, BMI was additionally included as a possible explaining factor to the relation tested in model 2. In model 4, occupation, highest education, marriage status, physical exercise, subjective sleep quality and sleeping drug use were additionally included as possible confounders.
In model 5, a multiple linear regression model was performed to explore the independent association of BMI with sleep duration after adjustment of sex, age. In model 6, occupation, highest education, marriage status, physical exercise, subjective sleep quality and sleeping drug use were included as potential confounding factors. It was tested whether the linear associations of BMI with sleep duration in model 5 remain present. A two-sided p<0.05 was considered statistically significant. We used Epidata V.3.0 to input and manage the data and Stata V.15.1 to analyse the data.
Patient and public involvement
No patients were involved in the design of this study, the specific aims or the research questions, nor were they involved in the recruitment and conduct of the study. No patients were involved in interpreting study results or write-up of the manuscript. There are no plans to disseminate the research results to study participants.
Results
Participant characteristics
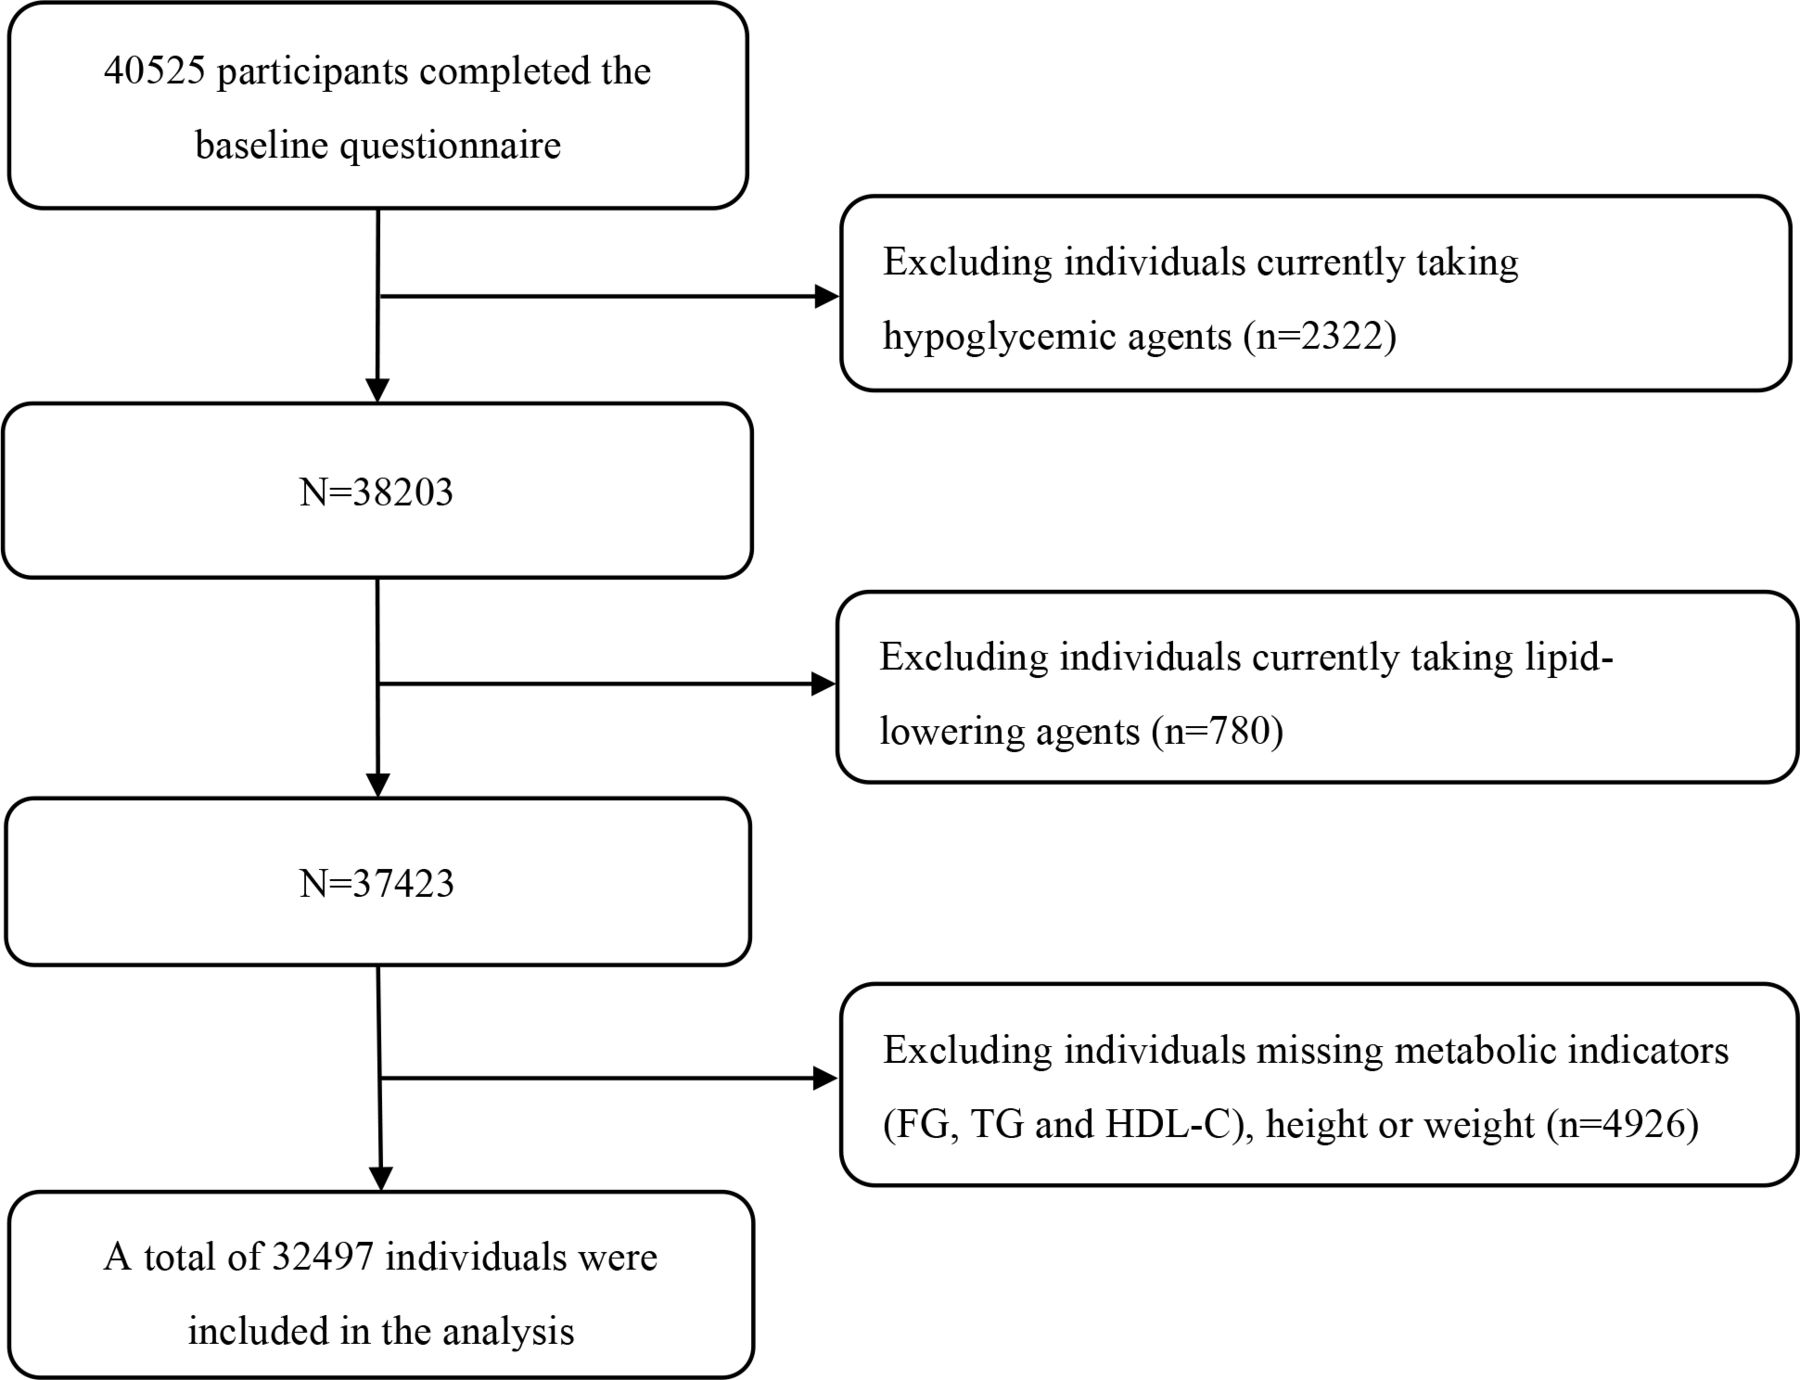
Overall, 40 525 participants completed the baseline questionnaire. After excluding those who were currently taking hypoglycaemic agents (n=2322), or lipid-lowering agents (n=780), or missing metabolic indicators (FG, TG, HDL-C) or height or weight (n=4926), a total of 32 497 individuals were included in the final analysis. The study population selection process is shown in figure 1. Key participant’s characteristics are summarised in table 1. Participants’ age ranged from 18 to 99 (median=44, IQR: 35–56) years, and over half (52.5%) of the participants were men. Self-reported sleep duration and sleep quality were also presented in table 1. Specifically, characteristics were stratified by sleep duration. In short, the proportions of participants who reported different sleep durations were 12.80% (<7 hours), 38.06% (7 to <8 hours), 39.47% (8 to <9 hours) and 9.67% (≥9 hours). More than 40% (42.54%) of the participants reported excellent sleep quality. None of the participants work on the night shift in our cohort.

Flow chart of study population selection.
Characteristics of participants without diagnosed diabetes according to level of night sleep duration
Nearly 90% of participants (89.52%) had normal blood glucose (≤6.0 mmol/L), 6.91% had impaired FG (IFG) and 3.57% had T2D but were not diagnosed or received any treatment. The averages of FG, BMI, TG, HDL-C and TG/HDL-C were 5.28 mmol/L, 24.45 kg/m2, 1.49 mmol/L, 1.33 mmol/L, and 0.96, respectively. The association between age, gender, marital status, education level, employment status, physical exercise, subjective sleep quality and the use of sleeping medication, FG, BMI, TG, HDL-C, TG/HDL-C were all statistically significantly different in sleep duration (all p<0.001). Ethnicity was not significantly associated with varying durations of sleep.
Associations of night sleep duration with FG, TG/HDL-C and BMI
Results of one-way ANOVA were presented in table 2. We found statistically significant differences in FG, TG/HDL-C and BMI at different night sleep durations (all p<0.001, shown in figure 2). Compared with those reported sleep durations was 7 to <8 hours, FG was higher among sleep duration was <7 hours and ≥9 hours (p=0.018 and p=0.008, respectively). Similarly, TG/HDL-C was significantly higher among sleep duration <7 hours and 8 to <9 hours than the reference group (p=0.001 and p=0.002, respectively). In terms of BMI, the average BMI among those who reported less than 7 hours of sleep duration was significantly higher than the other three groups (p≤0.001 for all).

Mean values and 95% CIs for fasting glucose, TG/HDL-C and BMI levels according to self-reported night sleep duration TG/HDL-C is expressed as the geometric mean. *Multiple comparison results of ANOVA p<0.05. (A) Fasting glucose concentrations in the night sleep duration<7 hours and ≥9 hours group were significantly higher than those in the control group with night sleep duration of 7 to <8 hour (p=0.018, p=0.008). (B) TG/HDL-C in the night sleep duration<7 hours and eight to <9 hours group were significantly higher than that of the control group with night sleep duration of 7 to <8 hours (p=0.001, p=0.002). (C) There were significant differences in BMI between the sleep duration<7 hours group and the 7 to <8 hours, 8 to <9 hours and ≥9 hours groups (p=0.001, p<0.001, p<0.001). There were significant differences in BMI between seven to <8 hours group and 8 to <9 hours group and ≥9 hours group (p=0.001, p<0.001). There was no significant difference in BMI between 8 and <9 hours group and ≥9 hour group (p=0.834). ANOVA, analysis of variance; BMI, body mass index; HDL-C, high-density lipoprotein cholesterol; TG, triglyceride.
Multiple linear regression results of FG and lg (TG/HDL-C) according to night sleep duration
We observed a U-Shaped relationship for sleep duration and FG and therefore tested whether the U-shaped relationship was statistically significant. Results were shown in table 2. In the completely adjusted multiple linear regression model 1 (adjusted for sex, age, BMI, occupation, marital status, education, physical exercise, subjective sleep quality, taking sleep medications), night sleep duration is positively associated with FG (β=0.012, p=0.029). In multiple curvilinear regression model 2 (adjusted for age and sex), both the linear (β1=−0.153, p=0.007) and the quadratic terms (β2=0.011, p=0.004) of night sleep duration are statistically significant. The U-shaped relationship remains present in model 3 where we adjusted for age, sex and BMI. In the multiple curvilinear regression model (model 4) completely adjusted for sex, age, BMI, occupation, marital status, education, physical exercise, subjective sleep quality and taking sleep medications, both the linear (β1=−0.111, p=0.047) and the quadratic terms (β2=0.008, p=0.026) of night sleep duration are statistically significant, indicating the U-shaped relationship between night sleep duration and FG, and the top point calculated is 6.9 hours.
We used the same statistical models to analyse the association between night sleep duration and TG/HDL-C. Specifically, night sleep duration is not significantly associated with lg (TG/HDL-C) in the completely adjusted linear regression Model 1 (adjusted for sex, age, BMI, occupation, marital status, education, physical exercise, subjective sleep quality and taking sleep medications, p=0.304). After adjusting for sex and age in curvilinear regression model (model 2), both the linear (β1=−0.040, p=0.017) and the quadratic terms (β2=0.003, p=0.023) of night sleep duration are significant. However, in model 3 when we adjusted for sex, age, and BMI, neither the linear nor the quadratic term of night sleep duration was significant anymore (p=0.139, p=0.117). In the final curvilinear regression model (model 4) completely adjusted for sex, age, BMI, occupation, marital status, education, physical exercise, subjective sleep quality, taking sleep medications, neither the linear nor the quadratic term of night sleep duration was statistically significant (p=0.365, p=0.310).
Lastly, the BMI changes in different sleep duration categories showed a linear tendency, so we established multiple linear regression models to test whether the association is statistically significant. In the model adjusted for age and sex (model 5), night sleep duration was inversely associated with BMI (β=−0.154, p<0.001). In model 6, which was completely adjusted for sex, age, occupation, marital status, education, physical exercise, subjective sleep quality, taking sleep medications, BMI remains independently associated with night sleep duration (β=−0.154, p<0.001). For each hour of additional night sleep duration, the adjusted BMI decreased by 0.15 kg/m2.
Discussion
Using a large, FG diverse sample free of T2D or without diagnosed and treated T2D, our current study demonstrated an independent U-shaped relationship between sleep duration and FG with the optimal sleep duration 6.9 hours, indicating that both short and long night sleep were associated with higher measures of glycaemia after controlling for demographic characteristics, lifestyles and BMI. We also found a BMI mediated association between sleep duration and TG/HDL-C after adjusting for sex and age, and an inverse linear association of sleep duration with BMI after control of demographic characteristics and lifestyles.
The findings of the U-shaped relationship between sleep duration and FG are consistent with the research among overweight or obese adults with pre-diabetes or recently diagnosed untreated T2D in the USA.12 Similar results were also found in a cross-sectional study among adults aged over 40 in China,18 but the association was only found among female participants, where short (<6 hours) and long (≥8 hours) night sleep duration increased the risk of higher measures of glycaemia (OR=1.12, OR=1.14). However, findings on the relationship between sleep duration and glycaemia or diabetes were equivocal. A cross-sectional study conducted in South Korea only observed the association between short sleep duration and IFG among male participants,19 whereas long sleep duration was not associated with IFG. However, a cohort study conducted in China among middle-aged and older adults revealed that long sleep duration was an independent predictor of incident diabetes,8 and similar results were confirmed among a group of retired Chinese adults.9 We speculate there are several potential reasons for the inconsistency of the results. First, the above studies were conducted in different settings and among diverse populations, where sleep duration and subjective sleep quality vary across cultures and countries,20 21 thus may alter the associations between sleep profiles and diabetes risks.22 23 Second, differences in participants’ demographic characteristics may also influence the correlation between sleep duration and blood glucose.
Multiple experimental studies have assessed the role of sleep in controlling energy balance and glucose metabolism and revealed that sleep restrictions could lead to glucose dysregulation through several biological pathways. One is by altering levels of neurohormones that regulate eating behaviours. It is suggested that acute sleep deprivation leads to a 28% increase in the average level of appetite-stimulating hormones, while the average level of leptin decreases by 18%. Besides, lack of sleep is associated with increases in hunger, appetite and hedonic food intake, especially for high-calorie food.24 Another possible way for insufficient sleep to induce T2D is through activation of the sympathetic nervous system. Insufficient sleep can reduce glucose tolerance, increase cortisol levels and heart rate variability. These neuroendocrine changes interfere with the mechanism of regulating blood glucose, resulting in elevated steady-state blood glucose concentrations.25 Additionally, activation of inflammatory pathways may also play a role in the link between short sleep duration and impaired glucose metabolism. Studies have confirmed that insufficient sleep is associated with increases in tumour necrosis factor, interleukin 6 and C reactive protein.26 27 Long sleep duration has many similar potential metabolic problems, but it may differ from short sleep duration.6 28 Several studies have demonstrated that prolonged sleep duration can affect energy metabolism throughout the human body and thereby increase the risk of T2D through various possible complex mechanisms, including poor sleep quality, sedentary lifestyle, unhealthy dietary habits and circadian rhythm.29 These results suggest that interventions in behavioural patterns such as a sedentary lifestyle may promote healthy sleep habits, balance fasting blood glucose, thus prevent T2D.
In this study, we only observed the U-shape relationship between night sleep duration and TG/HDL-C after adjusting for age and gender. After adjusting for BMI, this association was no longer significant, suggesting BMI may mediate the association between sleep duration and TG/HDL-C. At present, the association between sleep duration and TG/HDL-C is not consistent in the literature. A cross-sectional study of Danish adults did not find a significant correlation between sleep duration and TG/HDL-C,30 while a cohort study among Mexican adolescents revealed that the two variables were independently related.31 Considering the importance of adjusting BMI on the results, there are at least two explanations for the BMI adjusted model. First, insufficient sleep and sleep disturbance may increase BMI, leading to impaired glucose homoeostasis. There is evidence that BMI may mediate the association between insulin and glycosylated haemoglobin concentrations and short sleep duration.32 Second, our research found that BMI decreases with the increase of sleep duration, and thereby BMI may be a confounding variable between sleep duration and TG/HDL-C.32 Future studies should research the effect of sleep duration on insulin resistance.
Lastly, our findings revealed an inverse association between night sleep duration and BMI. This finding is consistent with previous studies among adolescents and adults,33 34 and the association was generally consistent across different categories of age, educational level, smoking status, BMI and physical activity level.35 Although some studies suggested that long sleep duration is also a risk factor for obesity and BMI increase,36 37 the evidence is insufficient among different races and populations.38 Many factors such as race/ethnicity, tobacco use, sedentary behaviours may confound the proposed association.35 Short sleep duration has been proved to be a potential risk factor for obesity and insulin resistance.5 Insulin resistance is considered a common pathological basis of metabolic syndrome and a risk factor for T2D.39 This study found that sleep duration is U-shaped with blood glucose, linearly related to BMI and the U-shaped relationship with TG/HDL-C disappeared after adjusting BMI, which suggested that sleep duration has more complex effects on blood glucose and insulin resistance. These associations may also indicate that short sleep duration can either directly increase blood glucose or affect insulin resistance through different pathways, including obesity, which indirectly leads to glucose dysregulation and breaks blood glucose homoeostasis. It can also directly increase insulin resistance by changing glucose metabolism.40
Several studies have previously found that the relationship between night sleep duration and FG, T2D and metabolic risk varies across genders and ages,41 42 but the mechanisms behind this age-based and gender-based difference are not totally explored. Sleep is regulated by various internal mechanisms involving neurotransmitters, hormones and peptides. People often experience significant changes in sleep architecture with age, and the ability to sleep decreases with the ageing process,43 with reduced sleep duration requirements.44 45 Studies have found that sleep duration decreases with age,42 and the prevalence of insomnia is higher in the elder population compared with the younger populations.46 However, many of the mechanisms that influence sleep are sexually dimorphic and are also related to sex hormones,47 which may contribute to the gender difference. Hormones such as luteinising hormone (LH), follicle-stimulating hormone, progesterone, and oestrogen evoke changes in circadian rhythms and sleep architecture.48 Both animal and human studies have shown that progesterone reduces arousal and has a sedative effect,49 while oestrogen increases the turnover of the neurotransmitter norepinephrine and subsequently increases the duration of REM sleep and reduces REM latency.47 During perimenopause, women experience a sharp decline in progesterone and a decrease in reproductive hormones associated with reduced melatonin synthesis and secretion, which may subsequently affect sleep.50 At the same time, decreased oestrogen and progesterone production may adversely affect the circadian regulation of glucose metabolism in perimenopausal women.51 We adjusted for age and gender in multivariate models to address the potential age-induced and gender-induced confounding effects.
We have observed associations of sleep duration with FG and BMI, as both long and short sleep duration are associated with increased FG levels, and short sleep duration is also associated with increased BMI, which is an essential contributor to T2D. Our findings may have preventive and clinical implications for adults without T2D, with elevated FG or undiagnosed T2D, suggesting that sleep should be limited to 7–9 hours per night, which may maintain metabolic homoeostasis, and thus reduce the development and progression of T2D.Our study has several strengths. First, our cohort has a large number of adults as study samples. The age and gender composition are close to that of the total Chinese population,52 the age span is large (18–99 years), and participants have diverse occupational and educational backgrounds. All these increased the generalisability of our findings. Second, we studied adults with various diabetes status, including adults with normal blood glucose, pre-diabetes (impaired blood glucose), and adults with T2D but were not diagnosed or receiving treatment. In addition, we excluded adults taking lipid-lowering drugs. Therefore, the interference of treatment on blood glucose and blood lipids was well controlled when analysing the effect of sleep on FG and TG/HDL-C. Lastly, this is a multisite study. Participants were recruited from seven different centres in the Beijing-Tianjin-Hebei Region, and a standardised sleep questionnaire was used across all centres. All metabolic markers’ measurements adopted the same methods and standards, which substantially reduced the measurement errors and improved the results’ reliability.
The strengths should be interpreted with the limitations. Due to this study’s cross-sectional nature, we cannot examine the temporality of the associations between sleep duration and FG, TG/HDL-C and BMI. Meanwhile, sleep duration and sleep quality were self-reported and subject to social desirability bias and recall bias. Future research should implement objective measurements to obtain more accurate sleep durations. However, a study showed good correlations between actigraphy and sleep logs when measuring sleep duration, and the self-reported data were reliable.53 It is not feasible to obtain sleep duration through actigraphy due to the large sample size of this study. Therefore, we believe self-reported data collection was the most appropriate approach. Studies have found that both daytime naps and sleep onset timing was associated with an increased risk of hyperglycaemia in both men and women.18 54 Nevertheless, in the current research, we did not collect information about daytime naps and the impact of daytime naps and sleep onset timing on the studied metabolic indices was not analysed. Holistic sleep characteristics were recommended to collect in future studies to examine the comprehensive effects of sleep on metabolism. Finally, the study population was all those who participated in the physical examination in the physical examination centre, most of whom were civil servants and professionals with a relatively high education level and none of whom were night-shift workers. In the future, more different populations should be included to verify the relationship between sleep duration and FG.
Conclusion
There is an independent U-shaped association between night sleep duration and FG with the optimal sleep duration 6.9 hours, indicating that both short and long sleep are associated with elevated blood glucose levels. The inverse linear association of sleep duration and BMI indicates short sleep is associated with elevated BMI while long sleep is associated with decreased BMI. In addition, the U-shaped relationship between sleep duration and TG/HDL-C is mediated by BMI. It is suggested that sleep affects blood glucose and insulin resistance through various mechanisms, and one of them may be through BMI. Prospective research is warranted to better delineate the relationship between night sleep duration and glycaemia. Our findings suggest that optimal sleep duration is important for maintaining glucose homoeostasis, individuals with IFG or undiagnosed T2D may require more clinical attention targeting sleep duration to decrease the conversion from pre-diabetes to diabetes or delay the progression of diabetes.
Data availability statement
Data are available on reasonable request. The datasets used and/or analysed during the current study are available from the corresponding author on reasonable request. Data will be shared with bona fide researchers submitting a research proposal requesting access to data. Data use is subject to approval by the independent review board.
Ethics statements
Patient consent for publication
Ethics approval
The study protocol was approved by the ethics review boards of Nankai University (NKUIRB2016063), Tianjin First Central Hospital (2017N052KY), Tianjin Union Medical Center (2018C02) and Hebei Medical University (2016021). The research procedures were carried out strictly following the Declaration of Helsinki. All methods were carried out in accordance with relevant guidelines and regulations. Written informed consent was obtained from each participant.
References
Footnotes
Contributors All authors contributed substantially to the study. MinZ has designed the study, supervised and oversaw the study implementation, and wrote the manuscript. JH conducted the investigation and analysis of the data. JH and CH wrote the manuscript. LZ, CL, SC, XQ, YN and MiaZ have organised and managed the investigation. BZ, YW, YF, PG, FL, RZ, QL, SM, LZ, CL, SC, XQ, YN and MiaZ have participated in the investigation and the management of the data. All authors read and approved the final manuscript. MinZ is the guarantors of this work and, as such, had full access to all of the data in the study and take responsibility for the integrity of the data and the accuracy of the data analysis.
Funding This study was supported by the Chinese Key Research & Development Program (grant number: 2016YFC0900600, 2016YFC0900604). The funders had no involvement in or influence on this study.
Competing interests None declared.
Patient and public involvement Patients and/or the public were not involved in the design, or conduct, or reporting, or dissemination plans of this research.
Provenance and peer review Not commissioned; externally peer reviewed.