Article Text

Abstract
Objective To explore the interaction effect between overweight/obesity and alcohol consumption on hypertension risk.
Design A longitudinal study of the independent and combined effects of hypertension risk factors.
Setting Twelve provinces in China, including Beijing Liaoning, Heilongjiang, Shanghai, Jiangsu, Shandong, Henan, Hubei, Hunan, Guangxi, Guizhou and Chongqing.
Participants Longitudinal data of China Health and Nutrition Survey, collected between 2011 and 2015, were used in this study. A total of 13 121 residents from 12 provinces were included and completed physical examinations and questionnaires at baseline.
Outcome First incidence of hypertension.
Results Over a mean follow-up of 4 years, 690 incident hypertension cases were reported. After adjusting for age, gender, education level, marital status, physical activity, diabetes and smoking, high body mass index (BMI) and light drinking (OR=5.07, 95% CI 3.06 to 8.41), high waist circumference (WC) and light drinking (OR=4.81, 95% CI 2.92 to 7.91), high waist hip ratio and light drinking (OR=2.85, 95% CI 1.84 to 4.42) were the highest risk of all participants in the three combinations. Multiplicative interaction measures were statistically significant in overweight/obesity and drinking/light drinking/heavy drinking categories in men (p<0.05). Additive interactions were observed between high BMI and drinking in men (relative excess risk due to interaction=1.75, 95% CI 0.85 to 2.65, attributable proportion due to interaction=0.56, 95% CI 0.36 to 0.76, synergy index=6.43, 95% CI 1.02 to 28.84).
Conclusions Measures of body weight and size, particularly BMI and WC, appear to interact synergistically with alcohol consumption to increase the risk of hypertension in the Chinese population. Given that approximately 245 million people in China have hypertension, and that hypertension is a major cause of cardiovascular disease worldwide, our results may have implications for chronic disease prevention.
- Hypertension
- EPIDEMIOLOGY
- Risk management
- Public health
Data availability statement
Data are available in a public, open access repository. Data supporting the conclusions of this study can be obtained through the China Health and Nutrition Survey (CHNS) database (https://www.cpc.unc.edu/projects/china).
This is an open access article distributed in accordance with the Creative Commons Attribution Non Commercial (CC BY-NC 4.0) license, which permits others to distribute, remix, adapt, build upon this work non-commercially, and license their derivative works on different terms, provided the original work is properly cited, appropriate credit is given, any changes made indicated, and the use is non-commercial. See: http://creativecommons.org/licenses/by-nc/4.0/.
Statistics from Altmetric.com
Strengths and limitation of this study
This is a relatively large longitudinal study of a representative sample of men and women from 12 provinces in China.
Our study classified alcohol consumption into several consumption categories and further explored possible interactions among several measures of overweight/obesity on the incidence of hypertension.
Follow-up of study participants was limited to the 4 years between 2011 and 2015, so the impact of risk factors on hypertension over a longer time period could not be examined.
Whereas our study considers three important measures of body weight and size, we lacked measurements of body fat composition.
Alcohol consumption was self-reported and is, therefore, subjected to measurement error.
Introduction
Hypertension is a worldwide public health issue. The global prevalence of hypertension has shown an upward trend, from 17.3% in 1990 to 20.5% in 2015.1 2 In China, it is estimated that 245 million adults have hypertension, accounting for 23.2% of the total.3 Hypertension can lead to numerous adverse health outcomes, such as cardiovascular and cerebrovascular diseases and premature death.4 5 About two-thirds of stroke and 50% of coronary heart disease worldwide have been attributed to hypertension.6 Moreover, an annual 9.4 million deaths worldwide are related to suboptimal blood pressure (BP) control.7 The global economic burden of hypertension is enormous, accounting for about 10% of the world’s overall healthcare expenditure.5 Accordingly, a better understanding of the factors related to risk of hypertension is imperative for reducing the burden of this disease.
Hypertension is a multifactorial disease that results from various genetic, demographic and/or lifestyle factors.5 Among these factors, overweight/obesity and alcohol consumption are two modifiable risk factors that are important targets for controlling the occurrence and development of hypertension. In recent years, the positive correlation between overweight/obesity and the risk of hypertension has been widely reported.8–12 Obese people appear to have a 3.5-fold increased risk of hypertension compared with those of normal weight. Regarding alcohol consumption, studies generally have found that heavy drinking is an independent risk factor for hypertension, but associations with light-to-moderate drinking and BP have been less consistent.13–15 Several studies suggest that light-to-moderate drinking can reduce BP compared with non-drinking, even though heavy drinking increases risk (ie, a ‘J’ relationship),15 although some other studies have shown a monotonic positive association with alcohol consumption.13 14
In general, scholars tend to pay more attention to the relationships between independent risk factors and outcomes and often fail to explore possible interactions among risk factors. Relatively few studies have explored the possible interaction between overweight/obesity and alcohol consumption on hypertension risk, and they are differed in their definition and categorisation of overweight/obesity interactions,16 17 which may have hindered the consistency and interpretability of previous findings. Therefore, considering standard definitions of relevant variables, this longitudinal study aimed to explore whether there is an interaction effect between overweight/obesity defined by body mass index (BMI), waist circumference (WC), waist hip ratio (WHR) and alcohol consumption on hypertension risk in a large, representative sample of Chinese adults.
Methods
Study design and subjects
The China Health and Nutrition Survey (CHNS) used a multistage random-cluster sampling to recruit participants from 15 provinces in China (described in greater detail elsewhere).18 The CHNS data were collected in 1989, 1991, 1993, 1997, 2000, 2004, 2006, 2009, 2011, and the latest update was in 2015. According to the 2010 census, the provinces covered by CHNS accounted for 47% of China’s population in 2011.19 Considering the sample size, variables and time of data measurement, we used CHNS data collected from 2011 to 2015 for the present study.20 A total of 13 121 participants completed the 2011 baseline survey. We excluded participants with missing data (n=5 225), participants with baseline hypertension (n=1 545), BMI ≤18.5 kg/m2 (n=345) and follow-up for less than 4 years (n=2 800). After exclusions, 3 206 participants were included in the analysis.
Exposure assessment
BMI, WC and WHR
Height, weight, WC and HC were measured by well-trained personnel according to a standardised protocol from the WHO.21 Participants were standing without shoes, wearing lightweight clothes. Weight and height were measured with a calibrated beam scale and a portable stadiometer, respectively. With the tape measure in a horizontal position, WC was taken at the midpoint between the iliac crest and the inferior border of the last rib at the end of exhalation. Similarly, HC was measured at the fullest part of the hip. Height, WC and HC were measured to the nearest 0.1 cm, and weight was measured to the nearest 0.1 kg. To reduce measurement errors, the above indicators were measured two times, and the average value was calculated as the recorded value. BMI (kg/m2) was calculated by the participant’s weight (kg)/height (m2). WHO suggested that BMI classification was used for defining overweight (25≤BMI<30 kg/m2), and obesity (BMI ≥30 kg/m2). Abdominal obesity was defined as WC: men ≥90 cm, women ≥85 cm and/or WHR: men ≥0.90, women ≥0.85.22 This study merged overweight, obesity and abdominal obesity to form three new categories of high BMI (BMI ≥25 kg/m2), high WC (men ≥90 cm, women ≥85 cm) and high WHR (men ≥0.90, women: WHR ≥0.85), respectively.
Drinking
In the CHNS database, information on alcohol consumption was logged by three questionnaire questions, including: (1) ‘have you consumed beer, liquor, or other alcoholic beverages in the last year?’ (yes or no); (2) ‘Frequency of alcohol consumption’ (never, less than weekly, weekly and daily); (3) ‘How many beer (bottles)/wine (liang)/liquor (liang) do you drink each week?’. Alcohol consumption was calculated as average grams of ethanol intake per day (g/day), based on the amount of alcoholic beverage consumed multiplied by the corresponding average ethanol content of that beverage (white spirit: 40%, beer: 5%, wine: 12%).23 24 According to the Dietary Guidelines for Americans 2015–2020 issued by US Department of Agriculture and US Department of Health and Human Services, one standard drink was defined as a beverage containing 14·0 g ethanol.25 Based on this, participants were divided into four alcohol consumption categories: never, light (women: 0~0.4 servings/day; men: 0~0.9 servings/day), moderate (women: 0.5~1.0 servings/day; men: 1~2 servings/day), and heavy alcohol consumption (women : >1.0 servings/day; men: >2 servings/day).25
Outcome
All BP values (systolic and diastolic) were measured according to the seventh Chinese Joint National Commission guidelines.26 After sitting still for 10 min, participant’s BP was measured three times on the right arm by well-trained personnel using a mercury sphygmomanometer. The participants rested for at least 1 min at each measurement interval. The mean of the three measurements was used in all analyses. Hypertension was defined as systolic BP ≥140 mmHg and/or diastolic BP ≥90 mmHg and/or a self-reported previous diagnosis of hypertension and/or using antihypertensive drugs currently.
Covariates
The variables controlled for in this study were taken into consideration after an extensive literature review and collected through questionnaires,27 28 including age, gender (male, female), education level (primary school or below, secondary school or senior high school, junior college or undergraduate, postdgraduate or above), marital status (single, married, divorced, widowed), previous diabetes diagnosis (yes, no) and previous cigarette smoking (yes, no). Physical activity was categorised as light physical activity, medium physical activity and heavy physical activity based on International Physical Activity Questionnaire.29
Patient and public involvement
Neither patients nor members of the public were involved in the planning or conduct of this study.
Statistical analysis
SPSS 23.0 software was used for statistical analysis and statistical significance level was defined as p<0.05.
Study participants were divided into hypertension and non-hypertension groups based on whether hypertension events occurred during follow-up. Differences in baseline variables were described by median and IQR, and the Mann-Whitney U test was used for intergroup comparisons when data showed a skewed distribution; categorical data were represented by frequency and percentage, and comparisons between groups were conducted using the χ2 test.
Binary logistic regression was used to compute ORs and 95% CI of various risk factors on hypertension.
Multiplicative and additive interactions among overweight/obesity and drinking variables were examined with respect to their associations with hypertension risk. The overweight/obesity (BMI, WC, WHR) and drinking (yes/no, light, moderate, heavy) categories were coded into twelve dummy variables. The excel calculation table compiled by Andersson et al30 was used to generate the estimated values of the relative excess risk due to interaction (RERI), the attributable proportion due to interaction (AP), the synergy index (SI), relative risk and 95% CI. The SI interval not including 1, and the RERI and AP interval not including 0, indicated a statistically significant additive interaction effect. Multiplicative interaction was evaluated using the ratio of ORs of the product terms.
Results
Baseline characteristics of the research population
According to the occurrence of hypertension during follow-up, 3 206 participants who completed the follow-up were divided into a hypertension group (n=690) and a non-hypertension group (n=2 516), and the baseline characteristics of both groups were analysed and compared (table 1). Participants with hypertension were older than those without hypertension, were more likely to be men, smoke cigarettes and be physically active, were less likely to be single, had lower education levels and had higher baseline values of BMI, HC, WC and WHR (all p<0.05). Comparison of the lost-to-follow-up data and the completed follow-up data is shown in online supplemental appendix 1.
Supplemental material
Baseline characteristics of the participants divided by hypertension
Figure 1 presents the incidence of hypertension according to the presence of overweight/obesity (BMI, WC and WHR) and drinking (light, moderate and heavy) in six definitions. Except for women with high BMI/WC/WHR (+) and the non-drinking group, the incidence of hypertension was highest in participants with both risk factors among the three groups and was higher in men than in women. Regarding BMI and drinking, participants with high BMI and light drinking showed a particularly high incidence of hypertension (55.13%). Likewise, participants with high WC and light drinking, and high WHR and light drinking, had a high incidence of hypertension of 55.00% and 45.22%, respectively.

The incidence of hypertension according to presence of BMI, WC, WHR and drinking. There were no women patients with hypertension who reported light drinking (+). BMI, body mass index; WC, waist circumference; WHR, waist-to-hip ratio.
Association of overweight/obesity and drinking with hypertension
Measures of body weight and size and alcohol consumption were associated with hypertension risk (table 2). Before adjustment, participants with high BMI (OR=1.42, 95% CI 1.16 to 1.74), high WC (OR=1.84, 95% CI 1.46 to 2.32), drinking (OR=1.52, 95% CI 1.30 to 1.83), light drinking (OR=2.25, 95% CI 1.67 to 3.03) and heavy drinking (OR=1.38, 95% CI 1.13 to 1.67) showed an increased risk of hypertension as compared with those with non-overweight/obesity and non-drinking. After adjusting for potential confounding factors (including age, gender, education level, marital status, physical activity, diabetes and smoking), the risk trend of each variable on hypertension remained basically unchanged.
ORs of the association of hypertension with BMI, WC, WHR and drinking
Association of combination of overweight/obesity and drinking with hypertension
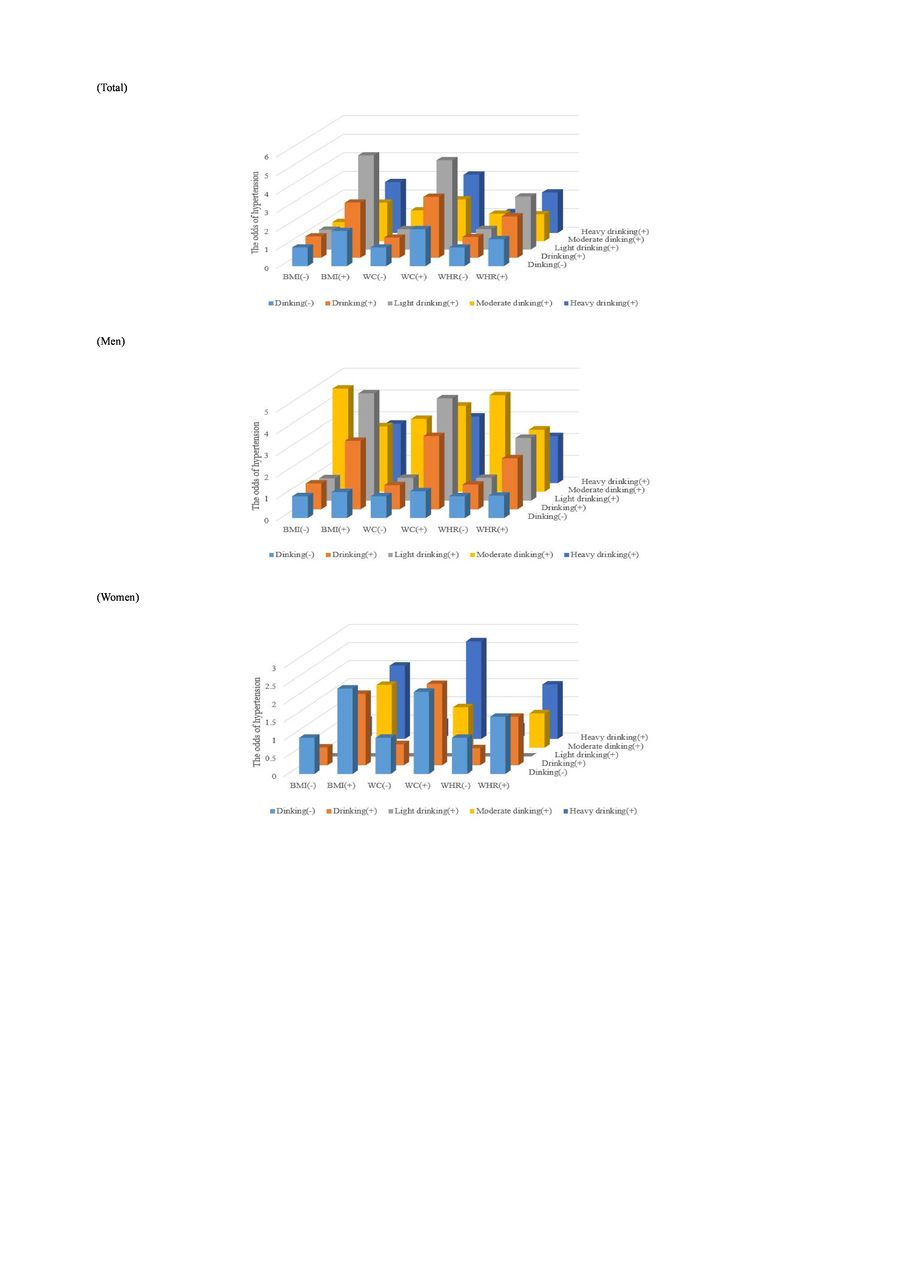
Compared with the reference group (non-drinking participants with normal body weight and size), high BMI and light drinking (multivariable-adjusted OR=5.07, 95% CI 3.06 to 8.41), high WC and light drinking (multivariable-adjusted OR=4.81, 95% CI 2.92 to 7.91), high WHR and light drinking (multivariable-adjusted OR=2.85, 95% CI 1.84 to 4.42) had the highest risks of hypertension among the three combinations (table 3, figure 2). In men, the results were basically consistent, with corresponding risks of hypertension for three groups of 4.75, 4.70 and 2.88 times higher than in the reference group, respectively. In women, the risk of hypertension was higher than that in men only in overweight/obesity and non-drinking groups, which were 2.36, 2.27 and 1.58 times higher than that in reference group, respectively.
The ORs for the presence of hypertension according to combination of overweight/obesity and drinking

The ORs for the presence of hypertension according to combination of overweight/obesity and drinking. There were no women patients with hypertension who reported light drinking (+). BMI, body mass index; WC, waist circumference; WHR, waist-to-hip ratio.
Interaction effect between overweight/obesity and drinking on hypertension risk
Multiplicative interactions were observed between overweight/obesity and drinking/light drinking/heavy drinking among total participants and separately among men (table 4). Regarding additive interactions, there was statistical significance among the total participants with high BMI and light drinking (RERI=3.12, 95% CI 0.63 to 5.62, AP=0.62, 95% CI 0.41 to 0.83, SI=4.29, 95% CI 1.82 to 10.11) and men with high BMI and drinking (RERI=1.75, 95% CI 0.85 to 2.65, AP=0.56, 95% CI 0.36 to 0.76, SI=6.43, 95% CI 1.02 to 28.84). Similarly, the additive interactions between high WC and drinking/light drinking/heavy drinking were significant in the total participants. No additive interaction was found between WHR and drinking.
Interaction analyses of overweight/obesity and drinking towards hypertension
Discussion
To our knowledge, this is the first study not only to assess the independent and combined effects of overweight/obesity and alcohol consumption on the risk of hypertension but also to explore potential interaction between them. In our study, all participants with high BMI and high WC, and men with light and heavy drinking, showed increased risk of hypertension after controlling for potential confounding factors. We also observed multiplicative interaction between overweight/obesity and drinking/light drinking/heavy drinking among men. However, additive interaction existed only between high BMI and drinking in men.
We found that BMI and WC were positively associated with the risk of hypertension, findings that are consistent with those of some (but not all) previous studies.31–33 Some previous studies have not found overweight/obesity to be associated with hypertension,34 35 whereas our study did find positive associations and indicated that high WC had a more significant impact on the risk of hypertension than high BMI. Activation of the sympathetic nervous system is an established mechanism whereby overweight/obesity can induce hypertension. Neurological studies have revealed a greater degree of sympathetic activation with abdominal obesity compared with systemic fat distribution.36 Therefore, WC may be an important target for intervention in treating and preventing hypertension, an idea supported by the diagnostic criteria of the National Cholesterol Education Program Adult Treatment Panel III (updated ATP III in 2005), the international diabetes federation (in 2005), and the joint interim statement (in 2009).37–39 Our results showed that alcohol consumption is associated with an increased risk of hypertension in men, even in the absence of overweight/obesity, which is also consistent with recent studies.40 41 Perhaps due to the small sample size of women consuming alcohol in our data, we did not observe an association between alcohol consumption and hypertension risk in women. Nonetheless, we found that overweight/obesity has a greater effect on the risk of hypertension than alcohol consumption in both men and women. It appears that weight control is an important means of preventing hypertension in men and women, as is moderation in alcohol consumption in men.
When interaction among aetiologic factors exists in a target population, adequately accounting for that interaction by researchers allows a more accurate description of the risk factors’ potential to cause harm, and hence the public health measures that are necessary to reduce that harm.42 Interaction can be assessed on both additive and multiplicative scales,43 44 whereas multiplicative interaction may be viewed as relevant to etiologic understanding, additive interaction may be viewed as a public health measure relevant to prioritising resource allocation in efforts at prevention. Consequently, both additive and multiplicative interaction analysis were performed in this study. Previous studies that evaluated interaction between overweight/obesity and alcohol consumption have been sparce. Consistent with the results of our study, a previous cohort study found an additive interaction between high WC and alcohol consumption on hypertension.17 A cross-sectional study reported that high BMI and alcohol consumption interact multiplicatively to increase prevalence of systolic hypertension.16
The mechanism of obesity-related hypertension and alcoholic hypertension are complex and multifactorial. Other than genetic and environmental factors, sympathetic nervous system, endothelium, renal and adrenal function, adipokines and insulin resistance appear to be mechanisms of action in obesity-related hypertension.4 The sympathetic nervous system, oxidative stress and inflammation, baroreceptor sensitivity, renin–angiotensin axis and increased vascular reactivity have been suggested as the causes of alcoholic hypertension.45 Given that the biological mechanisms of overweight/obesity and alcohol on hypertension are similar, it is reasonable that high BMI, high WC and alcohol consumption may interact in altering risk of hypertension. In addition, alcohol can lead to obesity by increasing total energy intake, inhibiting fat oxidation and promoting the release of glucocorticoid, so as to change the fat distribution pattern.46–48 This mechanism may also underlie interaction between overweight/obesity and drinking on hypertension risk.
Our study has three important limitations. First, the follow-up of study participants was limited to the 4 years between 2011 and 2015, so the impact of risk factors on hypertension over a longer period could not be examined. Second, whereas our study considers three important measures of body weight and size, we lacked measurements of body fat composition. Third, alcohol consumption was self-reported and is, therefore, subjected to measurement error.
Conclusion
This study explored the independent and combined effects of overweight/obesity and alcohol consumption on the risk of hypertension, as well as their potential multiplicative and additive interactions. Study participants with high BMI and light drinking, high WC and drinking/light drinking/heavy drinking and men with high BMI and drinking showed additive and multiplicative interactions with hypertension. If confirmed in future studies, such interactions will be important considerations when implementing programmes to mitigate the heath burdens due to hypertension.
Data availability statement
Data are available in a public, open access repository. Data supporting the conclusions of this study can be obtained through the China Health and Nutrition Survey (CHNS) database (https://www.cpc.unc.edu/projects/china).
Ethics statements
Patient consent for publication
Ethics approval
This study uses a public database: CHNS. The CHNS was approved by the Institutional Review Committees of the University of North Carolina at Chapel Hill and the National Institute of Nutrition and Food Safety, Chinese Center for Disease Control and Prevention. However, the ethical review ID was not made public. Participants gave informed consent to participate in the study before taking part.
Acknowledgments
This research uses data from China Health and Nutrition Survey (CHNS). We thank the National Institute for Nutrition and Health, China Center for Disease Control and Prevention, Carolina Population Center, the University of North Carolina at Chapel Hill, the NIH (R01-HD30880, DK056350, R24 HD050924 and R01-HD38700) and the NIH Fogarty International Cente for financial support for the CHNS data collection and analysis files from 1989 to 2015 and future surveys, and the China-Japan Friendship Hospital, Ministry of Health for support for CHNS 2009. Finally, the authors would like to thank the editors and reviewers for their valuable comments.
References
Supplementary materials
Supplementary Data
This web only file has been produced by the BMJ Publishing Group from an electronic file supplied by the author(s) and has not been edited for content.
Footnotes
Contributors XW put forward the initial idea and design the research scheme. JS wrote the first draft. ZH, SL and CW sorted out the data. JS and XR analysed the data. XW, MW and PDT revised the manuscript. JS, as guarantor, takes full responsibility for the overall content of the study, had access to the data, and controlled the decision to publish.
Funding This study was supported by Health Department of Shannxi Province (Number 2022SF-438).
Competing interests None declared.
Patient and public involvement Patients and/or the public were not involved in the design, or conduct, or reporting, or dissemination plans of this research.
Provenance and peer review Not commissioned; externally peer reviewed.
Supplemental material This content has been supplied by the author(s). It has not been vetted by BMJ Publishing Group Limited (BMJ) and may not have been peer-reviewed. Any opinions or recommendations discussed are solely those of the author(s) and are not endorsed by BMJ. BMJ disclaims all liability and responsibility arising from any reliance placed on the content. Where the content includes any translated material, BMJ does not warrant the accuracy and reliability of the translations (including but not limited to local regulations, clinical guidelines, terminology, drug names and drug dosages), and is not responsible for any error and/or omissions arising from translation and adaptation or otherwise.