Article Text

Abstract
Objective To assess changes in international mortality rates and laboratory recovery rates during hospitalisation for patients hospitalised with SARS-CoV-2 between the first wave (1 March to 30 June 2020) and the second wave (1 July 2020 to 31 January 2021) of the COVID-19 pandemic.
Design, setting and participants This is a retrospective cohort study of 83 178 hospitalised patients admitted between 7 days before or 14 days after PCR-confirmed SARS-CoV-2 infection within the Consortium for Clinical Characterization of COVID-19 by Electronic Health Record, an international multihealthcare system collaborative of 288 hospitals in the USA and Europe. The laboratory recovery rates and mortality rates over time were compared between the two waves of the pandemic.
Primary and secondary outcome measures The primary outcome was all-cause mortality rate within 28 days after hospitalisation stratified by predicted low, medium and high mortality risk at baseline. The secondary outcome was the average rate of change in laboratory values during the first week of hospitalisation.
Results Baseline Charlson Comorbidity Index and laboratory values at admission were not significantly different between the first and second waves. The improvement in laboratory values over time was faster in the second wave compared with the first. The average C reactive protein rate of change was –4.72 mg/dL vs –4.14 mg/dL per day (p=0.05). The mortality rates within each risk category significantly decreased over time, with the most substantial decrease in the high-risk group (47.1% in March–April 2020 vs 30.8% in November 2020 to January 2021, p<0.001) and a moderate decrease in the intermediate-risk group (21.5% in March–April 2020 vs 14.3% in November 2020 to January 2021, p<0.001).
Conclusions Admission profiles of patients hospitalised with SARS-CoV-2 infection did not differ greatly between the first and second waves of the pandemic, but there were notable differences in laboratory improvement rates during hospitalisation. Mortality risks among patients with similar risk profiles decreased over the course of the pandemic. The improvement in laboratory values and mortality risk was consistent across multiple countries.
- COVID-19
- Public health
- Epidemiology
Data availability statement
Only deidentifed aggregate data are available in a public, open access repository. Only deidentified aggregate data were provided by sites for this study. All aggregate data used in this study are available for download at www.covidclinical.net.
This is an open access article distributed in accordance with the Creative Commons Attribution Non Commercial (CC BY-NC 4.0) license, which permits others to distribute, remix, adapt, build upon this work non-commercially, and license their derivative works on different terms, provided the original work is properly cited, appropriate credit is given, any changes made indicated, and the use is non-commercial. See: http://creativecommons.org/licenses/by-nc/4.0/.
Statistics from Altmetric.com
Strengths and limitations of this study
Our federated approach avoided privacy concerns and regulatory barriers common in multicentre studies while facilitating timely international analyses of 83 178 patients from five countries.
Our common data model along with iterative quality control efforts provide assurance on harmonised data quality.
The current study may include patients who were either hospitalised due to COVID-19 or had a positive test for SARS-CoV-2 when admitted for an unrelated medical condition.
For most Consortium for Clinical Characterization of COVID-19 by Electronic Health Record participating healthcare systems, we were unable to capture all out-of-hospital mortality. However, most COVID-19-related mortality among inpatients occurs in the hospital and many discharged patients have postdischarge follow-up visits, which allow us to capture 28-day mortality reasonably well.
Introduction
Mortality rates among hospitalised patients with SARS-CoV-2 infection have decreased over the course of the COVID-19 pandemic.1–5 It has been hypothesised that this may reflect a higher proportion of younger patients being hospitalised later in the pandemic, but a recently published study reported significant decreases in mortality after stratification by age group.6 7 A variety of factors are likely responsible, including, but not limited to, improvements in clinical management, resource allocation and earlier detection of disease.8–15 There is limited evidence to shed light on these hypotheses; few studies have examined improvements of in-hospital recovery and outcomes over the course of the pandemic. In this international multihealthcare system retrospective cohort study, we leveraged electronic health records (EHRs) data from hospitalised patients with COVID-1916 to examine temporal shifts in (1) The rate of change for laboratory values towards normal during hospitalisation and (2) Mortality rates stratified by baseline mortality risk.
Methods
Individual-level EHR data on hospitalised patients with COVID-19 from 18 healthcare systems of the Consortium for Clinical Characterization of COVID-19 by EHR (4CE)17 18 were extracted and harmonised for this study. Onlineonline supplemental eTable 1 reports further metadata on the participating healthcare systems, which represent 288 hospitals across five countries: France, Germany, Italy, Spain and the USA. Each healthcare system ran the analyses locally and reported summary results to the central institution for federated analyses. This study followed the Strengthening the Reporting of Observational Studies in Epidemiology reporting guidelines.19
Supplemental material
Cohort identification and data collection
Our study included 83 178 patients admitted 7 days before to 14 days after the date of their first positive reverse transcription PCR SARS-CoV-2 test result recorded in their EHR. We included patients admitted between 1 March 2020 and 31 January 2021 with follow-up data up to June 2021.
We obtained patient-level data on demographics including age groups (18–25 years, 26–49 years, 50–69 years, 70–80 year, 80+ years), sex and race; laboratory test values during hospitalisation; International Classification of Disease (ICD) codes, date of discharge, and mortality information. Only US sites reported race. We calculated the Charlson Comorbidity Index (CCI) based on ICD codes.20–22 We focused on 10 laboratory tests: C reactive protein (CRP), albumin, alanine aminotransferase (ALT), aspartate aminotransferase (AST), total bilirubin, creatinine, D-dimer, leucocyte count, lymphocyte count and neutrophil count.10 23–27 A schematic of our workflow is presented in online supplemental eFigure 1.
Primary and secondary outcomes
We defined all-cause mortality up to 28 days after the admission date as the primary outcome and excluded patients who died on the day of admission in the survival analysis. Each 4CE healthcare system used local criteria to identify in-hospital mortality. We defined laboratory test values during hospitalisation as secondary outcomes.
Statistical analysis
To assess temporal changes over the course of the pandemic, we performed stratified analyses by every two calendar months and between two waves of the pandemic, where we defined the first wave as from 1 March to 30 June 2020 and the second wave as from 1 July 2020 to 31 January 2021.
We summarised demographic characteristics, the average CCI at admission, hospitalisation duration and absolute mortality risk over time. Since the Veteran Affair (VA) population has a distinct demographic composition, we reported demographic summaries excluding the VA. We further compared the distributions of admission laboratory values between the two waves.
To summarise the laboratory trajectories during hospitalisation, we fit log-linear mixed-effects models to the longitudinal laboratory data with cubic splines for time since admission, where we used three knots at days 3, 7 and 17 in the fixed effects to capture non-linear trends. Since laboratory trajectories may vary by how quickly patients recover, we stratified the trajectory analysis by the hospitalisation duration ≤1 week, 1–2 weeks and 2+ weeks. For each laboratory test, we summarised the average daily rate of change during the first week of hospitalisation in the first and second waves, denoted by R1 and R2. The laboratory trajectory analyses only included data from the USA, France and Spain since few patients from the Germany and Italy sites had repeated laboratory tests.
To study temporal changes in mortality risks, we fit least absolute shrinkage and selection operator (LASSO) penalised Cox proportional hazards models for mortality using baseline covariates adjusted for calendar time of the admission date.28 29 We considered three sets of covariates: (1) Age, sex and race; (2) The 10 laboratory tests; and (3) CCI. We modelled the calendar time effect using a cubic spline with knots every 2 weeks. We performed a loge-transformation to D-dimer, CRP and ALT due to the skewness in their distributions. Due to the high correlation between ALT and AST, we include AST to ALT ratio (AST/ALT) and logeALT as measures of liver function30 31 instead of logeAST and logeALT. We imputed missing baseline laboratory measures and CCI via multivariate imputation by the chained equation method and averaged over five imputed sets.32 The mortality analyses excluded Italy since a very small number of deaths was reported after April 2020 in the participating healthcare systems.
Using the trained penalised Cox model, we obtained a mortality risk score for each patient constructed using their baseline covariates. The candidate covariates included in the model training were determined according to existing clinical knowledge. We calculated the area under the receiver operating characteristics curve (AUC) of the risk score for predicting 28-day mortality.33 We classified patients into three mortality risk groups according to their risk score: high risk if score>chigh, medium risk if score ε (clow, chigh), and low risk if score ≤clow, where clow and chigh are classification thresholds. We chose clow and chigh to attain a sensitivity of 85% (clow) and a specificity of 85% (chigh) for predicting 28-day mortality, which ensures a good separation between the low-risk and high-risk categories. Stratifying by the calendar time window of the admission date, we calculated the AUC of the risk model, the proportions of patients belonging to each risk category and their corresponding mortality risks. The accuracy parameters were estimated via tenfold cross-validation to correct for overfitting.34 We used bootstrap to estimate SE.35
Patient-level analyses were performed within each 4CE healthcare system to obtain site-specific results. We integrated results from all sites using fixed-effects meta-analysis. Since the number of hospitalised patients had a different temporal trend across healthcare systems and across countries, we assigned the same weight across different calendar months for each healthcare system to facilitate effective comparisons between waves. All statistical analyses were performed using R software V.4.0.2.
Results
Characteristics of the study cohort
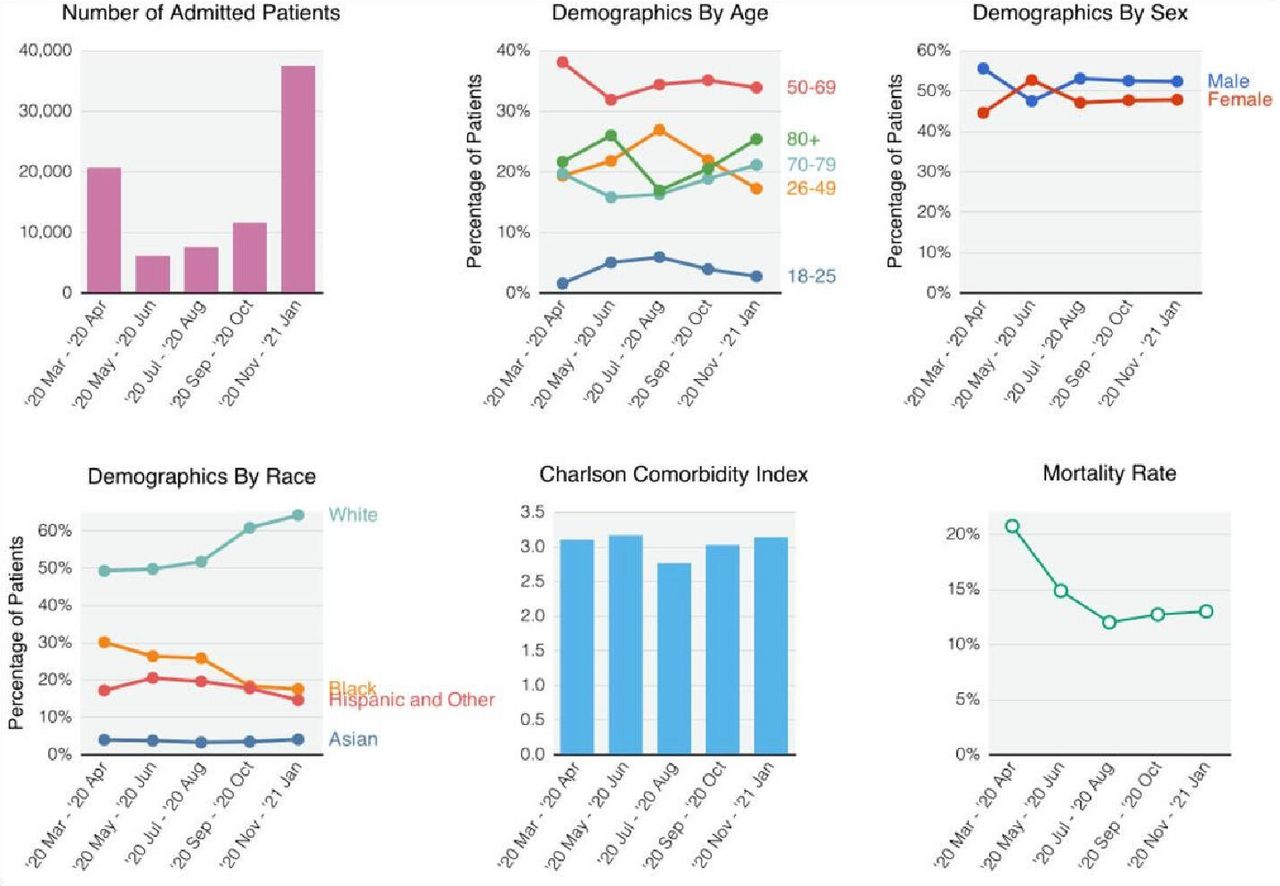
The majority of patients were hospitalised March–April 2020 and November 2020 to January 2021 (figure 1). The most prevalent age group at any time was ages 50–69 years. In the USA—excluding VA patients which are summarised in eFigure 2—the prevalence of patients who were white increased (49.1% in March–April 2020 to 64.1% in November 2020–January 2021, p<0.001), while the prevalence of patients who were black decreased (30.0% in March–April 2020 to 17.4% in November 2020–January 2021, p<0.001). The average CCI at admission remained relatively constant across time. The absolute 28-day mortality risk decreased from 20.7% in March–April 2020 to 11.9% in July–August 2020 (p<0.001), then increased slightly to 12.4% in November 2020–January 2021 (p<0.001). The temporal shifts in the number of hospitalised patients, demographics, CCI and mortality rate were generally consistent across countries (eFigure 2).

Demographic shifts. For demographic variables, we set male sex, age 50–69 years and white race as reference groups.
As shown in figure 2, observed CRP, creatinine and D-dimer values at admission were lower in the first wave compared with the second but these differences were not statistically significant. The between-wave CRP mean difference was higher for France (18.5 mg/dL; 95% CI 16.5 to 20.5) and Spain (8.4 mg/dL; 95% CI 4.8 to 12.0) compared with USA (7.5 mg/dL; 95% CI 6.1 to 8.8) and Germany (6.7 mg/dL; 95% CI 2.5 to 16.1) (eFigure 3).
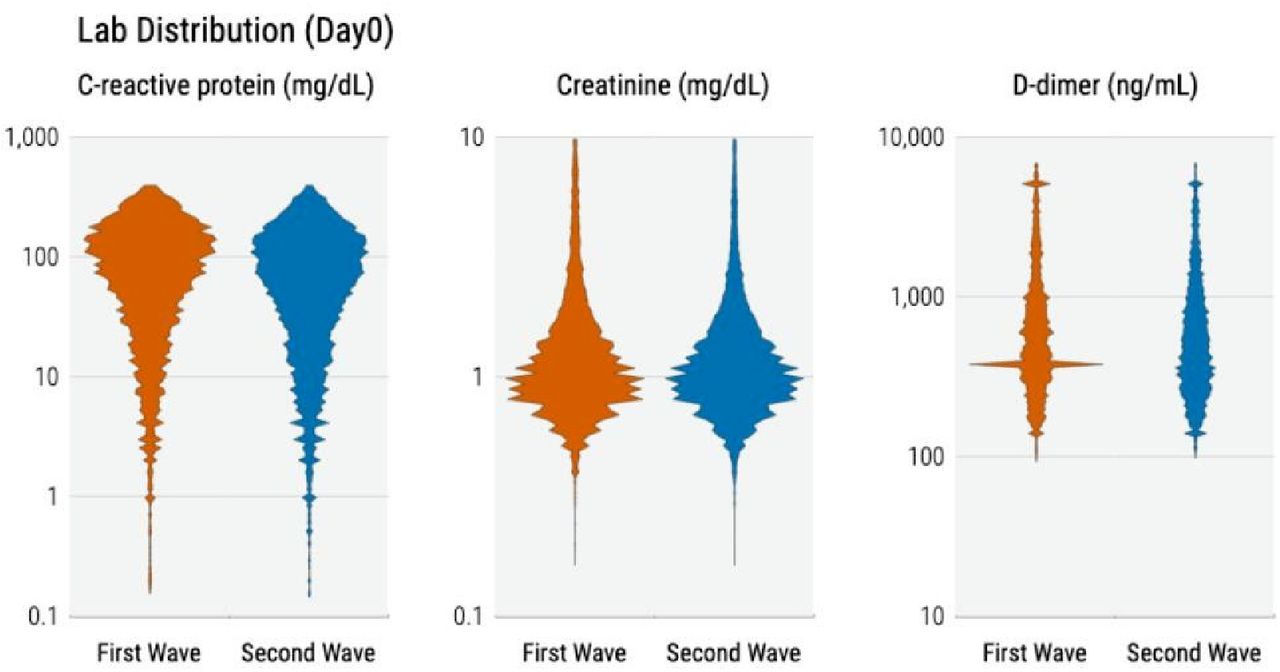
Distribution of laboratory values at admission.
Change in laboratory trajectory during hospitalisation
Patients’ laboratory trajectories during hospitalisation improved faster in the second wave compared with the first (figure 3). CRP values decreased more rapidly (R1= –4.14 vs R2= –4.72 mg/dL per day, p=0.05), while D-dimer values increased substantially faster during the first wave but remained relatively stagnant during the second (R1=21.01 vs R2=1.25 ng/dL per day, p<0.001).

Patient-level laboratory recovery rate. CRP, C reactive protein.
Hospitalisation duration decreased, with 53.4% of patients discharged within 1 week in the second wave compared with 49.2% in the first (p<0.001). Patients hospitalised for longer generally had worse laboratory profiles compared with those with shorter stays. The average day 3 CRP among those hospitalised for ≤1 week and 2+ weeks was 41.68 mg/dL and 63.64 mg/dL (p<0.001) during the first wave and 27.33 mg/dL and 43.52 mg/dL (p<0.001) during the second wave. The between-wave difference in the rate of decline, ΔR=R1−R2, also varied by the duration of hospitalisation. For CRP, ΔR was 1.01 (p<0.001), 2.04 (p<0.001) and 0.95 (p=0.001) mg/dL per day among those hospitalised for ≤1, 1–2 and 2+ weeks, respectively. For creatinine and D-dimer, ΔR had similar patterns but was not statistically significant.
Improvement in laboratory values was more pronounced in the USA than in France and Spain (eFigure 4). For CRP, ΔR = 1.07 mg/dL per day (95% CI 0.86 to 1.28) in the USA, which is significantly higher than that of France (–0.69 mg/dL per day, 95% CI –1.08 to –2.92) and Spain (–0.3 mg/dL per day, 95% CI –0.79 to –0.19). The reduction in hospitalisation duration varied greatly between countries. The proportion of patients discharged within 1 week increased in the second wave compared with the first in the USA (53.4% vs 61.1%, p<0.001), Italy (2.5% vs 14.9%, p<0.001), Germany (32.7% vs 48.6%, p<0.001) and Spain (57.1% vs 62.3%, p<0.001), but decreased in France (46.1% vs 42.4%, p<0.001).
Temporal changes in mortality risk
In our survival analysis, the variables significantly associated with increased risk of mortality were older age, male sex, CCI, lower albumin and lymphocyte count, and higher CRP, total bilirubin, leucocyte count, neutrophil count, D-dimer, ALT, and AST/ALT at baseline (figure 4). The HRs of these risk factors were concordant between countries (eFigure 5).

HRs of the Cox model for mortality risk prediction (excluding Italy). ALT, alanine aminotransferase; AST, aspartate aminotransferase; CRP, C reactive protein.
Over the course of the pandemic, the models’ predictive capabilities did not significantly change with AUC ranging from 0.752 to 0.787; the temporal patterns were similar across countries (eFigure 6).
The proportion of high-risk patients decreased from March-April 2020 to July-August 2020 but gradually increased from September 2020 to January 2021 (figure 5). However, the mortality rates within each risk category decreased over calendar time, with the decrease from March–April 2020 to November 2020 to January 2021 most substantial in the high-risk category (47.1% vs 30.8%, p<0.001), moderate in the intermediate-risk category (25.6% vs 14.8%, p<0.001) and the low-risk category (9.5% vs 4.7%, p<0.001). From March–April 2020 to November 2020 to January 2021, USA had a more consistent decrease over time while France and Spain decreased from March–April 2020 to July–August 2020 but plateaued afterwards (eFigure 7). In the high-risk category, the decrease in mortality risk from March–April 2020 to July–August 2020 was the highest in Spain (42.7% vs 25.0%, p=0.002), followed by the USA (50.0% vs 38.4%, p<0.001) and France (40.1% vs 31.7%, p=0.11). By November 2020 to January 2021, the mortality risk further decreased to 29.5% (95% CI 28.3% to 30.7%) in the USA, but slightly increased to 34.9% (95% CI 31.7% to 38.0%) in France and 28.6% (95% CI 22.9% to 34.3%) in Spain.

Risk model results with event rate information and risk stratification.
Discussion
In this large, international, multihealthcare system retrospective cohort study, we found decreasing mortality rates and faster physiological recovery based on laboratory profiles between the first and second waves of the COVID-19 pandemic. Given the minimal changes in patient demographic and clinical profiles at admission between the two waves, our findings cannot be entirely explained by a less severely ill cohort of patients admitted in the second wave.7 36–38 There were no new major effective pharmacological therapies introduced between the two waves.39–48 However, some existing therapies, such as corticosterids, achieved widespread use as healthcare providers gained experience with managing the disease. Moreover, evolving protocols for hospital care, including adapted ventilatory support and the higher proportion of patients managed without mechanical ventilation, probably contributed to improving streamlined care and resource allocation. Potential explanations for the differences between the two waves include timing for emergency visits and hospital admissions, iterative improvement in management strategies of the severe cases, and increased preparedness of healthcare systems in the latter stages of the pandemic. As diverse healthcare systems and populations in different countries learnt to improve the care of patients with COVID-19 through diverse experiences, knowledge rapidly disseminated. For example, hospitals may have benefited from improved resource allocation strategies and management in smaller surges in hospitalisations.49 Negative trial data for hydroxychloroquine, azithromycin and other pharmacological agents may have led to reduced usage of these drugs and reduced drug-related adverse effects over the course of the pandemic.41 50–53 Further investigations into the potential explanations are warranted as this study was not designed to infer the specific reasons for this improvement.
Overall, we observed greater improvements in positive and negative acute phase reactants and markers of organ function (eg, creatinine, ALT and AST) in the second wave compared with the first, which suggests that systemic inflammation and multiorgan dysfunction all improved faster in the second wave. Interestingly, we observed greater improvements in CRP, ALT, AST and creatinine in the second wave in patients with longer hospitalisations; while this may be reflective of a sicker patient population, this could be due to time-dependent (ie, survivor) bias.54 Alternatively, there may have been increased corticosteroid use in patients with severe COVID-19 in the second wave following preliminary results of the controlled, open-label Randomized Evaluation of COVID-Therapy (RECOVERY) Trial, which may have improved inflammatory markers and mortality.14 55 56 In addition, there may have been increased remdesivir in combination with dexamethasone between the first and second waves that may confound these associations.13 55 Further studies are warranted to investigate the alteration of biochemical trajectories of dexamethasone with remdesivir in contrast to dexamethasone or remdesivir monotherapy.57 It is also unclear why we observed between-country differences in the between-wave CRP trajectories, whereupon Spain and France had blunted improvement rates; this could certainly be due to differential clinical management across countries.
One potential explanation for the blunted D-dimer trajectories in the second wave compared with the first is increased prophylactic anticoagulation use after the release of International Society on Thrombosis and Haemostasis guidelines in May and September 2020, which recommended prophylactic anticoagulation with low molecular weight heparin in all hospitalised patients with COVID-19 who had no anticoagulation contraindications.58 This may have reduced the higher incidence of thrombotic events observed in the first wave, which could be associated with high D-dimer levels. Furthermore, as D-dimer is often correlated with disease severity and systemic inflammation, increased glucocorticoid use in patients with severe disease could blunt increases in D-dimer.50 59–61
Our study suggests that older age, male sex, higher CCI, low albumin and lymphocyte count values, and higher CRP, total bilirubin, leucocyte count, neutrophil count, D-dimer, ALT, and AST/ALT were significantly associated with higher mortality risk. While male sex, older age and existing comorbidities are established major risk factors for COVID-19-related mortality, our observations of the associations between higher AST/ALT, ALT and bilirubin with mortality51 52 62 63 are unique. While derangements in liver function tests are well described in prior studies of patients with COVID-19, the patterns of liver dysfunction associated with worse outcomes have been inconsistent.53 64 Furthermore, these prior observations tended to be derived from single-centre studies which likely introduce significant sources of bias. In particular, our observation of a combination of elevated markers of cholestatic liver function (bilirubin, AST/ALT ratio), inflammatory markers and cell counts suggests that cholestatic liver dysfunction may be involved in the disease course, as is observed in patients who are critically ill.65–67 Furthermore, emerging, though limited, COVID-19 postmortem studies have suggested that SARS-CoV-2 may directly infect hepatocytes and lead to altered bile duct morphology, reinforcing the possible role of viral-induced cholestatic hepatitis in severe COVID-19.67 Alternatively, medication-related liver injury could certainly contribute to liver dysfunction. Future investigations using patient-level data validated by thorough chart review is warranted to better define these associations.
Although cross-country and cross-healthcare system heterogeneities exist in demographics and laboratory distributions, we observed concordant improvement patterns in both laboratory recovery during hospitalisation and mortality risk over time across different countries. However, the admission profile-adjusted temporal change in mortality risk over calendar months differed slightly between USA and Europe (Spain and France). In addition to an increase in hospitalisation duration in the latter half of the pandemic in France, in Spain and France the mortality risk plateaued overall and actually increased in the high-risk group. Further investigation into these between-country differences in mortality using chart review and other validation steps is warranted.
Limitations
This study has several limitations. First, similar to other EHR-based studies, the current study might have included patients with incidental hospitalisation (ie, a positive test for SARS-CoV-2 when admitted for an unrelated medical condition).68 Further, information regarding each patient’s in-hospital care settings, such as admission to intensive care units and their specific respiratory status was not available. Second, most 4CE participating healthcare systems were unable to capture all out-of-hospital mortality. However, most COVID-19-related mortality occurs in the hospital, and most discharged patients would have postdischarge follow-up visits, which would reasonably capture 28-day mortality. A further limitation was the lack of data on patient-specific timing of symptom onset relative to hospital course. Additionally, our study may have potential time-dependent bias given that 4CE defines a first hospital admission that occurs between 7 days before and up to 14 days after the first positive SARS-CoV-2 PCR test. This may also affect the results stratified by duration of hospitalisation. Future analyses accounting for medication administration and procedure use and the subsequent effect on inflammatory markers and creatinine are necessary to infer why these outcomes improved in the second wave.
Conclusion
Patients’ admission profiles did not differ substantially between waves of the COVID-19 pandemic, but there were notable differences in laboratory recovery rates and mortality in the second wave compared with the first.
The lead author affirms that the manuscript is an honest, accurate and transparent account of the study being reported; that no important aspects of the study have been omitted; and that any discrepancies from the study as originally planned have been explained.
Data availability statement
Only deidentifed aggregate data are available in a public, open access repository. Only deidentified aggregate data were provided by sites for this study. All aggregate data used in this study are available for download at www.covidclinical.net.
Ethics statements
Patient consent for publication
Ethics approval
All study sites were responsible for and obtained ethics approval, as needed, from the appropriate ethics committee at their institution. IRB protocols were reviewed and approved at APHP (IRB00011591, Project CSE-20–29_ClinicalCOVID), Bordeaux University Hospital (Registration #CHUBX2020RE0253), ICSM (Protocol #2518 CE), Mass General Brigham (IRB#2020P001483), Northwestern University (IRB# STU00212845), University of Kansas (STUDY00146505), University of Freiburg (Application #255/20, Process #210587), and at VA North Atlantic, Southwest, Midwest, Continental, and Pacific (IRB # 3310-x x).The research was determined to be exempt at Hospital Universitario 12 de Octubre (Protocol #20/403), University of Michigan (IRB# HUM00184357), Beth Israel Deaconess Medical Center (IRB# 2020P000565), University of Pittsburgh (STUDY20070095), and University of Pennsylvania (IRB#842813). University of California Los Angeles determined that this study does not need IRB approval because research using limited data sets does not constitute human subjects research.
References
Supplementary materials
Supplementary Data
This web only file has been produced by the BMJ Publishing Group from an electronic file supplied by the author(s) and has not been edited for content.
Footnotes
CH, HGZ and SL are joint first authors.
AS, GAB and TC are joint senior authors.
Twitter @Lav_P_Patel, @asouth_neph
Collaborators The Consortium for Clinical Characterization of COVID-19 by EHR (4CE): James R Aaron, Giuseppe Agapito, Adem Albayrak, Mario Alessiani, Anna Alloni, Danilo F Amendola, Li LLJ Anthony, Bruce J Aronow, Fatima Ashraf, Andrew Atz, Paul Avillach, Paula S Azevedo, James Balshi, Brett K Beaulieu-Jones, Douglas S Bell, Antonio Bellasi, Riccardo Bellazzi, Vincent Benoit, Michele Beraghi, José Luis Bernal-Sobrino, Mélodie Bernaux, Romain Bey, Alvar Blanco-Martínez, Martin Boeker, Clara-Lea Bonzel, John Booth, Silvano Bosari, Florence T Bourgeois, Robert L Bradford, Gabriel A Brat, Stéphane Bréant, Carlos Tadeu Breda Neto, Nicholas W Brown, William A Bryant, Mauro Bucalo, Anita Burgun, Tianxi Cai, Mario Cannataro, Aldo Carmona, Charlotte Caucheteux, Julien Champ, Jin Chen, Krista Chen, Luca Chiovato, Lorenzo Chiudinelli, Kelly Cho, James J Cimino, Tiago K Colicchio, Sylvie Cormont, Sébastien Cossin, Jean B Craig, Juan Luis Cruz-Bermúdez, Jaime Cruz-Rojo, Arianna Dagliati, Mohamad Daniar, Christel Daniel, Priyam Das, Anahita Davoudi, Batsal Devkota, Julien Dubiel, Loic Esteve, Hossein Estiri, Shirley Fan, Robert W Follett, Thomas Ganslandt, Noelia García-Barrio, Lana X Garmire, Nils Gehlenborg, Emily Getzen, Alon Geva, Tobias Gradinger, Alexandre Gramfort, Romain Griffier, Nicolas Griffon, Olivier Grisel, Alba Gutiérrez-Sacristán, David A Hanauer, Christian Haverkamp, Bing He, Darren W Henderson, Martin Hilka, Yuk-Lam Ho, John H Holmes, Chuan Hong, Kenneth M Huling, Meghan R Hutch, Richard W Issitt, Anne Sophie Jannot, Vianney Jouhet, Mark S Keller, Chris J Kennedy, Daniel A Key, Katie Kirchoff, Jeffrey G Klann, Isaac S Kohane, Ian D Krantz, Detlef Kraska, Ashok K Krishnamurthy, Sehi L’Yi, Trang T Le, Judith Leblanc, Andressa RR Leite, Guillaume Lemaitre, Leslie Lenert, Damien Leprovost, Molei Liu, Ne Hooi Will Loh, Qi Long, Sara Lozano-Zahonero, Yuan Luo, Kristine E Lynch, Sadiqa Mahmood, Sarah Maidlow, Adeline Makoudjou, Alberto Malovini, Kenneth D Mandl, Chengsheng Mao, Anupama Maram, Patricia Martel, Marcelo R Martins, Aaron J Masino, Maria Mazzitelli, Arthur Mensch, Marianna Milano, Marcos F Minicucci, Bertrand Moal, Taha Mohseni Ahooyi, Jason H Moore, Cinta Moraleda, Jeffrey S Morris, Michele Morris, Karyn L Moshal, Sajad Mousavi, Danielle L Mowery, Douglas A Murad, Shawn N Murphy, Thomas P Naughton, Antoine Neuraz, Kee Yuan Ngiam, Wanjiku FM Njoroge, James B Norman, Jihad Obeid, Marina P Okoshi, Karen L Olson, Gilbert S Omenn, Nina Orlova, Brian D Ostasiewski, Nathan P Palmer, Nicolas Paris, Lav P Patel, Miguel Pedrera-Jimenez, Emily R Pfaff, Danielle Pillion, Hans U Prokosch, Robson A Prudente, Andrea Prunotto, Víctor Quirós-González, Rachel B Ramoni, Maryna Raskin, Siegbert Rieg, Gustavo Roig-Domínguez, Pablo Rojo, Carlos Sáez, Elisa Salamanca, Malarkodi J Samayamuthu, L. Nelson Sanchez-Pinto, Arnaud Sandrin, Nandhini Santhanam, Janaina CC Santos, Fernando J Sanz Vidorreta, Maria Savino, Emily R Schriver, Petra Schubert, Juergen Schuettler, Luigia Scudeller, Neil J Sebire, Pablo Serrano-Balazote, Patricia Serre, Arnaud Serret-Larmande, Mohsin Shah, Zahra Shakeri, Domenick Silvio, Piotr Sliz, Jiyeon Son, Charles Sonday, Andrew M South, Anastasia Spiridou, Amelia LM Tan, Bryce WQ Tan, Byorn WL Tan, Suzana E Tanni, Deanne M Taylor, Ana I Terriza-Torres, Valentina Tibollo, Patric Tippmann, Carlo Torti, Enrico M Trecarichi, Yi-Ju Tseng, Andrew K Vallejos, Gael Varoquaux, Margaret E Vella, Guillaume Verdy, Jill-Jênn Vie, Shyam Visweswaran, Michele Vitacca, Kavishwar B Wagholikar, Lemuel R Waitman, Xuan Wang, Demian Wassermann, Griffin M Weber, Zongqi Xia, Xin Xiong, Nadir Yehya, William Yuan, Alberto Zambelli, Harrison G Zhang, Daniel Zoeller, Chiara Zucco.
Contributors GMW, PA, AGS, NPP, RB, SNM, IK, GAB and TC contributed to design and conceptualisation of the study. GMW, NPP, AM, VT, YL, MRH, RB, LC, FJSV, VB, BM, MM, DAH, SM, KBW, SNM, HE, AM, PT, JGK, RWF, GSO, ZX, SV, LPP, DLM, ERS, MJS, SLZ, DZ, ALMT, BWLT, KYN, PS, KC, YLH, MPJ, NGB and PSB contributed to data collection. CH, HZ, SL, GMW, PA, BWQT, AGS, CLB, YL, ML, FTB, TTL, XW, WY, AN, VB, BM, MM, DAH, MA, PT, JGK, NG, AD, LPP, RK, DZ, JHH, BKBJ, IK, AMS, GAB and TC contributed to data analysis and interpretation. All authors contributed to drafting and revision of the manuscript and approved the final manuscript. All authors are accountable for all aspects of the work in ensuring that questions related to the accuracy or integrity of any part of the work are appropriately investigated and resolved. TC is the guarantor of the study.
Funding GMW is supported by NIH/NCATS UL1TR002541, NIH/NCATS UL1TR000005, NIH/NLM R01LM013345, and NIH/NHGRI 3U01HG008685-05S2. BWQT is supported by the National Medical Research Council Research Training Fellowship (MOH-000195-00). FJSV is supported by NIH/NCATS UL1TR001881. DAH is supported by NIH/NCATS UL1TR002240. KBW is supported by NIH/NHLBI R01 HL151643-01. SNM is supported by NIH/NCATS 5UL1TR001857-05 and NIH/NHGRI 5R01HG009174-04. NG is supported by NIH/NLM T15 LM007092. GSO is supported by NIH P30ES017885 and U24CA210967. ZX is supported by NIH/NINDS R01NS098023. SV is supported by NIH/NLM R01LM012095 and NIH/NCATS UL1TR001857. LPP is supported by NIH/NCATS CTSA Award #UL1TR002366. DLM is supported by NIH/NCATS CTSA Award #UL1-TR001878. RK is supported by NIH/NCATS CTSA award#UL1TR001998. NG-B is supported by the Carlos III Health Institute PI18/00981. AMS is supported by NIH/NHLBI K23HL148394 and L40HL148910 and NIH/NCATS UL1TR001420.
Competing interests None declared.
Patient and public involvement Patients and/or the public were not involved in the design, or conduct, or reporting, or dissemination plans of this research.
Provenance and peer review Not commissioned; externally peer reviewed.
Supplemental material This content has been supplied by the author(s). It has not been vetted by BMJ Publishing Group Limited (BMJ) and may not have been peer-reviewed. Any opinions or recommendations discussed are solely those of the author(s) and are not endorsed by BMJ. BMJ disclaims all liability and responsibility arising from any reliance placed on the content. Where the content includes any translated material, BMJ does not warrant the accuracy and reliability of the translations (including but not limited to local regulations, clinical guidelines, terminology, drug names and drug dosages), and is not responsible for any error and/or omissions arising from translation and adaptation or otherwise.