Article Text

Abstract
Objectives The first German SARS-CoV-2 outbreak was a superspreading event in Gangelt, North Rhine-Westphalia, during indoor carnival festivities called ‘Kappensitzung’ (15 February 2020). We determined SARS-CoV-2 RT-PCR positivity rate, SARS-CoV-2-specific antibodies, and analysed the conditions and dynamics of superspreading, including ventilation, setting dimensions, distance from infected persons and behavioural patterns.
Design In a cross-sectional epidemiological study (51 days postevent), participants were asked to give blood, pharyngeal swabs and complete self-administered questionnaires.
Setting The SARS-CoV-2 superspreading event took place during festivities in the small community of Gangelt in February 2020. This 5-hour event included 450 people (6–79 years of age) in a building of 27 m × 13.20 m × 4.20 m.
Participants Out of 450 event participants, 411 volunteered to participate in this study.
Primary and secondary outcome measures Primary outcome: infection status (determined by IgG ELISA). Secondary outcome: symptoms (determined by questionnaire).
Results Overall, 46% (n=186/404) of participants had been infected, and their spatial distribution was associated with proximity to the ventilation system (OR 1.39, 95% CI 0.86 to 2.25). Risk of infection was highly associated with age: children (OR 0.33, 95% CI 0.267 to 0.414) and young adults (age 18–25 years) had a lower risk of infection than older participants (average risk increase of 28% per 10 years). Behavioural differences were also risk associated including time spent outside (OR 0.55, (95% CI 0.33 to 0.91) or smoking (OR 0.32, 95% CI 0.124 to 0.81).
Conclusions Our findings underline the importance of proper indoor ventilation for future events. Lower susceptibility of children/young adults indicates their limited involvement in superspreading.
- COVID-19
- VIROLOGY
- Infection control
Data availability statement
Data are available on reasonable request. All data are available upon reasonable request.
This is an open access article distributed in accordance with the Creative Commons Attribution Non Commercial (CC BY-NC 4.0) license, which permits others to distribute, remix, adapt, build upon this work non-commercially, and license their derivative works on different terms, provided the original work is properly cited, appropriate credit is given, any changes made indicated, and the use is non-commercial. See: http://creativecommons.org/licenses/by-nc/4.0/.
Statistics from Altmetric.com
Strengths and limitations of this study
The setting and the participant group are extremely well defined.
Participants were invited on the basis of one criterion, namely their presence at the superspreading event; there was no other preselection/bias in the study enrolment, and the participation rate was high (91% of those invited).
The study was conducted 51 days after the event, so it is possible that participants could have become infected unrelated to the event.
The number of index cases is unknown.
Introduction
SARS-CoV-2 is a highly transmissible and pathogenic RNA virus that emerged in late 2019 and has caused a pandemic threatening human health and public safety worldwide.1 While factors shaping the dynamics of a pandemic are multifactorial, virulence and reproductive number are important properties of a virus.2 For SARS-CoV-2, there is a substantial overdispersion of the secondary infection distribution (individual R0) for an individual infected with SARS-CoV-2.2 An overdispersed R0 means that most infected people do not transmit (individual R0=0), while a minority of infected people are superspreaders (individual R0 >5). Superspreading has been observed for many infectious pathogens, such as measles or SARS.3 During the SARS pandemic in 2003, a superspreading event was defined as one infected person infecting eight others.4 For SARS-CoV-2, it has been estimated that 80% of the infections are caused by 10% of infected individuals highlighting the importance of the cluster factor (k).2 In Germany, an indoor carnival event in the beginning of 2020 is considered as the first major outbreak in a German city and was considered a hotspot during the beginning of the pandemic in Germany.5 Other SARS-CoV-2 superspreading events worldwide have been linked to indoor gatherings with close proximity of individuals.6 Nevertheless, most of the reported superspreading events had less than 100 cases, and the reports are limited by missing data or a reporting bias.6
Here, we closely examined the prerequisite of a unique superspreading event in Germany during the SARS-CoV-2 pandemic, where nearly half of the participants became infected including children. We systematically analysed infection rate, potential individual and environmental risk factors for infection as well as the role of the ventilation system.
Materials and methods
Study design and sampling
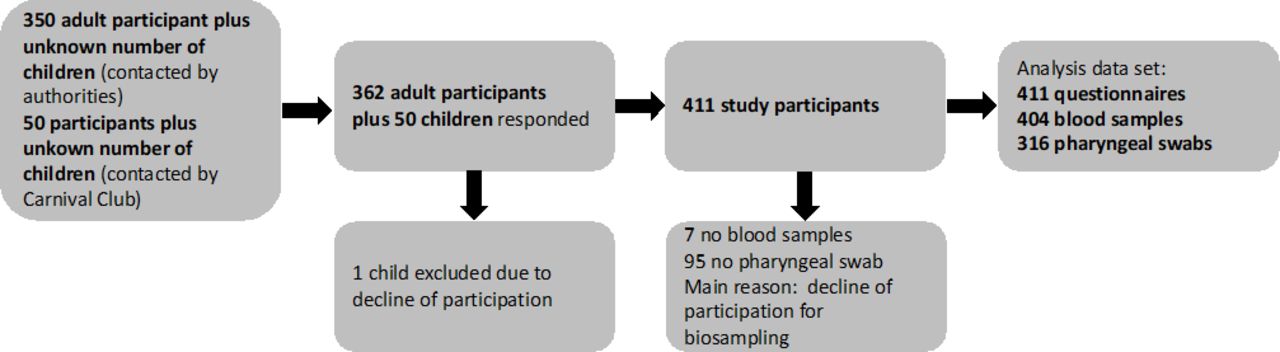
This cross-sectional epidemiological study was conducted 51 days after a carnival celebration in the beginning of 2020. Eleven days after, the event authorities sent all known participants into quarantine after testing 38 out of 99 individuals PCR positive. All adults known to have attended the event were invited to participate in the study. About 450 persons attended the event of which 411 participated in the study (figure 1, participation rate 91.3%). All study participants provided written informed consent before enrolment.

Study participants. Enrolment and flow of participants through the study. Downstream sample processing included centrifugation of blood samples for plasma collection (SARS-CoV-2 ELISAs) and viral RNA extraction from swab samples (SARS-CoV-2 RT-PCR).
Self-administered questionnaires included questions about demographic background, symptoms of viral infection as well as detailed information about the behaviour during the event. Participants’ arrival and exit times were assessed in 1-hour categories. Study participants were asked to provide blood specimens and pharyngeal swabs for further analysis. The local health department supplied data on hospitalisations and fatalities in our cohort (manuscript submitted elsewhere).
Patient and public involvement
This study was designed in close collaboration with both the local health department of Heinsberg and the ‘Council of 11’ of Gangelt, the organisers of the event described herein. The organisers as well as the city’s head councilman were also involved in recruitment by appealing to the local population to participate in the study. Since the community of Gangelt was the centre of the first German outbreak of SARS-CoV-2, there was a great interest from the local public to participate in this study to help understand this new virus and to gain access to early testing. Accordingly, the Ministry of Labor, Health, and Social Affairs of the state government funded this study. In turn, as a service to the public, we informed each participant of their PCR and ELISA result via letter and offered a phone hotline for questions about the results.
Spatial information and description of the event
The event took place on 15 February 2020 and consisted of speeches, dance and music performances for a total of 5 hours, with one large intermission. It was a ticketed event, where ticket sale was open to the public. Most of the participants were inhabitants of Gangelt. It was hosted at a small community centre (320 square metres) in a single open space with a bar in the front close to the entrance and a stage at the back. The tables, each with two benches, were arranged in two blocks with a centre aisle towards the stage. Alcoholic and non-alcoholic drinks were served in glasses, and a food truck was located outside in front of the venue. While most participants (about 450 people, 1.4 individuals per square metre) were sitting in the hall, a committee of eleven individuals hosting the event were sitting on stage. The eleven people on stage switched after a break.
Metric room coordinates (length and width (m)) for areas, tables, benches and ventilation shafts were assessed via measurements, seating plan and photos from the event. Persons providing multiple positions were considered as spending an equal amount of time on different positions. When exact seating was unclear and information was available on table or greater area localisation (bar abd stage), average coordinate values were used. On the grounds of these coordinates, we calculated pairwise metric distances between all persons and distances to closest inlet and outlet airshafts. For all persons, their pairwise inverse distances were summarised as mean inverse distance. Inverse metric distances to persons or airshafts were regarded as representing infectious potential through local proximity, and inverse distances were capped at 2.5 (the inverse of the width of a seat of 0.4 m). Alternatively, we counted all infected persons within adjacent rings of 1.5 m width around each participant as a measure of crowdedness and infectious potential.
Pharyngeal swab and blood preparation
Pharyngeal swabs of participants were performed with FLOQSwabs (Copan) and immediately stored in UTM RT-mini tubes containing UTM Viral Stabilization Media (Copan) at 4°C. Venous blood was drawn into EDTA tubes (Sarstedt) per participant and was transported to the laboratory at the University Hospital Bonn.
Anti-SARS-CoV-2 ELISA
Anti-SARS-CoV-2 IgA and IgGs were determined using ELISA on the EUROIMMUN Analyzer I platform (EI 2606–9601 A, and EI2606-9601 G, respectively).5 A result was considered positive when a ratio (extinction of sample/extinction of calibrator) of 0.8 or higher was reached. The guidelines of the German Medical Association (RiliBÄK) were abided by, including internal and external quality controls.
Reverse transcription PCR (RT-PCR)
Viral RNA was extracted from each 300 µL swab sample via the chemagic Viral 300 assay (according to manufacturer’s instructions) on the Perkin Elmer chemagic Prime instrument platform. The presence of two viral target genes (E and RdRP) was assessed in each sample by real time RT-PCR (SuperScriptIII One-Step RT-PCR System with Platinum TaqDNA Polymerase, Thermo Fisher). The following primers were used: for E gene: E_Sarbeco_F1 and R, and probe E_Sarbeco_P1; for RdRP gene: RdRP_SARSr_F and R and probe RdRP_SARSr-P2.7 In addition, an internal control for RNA extraction, reverse transcription and amplification was applied to each sample (innuDETECT Internal Control RNA Assay, Analytik Jena #845-ID-0007100). If amplification occurred in both virus-specific reactions, samples were considered positive.
SARS-CoV-2 neutralisation assay
A plaque reduction neutralisation test was used to determine SARS-CoV-2 neutralisation capacity as previously described.5 Briefly, plasma samples were heat inactivated, and supernatant was transferred to a new tube and serially twofold diluted in OptiPRO SFM (Gibco). One hundred twenty microlitres of each plasma dilution was mixed with 80 plaque-forming units of SARS-CoV-2 in 120 µL OptiPRO SFM cell culture medium and used to infect Vero E6 cells (1.25×10⁵ cells/well seeded into 24-well plates 24 hours before). Subsequently, the inoculum was removed, and cells were overlayed with a mixture of carboxymethylcellulose (Sigma) and 2× MEM (Biochrom). Following 3-day incubation, the overlay was removed, and the 24-well plates were fixed using a 6% (v/v) formaldehyde solution and stained with 1% (w/v) crystal violet in 20% ethanol revealing the formation of plaques. Finally, the neutralising titres were calculated as the reciprocal of serum dilutions resulting in neutralisation of 50% input virus (NT50), read out as reduction in the number of plaques.
Data management and quality control
The Clinical Study Core Unit of the Study Center Bonn (SZB) supported the study by outlining the study protocol and developing the informed consent form as well as participants information sheets with respect to data management and quality control. The data were gathered on paper-based case report forms. Data were entered as double data entry into the REDCAp study database programmed and hosted by SZB. Study personnel was trained by experienced members of the SZB. A quality manager was on site to support the study team. Monitoring of trial data and informed consent forms was performed according to the monitoring plan by qualified SZB staff.
Statistical analysis
Associations between positive infection status (defined as an IgG ratio ≥0.8), and exposure variables were analysed via logistic regression models. Exposure variables were included crudely and adjusted for the potential confounding factors age, sex and duration of attendance as fixed effects. To correct for common household effects a random effects model was used. We present ORs with 95% CIs. Because we present data on a single specific event among a limited number of participants, we completely refrain from presenting p values. All analyses were done with SAS V.9.4.
Results
Four hundred and eleven out of an estimated 450 participants of the event responded to our study invitation, resulting in a response rate of 91.3%. 404 individuals provided plasma samples and 316 pharyngeal swabs (figure 1). Genders were represented equally among all 404 participants (n=201/404, 50% were male) with a broad range in age (6–79 years, median age 36 years) and level of education (table 1). Two hundred and ninety-seven individuals were residents of the community the event took place in, 103 lived in other parts of the county and 11 were external visitors. In total, five participants of the event were hospitalised, and one participant subsequently died.
Distribution of demographic factors and exposure information of interest among study participants who tested positive or negative in serology test of SARS-CoV-2 infection
Overall, 186 out of 404 individuals tested seropositive for IgG and 161 for IgA antibodies (online supplemental figure 1). To confirm seropositivity, we performed a plaque reduction neutralisation assay (online supplemental figure 2) demonstrating neutralising activity against SARS-CoV-2 of their respective antibody responses. Given the low specificity of the IgA assay, IgA seropositivity was not further considered.5 Nineteen participants tested positive in RT-PCR; these were considered infected during the superspreading event only if they were also IgG positive (this was the case with 16 out of the 19 participants).
Supplemental material
Overall, we found that (n=186/404) 46.0% (95% CI 41.2% to 51.0%) tested seropositive who attended the event, which was significantly higher than the overall estimated infection rate in the same community at large at that time. Indeed, officially 3.1% of the community were reported as positive cases at that time, but we estimated the infection rate to be 15.5% (95% CI 12.3% to 19.0%)5 for the community. Taken together, an estimated 46% of participants became infected during a single superspreading event.
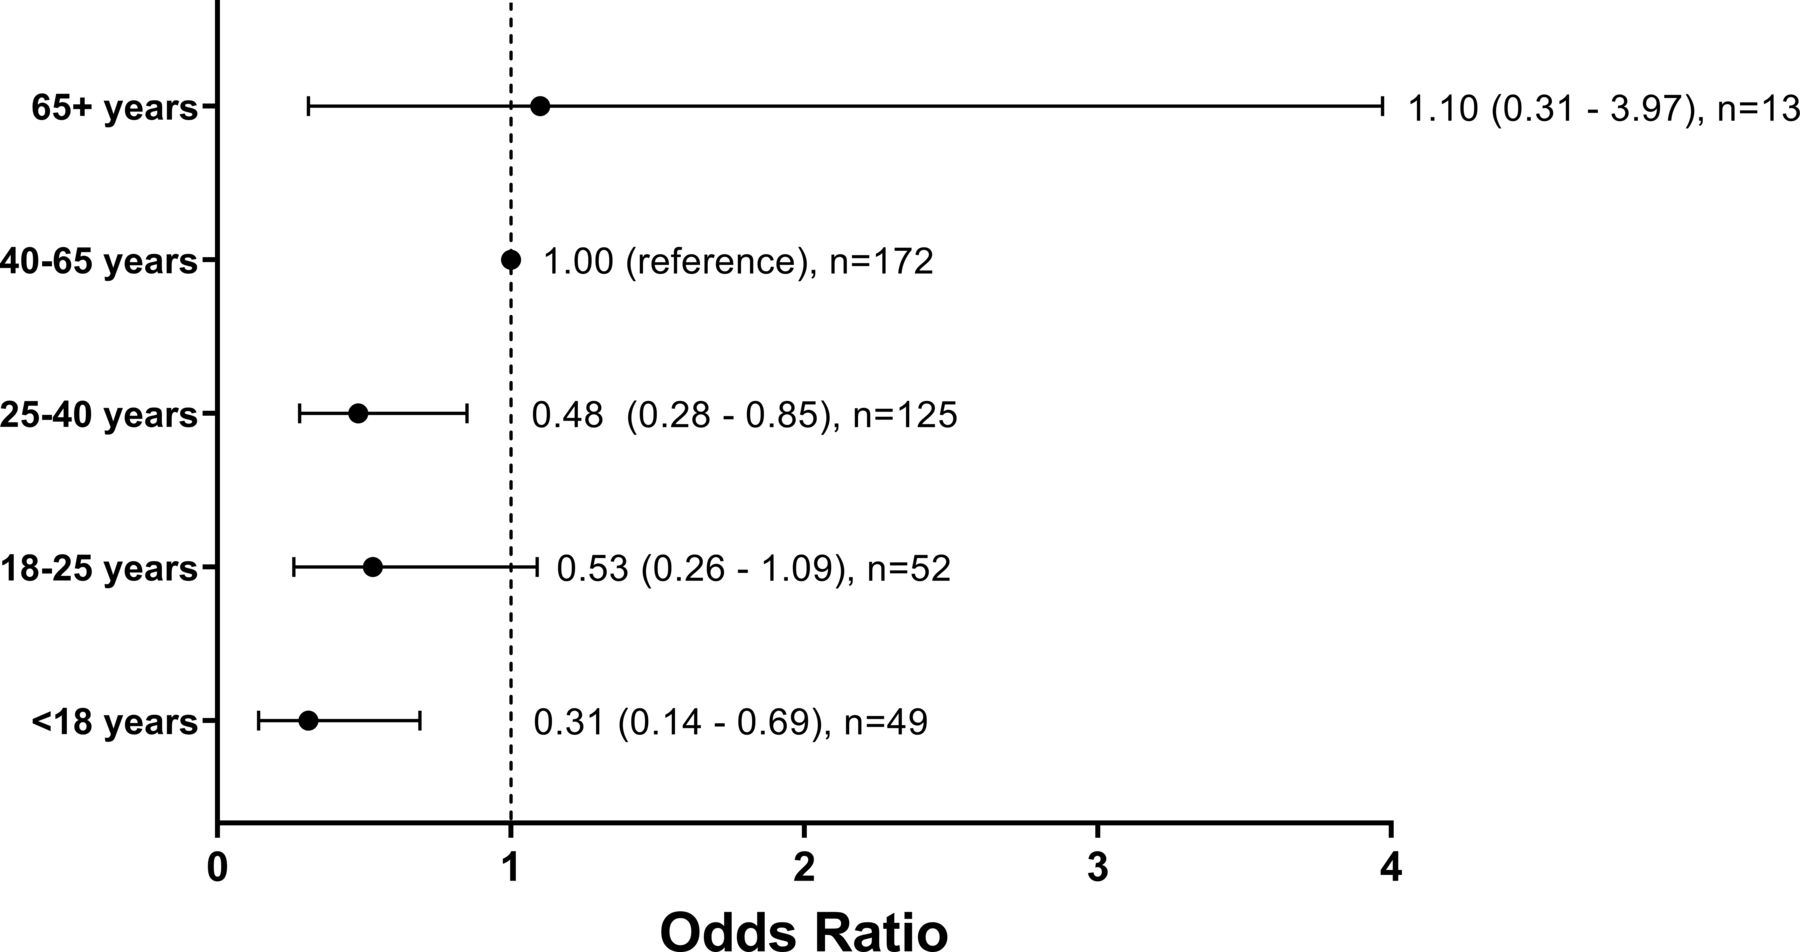
No association between the gender of participants and risk of infection was found ((OR 1.01, 95% CI 0.65 to 1.58) for women). On average infected individuals had a higher body mass index (26·2 kg/m² compared with 24.3 kg/m² for uninfected individuals). Infected participants were more likely to be clustered living in the same household (table 1). Having at least one comorbidity, including lung disease (n=11/26, 42.3%), cardiovascular disease (n=8/15, 53.3%), neurological disease (n=1/6, 16.7%), cancer (n=7/12) (58.3%) or diabetes (n=4/5, 80%), did not increase the risk of infection (OR 0.64, 95% CI 0.33 to 1.26). We next assessed whether age influenced the risk of infection at the event, considering gender, duration of attendance and common household as covariates. Comparison across age categories showed a lower risk for children (OR 0.31, 95% CI 0.14 to 0.69), and also for young adults (18–25 years, OR 0.53, 95% CI 0.26 to 1.09) as well as adults between 25 and 40 years (OR 0.48, 95% CI 0.28 to 0.85) in comparison to older adults (40–65 years) (OR 1, reference), while seniors had a slightly higher risk (older than 65 years, OR 1.1, 95% CI 0.31 to 3.97) (figure 2). Our data suggest that an additional 10 years of age were on average associated with 28% increased risk of infection (OR 1.28, 95% CI 1.10 to 1.48).

ORs for the likelihood of SARS-CoV-2 infection by age groups. Participants were divided into age groups of 8, 15 or 25 years, participants younger than 18 years or older than 65 years. Participants were considered to have been infected during the event if they were SARS-CoV-2 antibody positive (ELISA).
To understand the spreading dynamics of SARS-CoV-2 during the event, we first performed a detailed analysis of potential risk factors and social behaviour. We first analysed whether the ventilation system influenced the distribution of SARS-CoV-2 infected individuals. It is important to state that the system’s air flow consisted of 75% used and 25% fresh air. The air flow can be described as clockwise. The air system uses vents along one side of the venue and on stage to take in air (figure 3, air inlets purple). After 25% of fresh air has been added and the air has been filtered, vents along the other side of the venue return the air into the room (figure 3, air outlets blue). All ventilation points received the same amount of air due to throttle valves. For noise protection reasons windows remained closed. The air system used F7-Filters (ISO ePM ≥2.5) and had an air volume flow of 7500 m3/hour.

Reconstructed three-dimensional (3D) model of the venue Hall. The venue was a single open space with a stage on one end and a bar as well as the exit on the opposite end. distribution of tables and seating was as indicated by table and chairs symbols. Please note that the people pictured are illustrative and do not represent individual participants. Self-administered questionnaires included questions about main seating position of the participants during the evening event as specifying table and seat with the help of a schematic seating plan. Metric room coordinates for all tables, seats and ventilation points were assessed, and the seating was reconstructed from pictures taken during the event. Therefore, the location of the stage, the bar, the exit as well as the tables and the air inlets/outlets were reconstructed in a 3D model. The original external dimensions of the building were 27m × 13.20m × 4.20 m. Tables, where more than seven infected individuals have stayed, are coloured in dark red; this includes the stage and bar as well. Air inlets are coloured in violet, and the air outlets are coloured in blue. Infected participants had been seated mostly at tables close to the bar, the bar itself and on stage. One table with 8 out of 11 infected people was located far away from the bar at the other side of the hall and close to an air inlet. The group sitting on stage showed as well high numbers of infection (18 infected out of 24).
Most tables located close to the air inlets and showed no or only few infections (figure 3, green) also most surrounding tables showed low numbers of infection (figure 3, yellow). Tables close to the air outlets show high (four or five infected per table) and very high (six or seven infected per table) numbers of infected individuals. Infected participants had been seated mostly at tables close to the bar, at the bar or on stage. One table with 8 out of 11 infected people was located far away from the bar at the other side of the hall and close to an air inlet. The group sitting on stage showed high numbers of infection (18 infected out of 24, table 1). Of note is that the overall number of participants per table was not equal for all tables. Greater proximity to air outlets was associated with increased risk of infection with a crude OR=1.39, 95% CI 0.86 to 2.25. This association remained stable and was hardly attenuated from adjustment for proximity to air inlet, age, gender, duration of attendance, proximity to other infected persons, stage activity and going outside during the intermission (figure 4, multiple adjusted OR=1.26, 95% CI 0.63 to 2.50). A similar apparent effect for proximity to air inlets (crude OR=1.17, 95% CI 0.72 to 1.89)) disappeared when duration of attendance was added to the model (figure 4, multiple adjusted OR=1.01, 95% CI 0.53 to 1.94). Overall, however, we found the increased risk for individuals located closer to the air outlet remarkably persistent (figure 4).

ORs for the association of SARS-CoV-2 infection with specific activities of the participants and their location in the venue relative to ventilation shafts. The model was additionally adjusted for age, sex, duration of attendance, participation in multiple activities and cumulative proximity to other infected persons and common household.
We further studied the sum of the inverse distance to all infected participants as a measure of proximity to either one common virus source or mutual infection. However, there was no evidence for increased risk of infection from greater proximity to other infected persons (online supplemental table 1). Furthermore, we found no evidence for a single person being the source of the infection from the quantile plot of p values from 401 analyses conducted separately for each participant as potential source of infection (online supplemental figure 3).
To understand the association of risk with behaviour patterns, we next investigated the influence of several factors on SARS-CoV-2 infection including time spent outside, smoking, performing on stage and participation during the final act (‘Finale’) for 30 min. Results were all adjusted for age, sex, common household and duration of attendance. Participation in multiple performances was associated with slightly increased risk of infection (OR per performance: 1.08, 95% CI 0.91 to 1.27), results for participation in the last ‘Finale’ were stronger (OR 1.41, 95% CI 0.65 to 3.02), although neither was significant (figure 4). Duration of attendance was persistently and strongly associated with an increased infection risk of 32% with each additional hour spent at the party (OR per hour: 1.32, 95% CI 1.16 to 1.49). All other analyses were adjusted for this variable as potential confounding factor.
We next determined the level of alcohol consumption as number of drinks (high-proof liquor or beer) and did not observe any influence for the amount of alcohol consumption on the risk of becoming infected (OR per drink: 1.00, 95% CI 0.96 to 1.05). Furthermore, participants who spent the break outside were less likely to be infected (OR 0.55, 95% CI 0.33 to 0.91) compared with individuals who spent the break inside the venue hall (figure 4). Interestingly, however, when we determined the impact of being regular smoker (defined as smoking of at least 10 cigarettes a day) on the risk of SARS-CoV-2 infection, we observed a reduced risk of infection (OR 0.32, 95% CI 0.12 to 0.81) even after adjustment for ‘time spent outside’. Taken together, our results demonstrated that the duration of attendance at the carnival party correlated with an increased risk of infection, but the number of alcoholic drinks was not associated with infection risk, while regular smoking and spending the break of the event outside showed a negative correlation with the risk of infection.
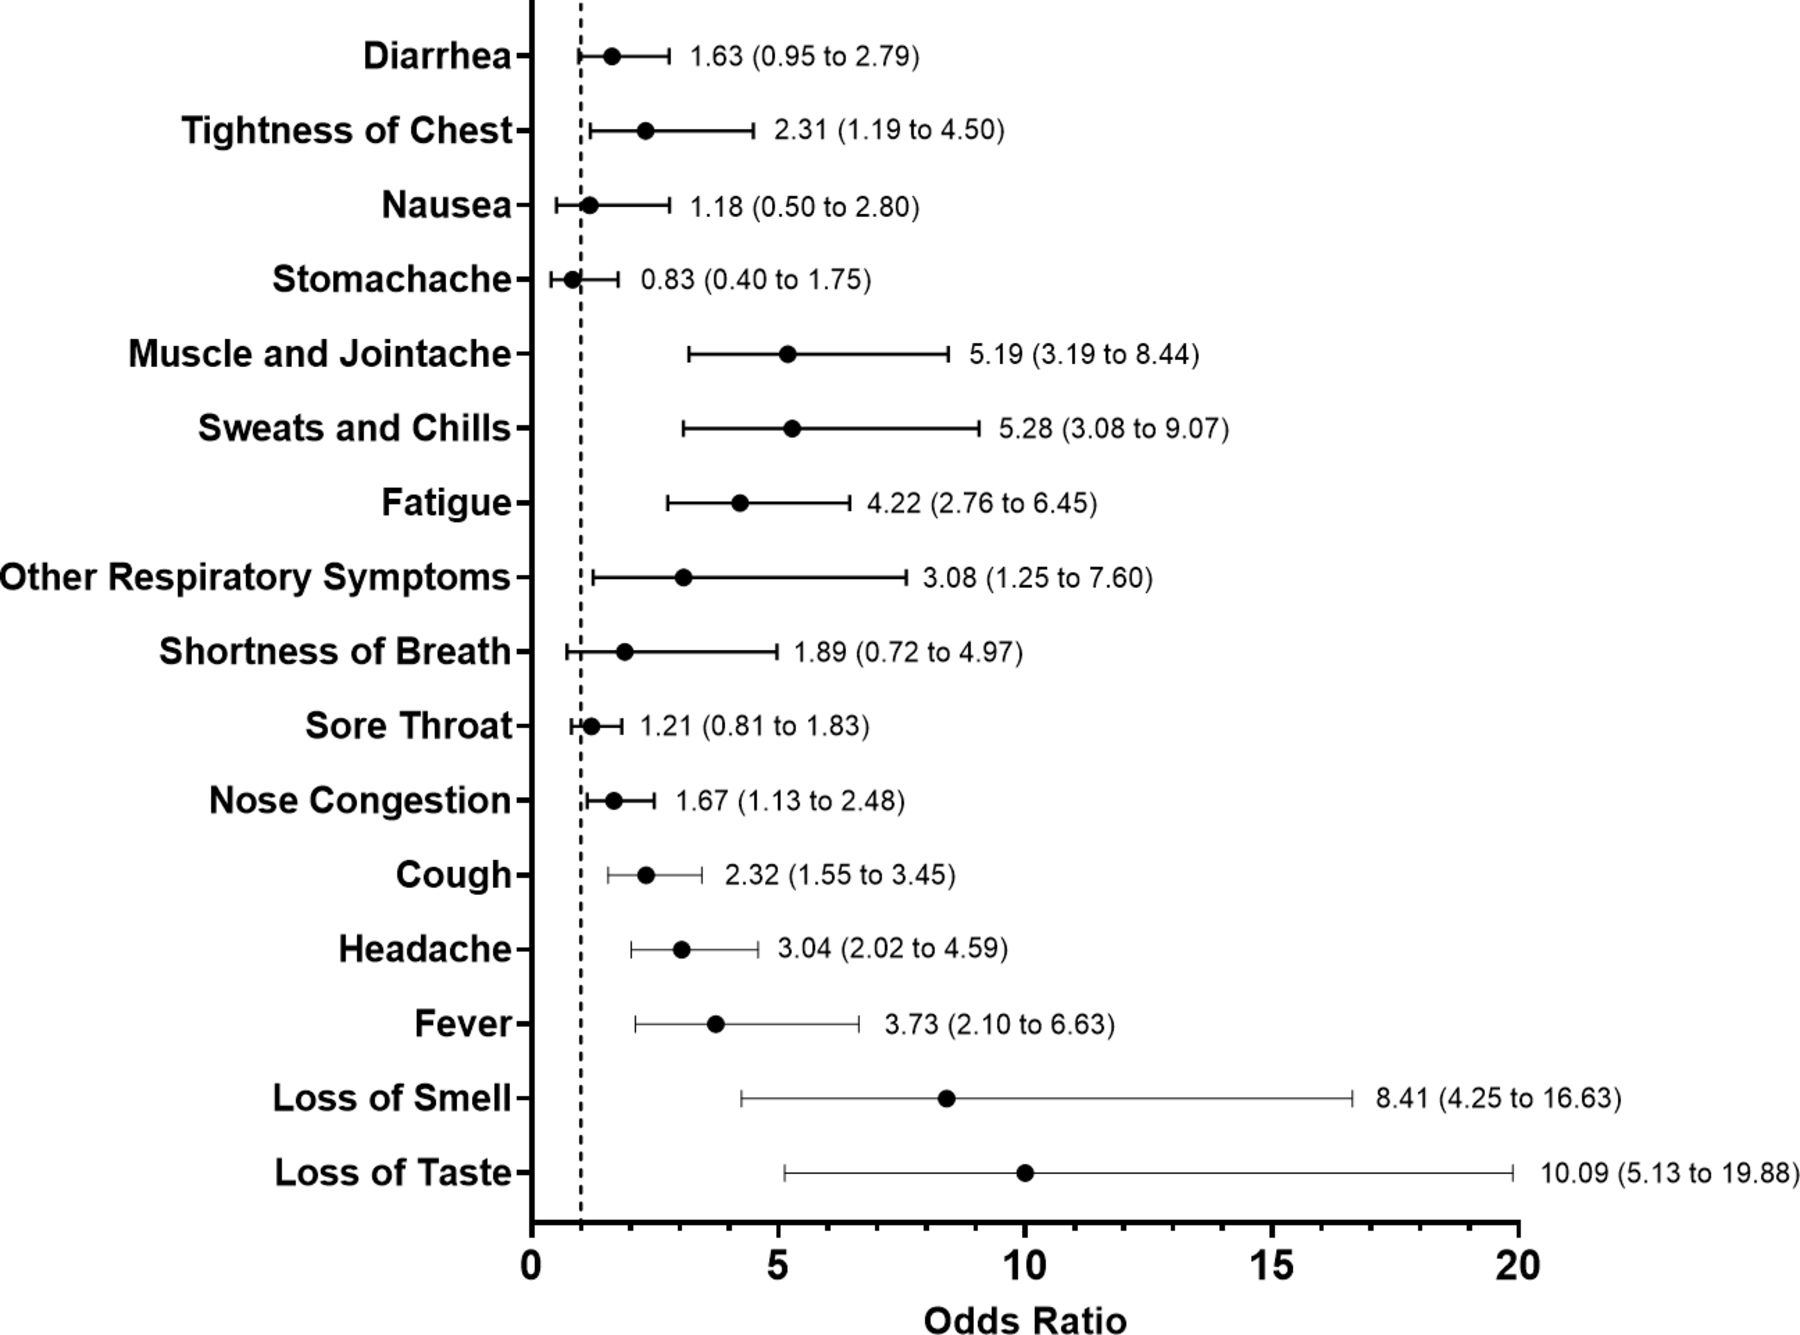
We next stratified seropositive individuals by their reported symptoms. ORs for each symptom were calculated for the timespan of 14 days following the event (figure 5). We identified that loss of smell (OR 8.78, 95% CI 4.81 to 16.02) and taste (OR, 95% CI 10.09, 95% CI 5.13 to 19.88) exhibited the strongest association with SARS-CoV-2 infection. Other symptoms which were strongly associated with COVID-19 were: sweats and chills (OR 5.28, 95% CI 3.08 to 9.07), muscle and joint ache (OR 5.19, 95% CI 3.19 to 8.44), fatigue (OR 4.22, 95% CI 2.76 to 6.45) and fever (OR 3.73, 95% CI 2.10 to 6.63) (figure 5). Importantly, 15.1% (28/186) of the infected individuals reported no symptoms at all in a period of 14 days after the event. The rate of asymptomatic infections of participants of the event was lower than generally observed in the community where the event took place (36%).5 Overall, there was a lower proportion of asymptomatic cases among individuals infected after the event compared with members of the community, while loss of smell and taste showed the strongest association with an infection.
ORs for symptoms of SARS-CoV-2 antibody positive participants in the 14 days following the super spreading event. The information on symptoms was derived from the self-administered questionnaire, which was filled out on the day of sample collection. OR estimates are shown with CIs.
Discussion
The high overdispersion characteristics of SARS-CoV2 and its ability to be transmitted via aerosols under certain conditions are one of the main reasons that the beginning of the SARS-CoV2 pandemic was shaped by superspreading events.8 9 Germany’s first superspreading event was an indoor carnival event in the beginning of 2020 in a rural community. In this naturally occurring experiment, we found that nearly half of the participants became infected and determined multiple prerequisites for superspreading and risk factors for becoming infected. While our study population is not a representative sample of the general population, the event may be regarded as exemplary for similar party occasions and may help reduce the number of those infected in the future. At the time of the event described herein SARS-CoV-2 had not diversified yet, but ever since many variants of the virus have arisen and have taken turns dominating the global pandemic. Therefore, the results shown here need to be viewed as qualified in describing a superspreading event under the circumstances in the beginning of the pandemic. However, they help us to understand infection dynamics and requisites for infection with this virus family, ultimately giving a frame of reference for similar studies conducted throughout the alpha, delta and omicron waves of the COVID-19 pandemic.
An important factor associated with infection risk was the ventilation system and the individual proximity to the ventilation outlets. Individuals close to the air outlets that contained air with low amount of fresh air had the highest infection risk compared with those close to the air inlets. This was particularly interesting, because we did not see any increased risk of infection from greater proximity to other infected persons, which indicates that ventilation was perhaps more important than physical proximity. Our findings are in line with previous studies that demonstrated SARS-CoV-2 to be able to become airborne under certain conditions and that the ventilation system can have an influence on virus spread.10–12 The air filters in the venue were not capable of intercepting virus particles supporting the notion on the importance of proper indoor ventilation systems.13 14 Indeed, spending the break of the event outside decreased the possibility of infection underscoring the benefit of proper ventilation or fresh air to lower the amount of aerosols. Due to the nature of the event, the spatial distribution of the participants was not fixed throughout the evening and not perfectly recapitulated, so this information carries some error. However, allowing for multiple positions per person, we used all available information. Assuming further error in the spatial data to be random, this might lead to a dilution of effects; that is, true associations may remain undetected. Complementary analyses including, for example, the persons’ functions during the event show consistent results, so we see no evidence suggesting bias in our findings. Nevertheless, the infection rate might be overestimated as the study was conducted 51 days after the event as participants could have become infected not related to the event. However, this weakness is limited by the official shut down of the community shortly after the event: a detailed timeline of the containment measures put in place after the superspreading event is included in Streeck et al.5 Briefly, a strict home quarantine for all attendees of the carnival event was imposed after 38 out of 99 participants tested positive for SARS-CoV-2. In addition, 13 days after the event, the town went into full lockdown, including the closing of schools, childcare and outpatient care facilities and restrictions of public access to the town. These concerted containment measures proved so effective that the peak of new infections in the community was already reached 27 days after the event.
The consumption of alcoholic drinks did not increase the risk of infection. While it has been assumed that the alcoholic effect of decreased social inhibition may increase likelihood of infection, we did not find any evidence for this association questioning measures of a ban on alcohol to reduce numbers of infected. It is known that current and former smokers disproportionately suffer from severe COVID-19, and their numbers are relatively increased among those patients that need intensive care treatment compared with non-smokers.15 16 However, it has been previously speculated that the risk of infection is lower for smokers.17 Furthermore, a meta-analysis of seven studies suggests that smokers have a reduced risk of testing positive for SARS-CoV-2.18 Interestingly, we also observed that regular smoking lowered the risk of infection. The association might, for example, be explained by a role of the nicotinic acetylcholine receptor (nAChR).19 Because other viruses, such as rabies virus, have been known to bind nAChRs, it was hypothesised recently that SARS-CoV-2 spike protein might bind nAChRs as a coreceptor for infection.20 21 Indeed, in silico molecular docking simulations predicted binding of spike to nAChRs.22 If this interaction proves to be of advantage to the virus, then nicotine or its derivatives that bind nAChRs could compete with SARS-CoV-2 for binding and thereby reduce interactions of the virus with its target cells. Currently, at least one prospective observational study is being undertaken on the effects of smoking on COVID-19 infection rates, including a smoking cessation control group on nicotine substitutes.23 While we strongly advise that smoking should not be considered as a protective habit to prevent risk of infection, this knowledge may lead to the investigation of a therapeutic or prophylactic treatment on the basis of this molecular target.24
Our results indicate a trend that younger people are less likely to be infected compared with older age groups. This trend is strongest for people under 18 years but levels out over 40 years of age. The risk of infection for children in superspreading events has not been investigated, but the overall risk for infection in children seems to be lower than for adults as a systematic review and its recent update reported, which is further supported by our findings.25 26 Considering the risk of infection with SARS-CoV-2 in general, however, in a meta-analysis, Madewell et al27 conclude that the secondary attack rate in households is lower to children contacts than to adult contacts. Many primary articles and meta-analyses point out the confounding effect of SARS-CoV-2 infections being mostly asymptomatic in young children has on the identification of children as index persons. To some extent, this problem could be avoided in our study since all participants of the event were invited to take part, regardless of age. As all individuals were exposed at the same event and time, our study is a very suitable model for the previously described notion that children are less likely to become infected. Indeed, a recently published meta-analysis by Viner et al showed a low susceptibility for children and adolescents (OR of 0.56, 95% CI 0.37 to 0.85)), which strongly supports our findings of a lower risk of infection in that age group, which is even lower in our study.28 Our finding supports the previously shown minor influence on the spreading of the virus by children. The finding that for every 10 additional years of age the risk of infection increases during an event indicates that younger people and their limited role should be considered when measures to contain the pandemic are implemented. It should be mentioned that although children had similar exposure compared with adults and probably spent even less time outside the venue hall, the behaviours of children may be different compared with adults. Therefore, we cannot exclude that our findings of lower seroprevalence in children might be biased by factors very specific to this particular event. Taken together, we demonstrate important risk factors for infection during a superspreading event, which helps to understand transmission dynamics in order to improve comprehensive public health preparedness measures, including mandatory ventilation during indoor events and age-adjusted measures according to different risk of infection.
As to the strengths and limitations of this study, the participant group is extremely well defined, and there was no bias or preselection during enrolment as there was only one criteria for invitation, namely presence at the event. Because of the time between the event and the study, it is possible that participants were infected unrelated to the event, but the official shut down of the community limits this risk. The number of index cases during the event is not known, and it is possible that a high number of individuals were already infectious. In addition, the identification of a past SARS-CoV-2 infection via serological test is not perfect, and according to the manufacturer, their IgG detection is 94.4% sensitive (on samples collected >10 days after beginning of symptoms or direct detection of virus) and 99.0% specific (for a ratio ≥0.8). For our infection rate analysis, this predicts 2 false positives and 10 false negative IgG results. However, when field tested by the UK National Health Service, the same assay showed 74.7% sensitivity (62 false-negatives in our data set) and the same specificity of 99.0%.
Data availability statement
Data are available on reasonable request. All data are available upon reasonable request.
Ethics statements
Patient consent for publication
Ethics approval
The Ethics Committee of the Medical Faculty of the University of Bonn, Germany approved the study (reference number 085/20). Participants gave informed consent to participate in the study before taking part.
Acknowledgments
We would like to thank the inhabitants of the town of Gangelt for their participation. We would also like to thank the local government of the town where the outbreak took place for their support to conduct the study. Furthermore, we would like to thank the following people who helped with the study: Rudi Kirschen, Gero Wilbring, Janett Wieseler, Marek Korencak, Ryan Nattrass, Jernej Pusnik, Maximilian Becker, Ann-Sophie Boucher, Marc Alexander de Boer, Rebekka Dix, Sara Dohmen, Kim Friele, Benedikt Gansen, Jannik Geier, Marie Gronemeyer, Sarah Hundertmark, Nora Jansen, Michael Jost, Louisa Khorsandian, Simon Krzycki, Ekaterina Kuskova, Judith Langen, Silvia Letmathe, Ann-Kathrin Lippe, Jonathan Meinke, Freya Merker, Annika Modemann, Janine Petras, Sophie Marie Porath, Anna Quast, Laurine Reese, Isabel Maria Rehbach, Jonas Richter, Thea Rödig, Eva Schmitz, Tobias Schremmer, Louisa Sommer, Jennifer Speda, Yuhe Tang, Oliver Thanscheidt, Franz Thiele, Johanna Thiele, Julia Tholen, Moritz Transier, Maike van der Hoek, Tillmann Verbeek, Sophia Verspohl, Kira Vordermark, Julian Wirtz, Marina Wirtz, Lisa Zimmer, Philip Koenemann, Adi Yaser, Lisa Anna, Katharina Bartenschlager, Lisa Baum, Roxana Böhmer Romero, Diana de Braganca, Isabelle Engels, Moritz Färber, Carina Fernandez Gonzalez, Lucia Maria Goßner, Victoria Handschuch, Franziska Georgia Liermann, Steffan Meißner, Laura Racenski, Patrick, Denis Raguse, Larissa Reiß, Maximilian Rölle, Franziska Scheele, Chiara Schwippert, Arlene Christin Schwippert, Antonia Seifert, Joshua David Stockhausen, Sofia Waldorf, Leonie Weinhold, Nicolai Trimpop, Julia Reinhardt, Vera Gast, Michelle Yong, Eva Engels, Jonathan Meinke, Susanne Schmidt, Janine Schulte, Saskia Schmitz, Kübra Bayrak, Regina Frizler, Katarzyna Andryka, Sofía Soler, Bastian Putschli, Thomas Zillinger, Marcel Renn, Patrick Müller, Dillon Corvino, Zeinab Abdullah, Katrin Paeschke, Hiroki Kato, Florian Schmidt, Maximilian Baum, Celina Schüter, Daniel Hinze, Martina Schmidt, Arcangelo Ricchiuto, Sonja Gross, Uta Wolber, Tobias Höller, Marion Zerlett, Esther Sib, Benjamin Marx, Souhaib Aldabbagh. We thank the Medizinischer Dienst der Krankenkasse (MDK) Nordrhein for their generous help in conducting this study. In particular we would like to thank: Tanja Bell, Ina de Hesselle-Taddey, Susanne Goll, Katja Hoffmann-Pruss, Niko Kalamakidis, Verena Kayser, Hildegard Kessler, Norbert Körfer, Daniela Kroll, Florian Messerschmidt, Svenja Peters, Sebastian Schröder, Linda Schroers, Michael Zimmermann, Klaus-Peter Thiele. We thank Stefan Holdenrieder, Alexander Semaan, Bernd Pötzsch and Georg Nickenig for providing control samples. The idea, the plan, the concept, protocol, the conduct, the data analysis and the writing of the manuscript of this study were independent of any third parties, including the government of North Rhine-Westphalia, Germany.
References
Supplementary materials
Supplementary Data
This web only file has been produced by the BMJ Publishing Group from an electronic file supplied by the author(s) and has not been edited for content.
Footnotes
Contributors LW, ER, BS and HS wrote the manuscript. LW, RMS and ER organised and ran the testing center. ME inspected the event venue and examined ventilation and air filtration systems. ER and BS organised and performed sample processing, experiments, analyses and corrected the manuscript. NL and AH performed statistical analysis. MC, CF and AK monitored the study. ME, K-HJ and HS oversaw the study and corrected the manuscript. HS acts as a guarantor for this work.
Funding The government of North Rhine-Westphalia (Germany) supported the study with €65 000.
Competing interests None declared.
Patient and public involvement Patients and/or the public were involved in the design, or conduct, or reporting, or dissemination plans of this research. Refer to the Methods section for further details.
Provenance and peer review Not commissioned; externally peer reviewed.
Supplemental material This content has been supplied by the author(s). It has not been vetted by BMJ Publishing Group Limited (BMJ) and may not have been peer-reviewed. Any opinions or recommendations discussed are solely those of the author(s) and are not endorsed by BMJ. BMJ disclaims all liability and responsibility arising from any reliance placed on the content. Where the content includes any translated material, BMJ does not warrant the accuracy and reliability of the translations (including but not limited to local regulations, clinical guidelines, terminology, drug names and drug dosages), and is not responsible for any error and/or omissions arising from translation and adaptation or otherwise.