Article Text

Abstract
Objective (1) To estimate the pooled prevalence of multimorbidity in all age groups, globally. (2) To examine how measurement of multimorbidity impacted the estimated prevalence.
Methods In this systematic review and meta-analysis, we conducted searches in nine bibliographic databases (PsycINFO, Embase, Global Health, Medline, Scopus, Web of Science, Cochrane Library, CINAHL and ProQuest Dissertations and Theses Global) for prevalence studies published between database inception and 21 January 2020. Studies reporting the prevalence of multimorbidity (in all age groups and in community, primary care, care home and hospital settings) were included. Studies with an index condition or those that did not include people with no long-term conditions in the denominator were excluded. Retrieved studies were independently reviewed by two reviewers, and relevant data were extracted using predesigned pro forma. We used meta-analysis to pool the estimated prevalence of multimorbidity across studies, and used random-effects meta-regression and subgroup analysis to examine the association of heterogeneous prevalence estimates with study and measure characteristics.
Results 13 807 titles were screened, of which 193 met inclusion criteria for meta-analysis. The pooled prevalence of multimorbidity was 42.4% (95% CI 38.9% to 46.0%) with high heterogeneity (I2 >99%). In adjusted meta-regression models, participant mean age and the number of conditions included in a measure accounted for 47.8% of heterogeneity in effect sizes. The estimated prevalence of multimorbidity was significantly higher in studies with older adults and those that included larger numbers of conditions. There was no significant difference in estimated prevalence between low-income or middle-income countries (36.8%) and high-income countries (44.3%), or between self-report (40.0%) and administrative/clinical databases (52.7%).
Conclusions The pooled prevalence of multimorbidity was significantly higher in older populations and when studies included a larger number of baseline conditions. The findings suggest that, to improve study comparability and quality of reporting, future studies should use a common core conditions set for multimorbidity measurement and report multimorbidity prevalence stratified by sociodemographics.
PROSPERO registration number
CRD42020172409.
- epidemiology
- general medicine (see internal medicine)
- geriatric medicine
Data availability statement
All data relevant to the study are included in the article or uploaded as supplementary information.
This is an open access article distributed in accordance with the Creative Commons Attribution Non Commercial (CC BY-NC 4.0) license, which permits others to distribute, remix, adapt, build upon this work non-commercially, and license their derivative works on different terms, provided the original work is properly cited, appropriate credit is given, any changes made indicated, and the use is non-commercial. See: http://creativecommons.org/licenses/by-nc/4.0/.
Statistics from Altmetric.com
Strengths and limitations of this study
This study used meta-regression to examine the variation of estimated prevalence of multimorbidity and how measure and study characteristics influenced prevalence estimates.
The use of multiple imputation in this study minimised biased estimates caused by missing values and unbalanced classes and enhanced statistical accuracy.
The inclusion of studies with various measure and study characteristics enabled a better understanding of the contributing factors of the heterogeneity of multimorbidity prevalence.
Due to inconsistent reporting of multimorbidity prevalence and data unavailability, the estimated multimorbidity prevalence stratified by sex, ethnicity and socioeconomic status could not be explored in this study.
Introduction
Population ageing is a worldwide phenomenon, with WHO estimating that the proportion of the global population aged 60 years and older will double from 12% to 22% between 2015 and 2050.1 A key implication of population ageing is that increasing numbers of people will be living with multimorbidity. Multimorbidity, commonly defined as the co-occurrence of two or more long-term conditions,2 adversely affects people’s risk of death, health-related quality of life, functional ability and mental well-being.3 4 Multimorbdiity affects all groups of society, but is known to be more common in older people, in women and in those from low socioeconomic backgrounds, particularly in high-income countries.5–7 In low-income and middle-income countries (LMICs), people living in urban areas, on the other hand, were found to have a higher rate of multimorbidity prevalence.8 Multimorbidity poses major challenges to the delivery of care in health systems internationally, which are often focused on the management of single diseases and lack appropriate coordination and continuity of care across different sectors.9 10 Disparities in health and health and social care could be found at any stage along the continuum of chronic diseases, from prevention to the management of diseases. To understand these disparities among multimorbid populations, it requires consistently monitoring the populations (eg, incidence, prevalence, health impact, risk factors and delivery of care) defined by race and ethnicity, gender, age, socioeconomic status, physical environment and geographic factors.
Previous systematic reviews have identified issues in the measurement of multimorbidity, related to the choice of chronic conditions counted in measures, the categorisation of conditions and diseases and the counting or weighting method used.11–13 Although weighted measures are often used when the purpose of measurement is to predict future outcomes, a simple count of conditions remains the most commonly used method for the measurement of multimorbidity, and is optimal for estimating multimorbidity prevalence.13 14 However, the estimated prevalence of multimorbidity varies widely in the literature ranging from 3.5% to 100%,15 likely reflecting a combination of varying measures and varying populations studied.16 Much of the research up to now has not quantitatively investigated the variation in multimorbidity prevalence and its influencing factors in much detail. Understanding the links between prevalence estimates and measurement approaches can better inform and support future development of multimorbidity measurement guidelines. Therefore, this review aimed to examine the pooled prevalence of multimorbidity in all age groups, globally and how measurement of multimorbidity impacted the estimated prevalence.
Research questions
What is the pooled prevalence of multimorbidity and does it differ between different age groups?
What are the factors that influenced the variation in prevalence estimates across studies?
Methods
The systematic review and meta-analysis reported here is part of a larger review which aimed to examine (1) how multimorbidity has been constructed, (2) measured by international studies and (3) variation in the estimated prevalence of multimorbidity across studies. Analysis in relation to the first two registered objectives has been reported,13 and this paper reports the third registered objective. The PROSPERO registration number for this paper is therefore the same as for the first published paper from this work.13
Inclusion and exclusion criteria
The eligibility criteria for this review were defined based on the CoCoPop framework—condition, context and population.17 The condition included in this review is prevalence of multimorbidity. The majority of studies defined multimorbidity as the co-existence of two or more chronic conditions, and used the cut-off to estimate its prevalence in a population of interest. We therefore included studies that used this definition for examining multimorbidity prevalence across international studies. For this analysis, we included studies carried out in the community, primary care, care home and hospitals and those estimating the prevalence of multimorbidity in the population studied. Studies that did not include a relevant denominator population—for example, only examining patients with an index condition or excluding patients who did not have multimorbidity—were excluded. Qualitative research, studies not published in English and conference abstracts were also excluded.
Search strategy
The search strategy for this review was developed in collaboration with a specialist medical librarian (online supplemental table S1). Key terms relevant to multimorbidity and measurement were combined using Boolean logic to identify studies that met the inclusion criteria. We included medical subject headings to provide a sensitive search for relevant literature. Databases included in the search were Ovid interface (PsycINFO, Embase, Global Health, Medline), Scopus, Web of Science, Cochrane Library, EBSCO interface (CINAHL Plus) and ProQuest Dissertations and Theses Global, from inception to 21 January 2020 (we are not aware of any large recently published studies since that date). In addition to the database searches, our secondary search strategy included hand-searching reference lists of retrieved articles and tracked citations to maximise the yield.
Supplemental material
Study screening and selection
Articles retrieved from databases were organised using EndNote X9 bibliographic software and Excel, and then were imported to Covidence for screening.18 Titles, abstracts and full-texts of retrieved articles were screened against the eligibility criteria by two reviewers. Throughout the review process, any disagreement that arose was resolved through discussion between the two reviewers (IS-SH and PH), and through the involvement of a third reviewer (BG) if necessary. The study selection process is summarised in figure 1.
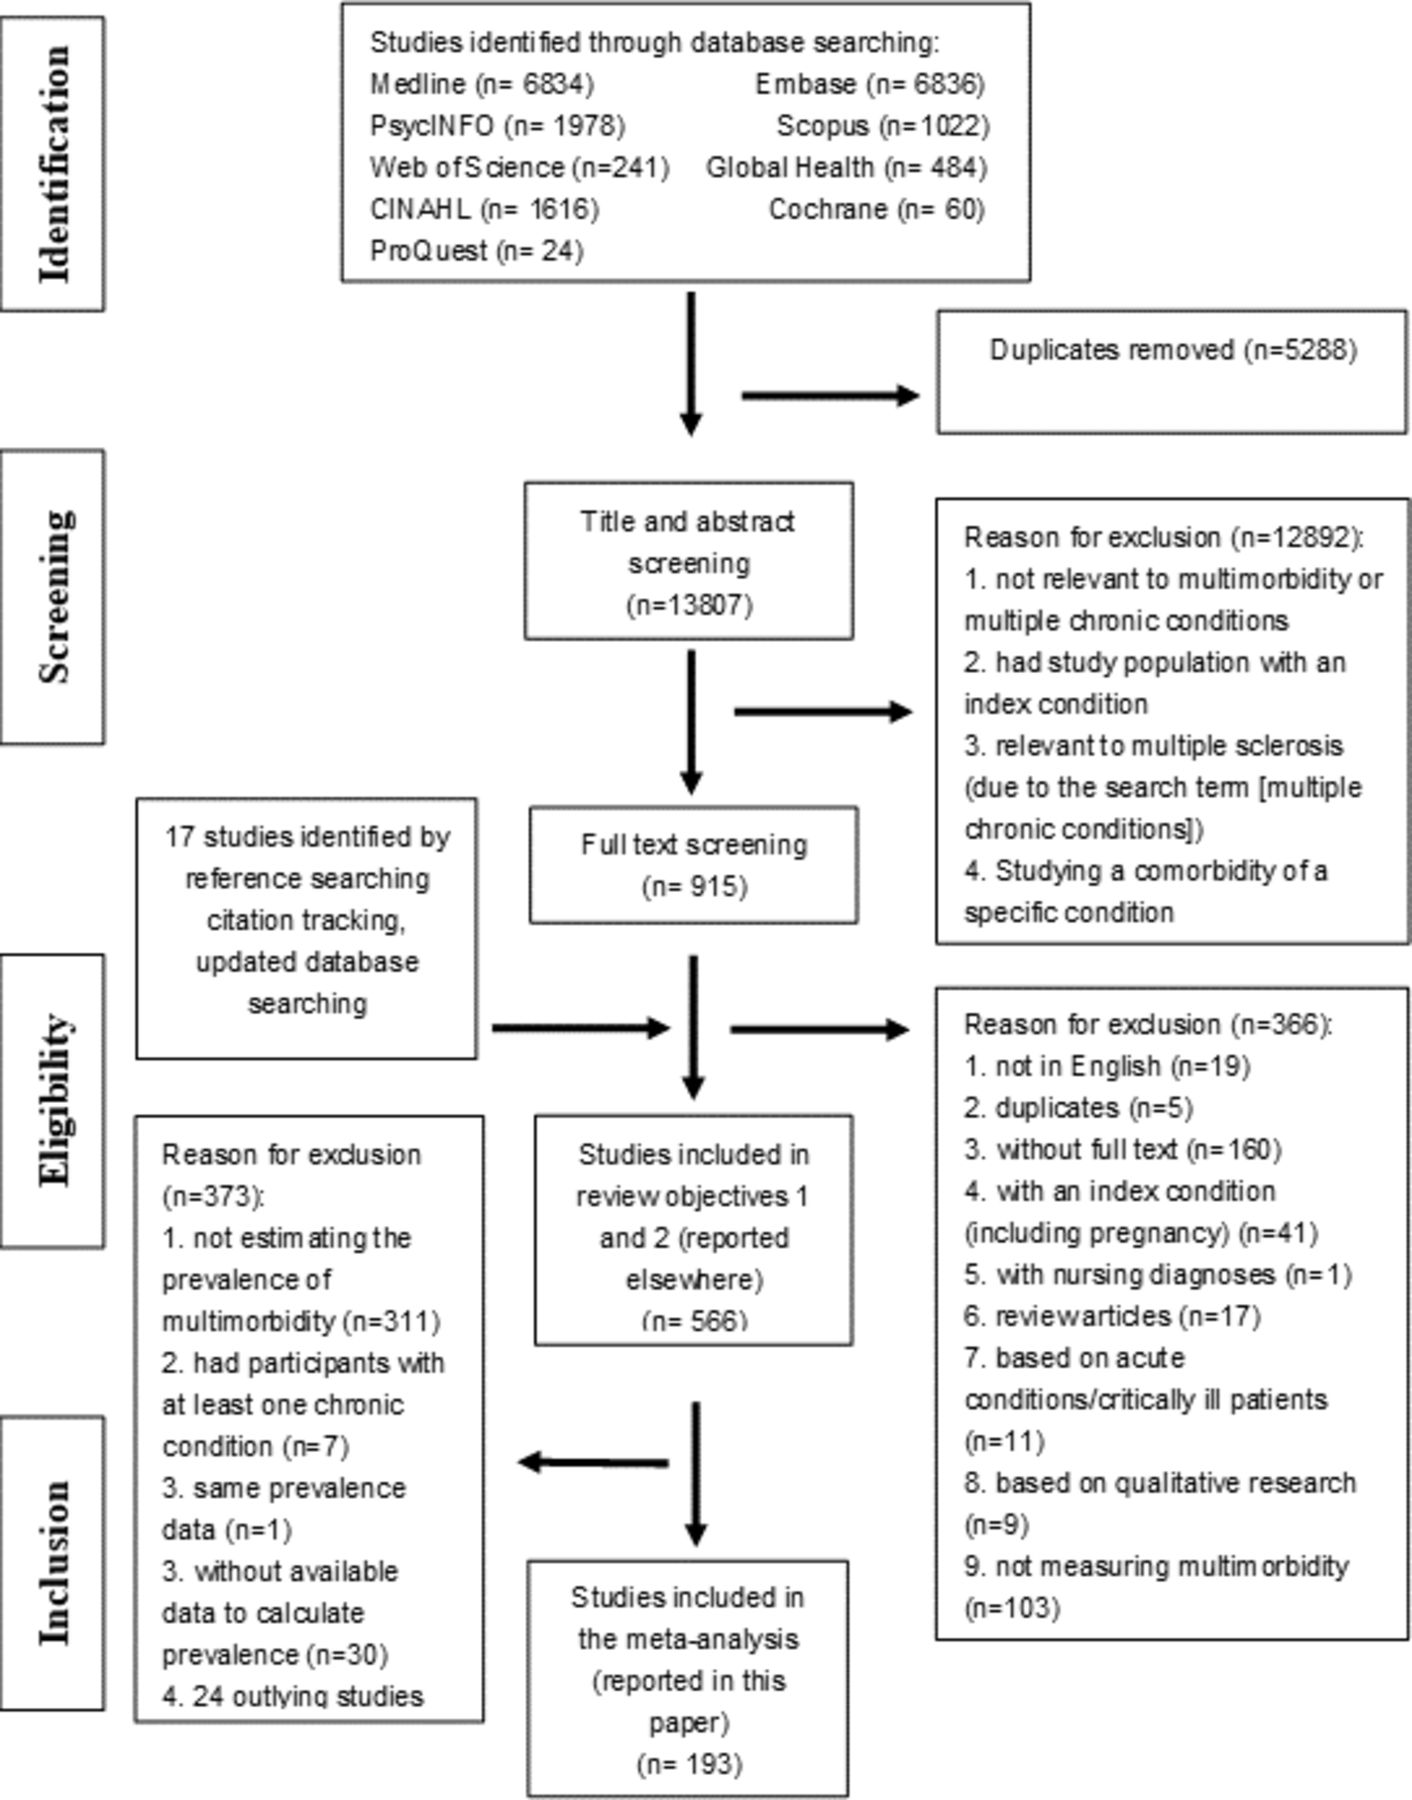
Preferred Reporting Items for Systematic Reviews and Meta-Analyses flow diagram.
Data extraction
We extracted data on the characteristics of the included studies using predesigned data extraction pro forma. The extracted data included (1) authors, (2) publication year, (3) study purpose, (4) method, (5) country, (6), continent, (7) country income (classified as ‘high’ and ‘low or medium’ (combined because of small numbers) allocated based on the World Bank Group at the time of review19), (8) study participants, (9) mean age, (10) sample size, (11) number of conditions, (12) setting, (13) data collection method/data source, (14) number of multimorbidity cases and (15) proportion of multimorbidity (calculated based on item 10 and 14). Data on the estimated prevalence stratified by sex, ethnicity and socioeconomic status were fragmented and unavailable in many studies, and thus these could not be retrieved for analyses.
Risk of bias assessment
We used the Effective Public Health Practice Project quality assessment tool for quantitative studies to assess the risk of bias and the quality of each of the included studies, in terms of (1) selection bias, (2) study design, (3) confounders, (4) blinding, (5) data collection method, (6) withdrawals and dropouts.20 We assessed also publication bias (rated high if there was selective reporting within studies) and conflict of interest (rated unclear if conflict of interest declaration was not reported). Each study was rated and assigned an overall risk of bias as ‘high’, ‘moderate’ or ‘low’ (see the details in online supplemental appendix p. 26).
Data analysis
Descriptive statistics were used to summarise study characteristics. Since distributions were skewed, median and IQR were used to measure the central tendency and examine variability of variables such as mean age and number of conditions. Categorical (eg, continent, study population and data source) and ordinal data (eg, country income and risk of bias) were examined using frequency tables. To investigate the association between continuous/count predictor (mean age/number of conditions) and categorical predictors, univariate generalised linear models were used. We summarised the prevalence of multimorbidity using metaprop.21 22 The presence of effect size heterogeneity was examined using the Q statistic and I2. Significant heterogeneity was identified, so we used subgroup analysis and meta-regression with random-effects models to identify potential moderating factors.
Outlying studies were identified using studentised residuals, leave-one-out analysis and Mahalanobis distance. Studies with studentised residuals that were larger than two or three and those that contributed to heterogeneity in leave-one-out analyses were scrutinised.23 Mahalanobis distance was used for pattern recognition and multivariate outlier detection.24 Study effect sizes were graphically displayed to identify outlying studies and explore subgroup effects (online supplemental figure S1). In initial analysis of heterogeneity and outliers, 24 studies were found to make a significant contribution to the high level of observed heterogeneity in multimorbidity prevalence and significant changes in the summary effect size. The 24 studies were excluded for one or more of the following reasons: (1) their contribution to high levels of heterogeneity in the leave-one-out test, (2) being identified as an outlying value in the studentised residuals test (z-score ≥2), (3) their Mahalanobis distance exceeding the χ2 critical value at a 0.01 significance level, (4) infrequent values in compositional categorical data (eg, only one study examined prevalence in children). The process of identifying outliers, the rationale for exclusion of each study and the characteristics of outlying studies are documented in online supplemental figure S2 ane table S2 and online supplemental table S3. Sensitivity analysis was performed to explore the impact of excluding the 24 studies in meta-analysis.

Country of origin of the included studies estimating the prevalence of multimorbidity (except studies from multiple countries).
There was missingness in two predictors, with 37% missingness in the ‘mean age’ of the study population variable (some of which reported it categorically, and thus were treated as missing data) and 6% missingness in the ‘number of conditions’ included in the multimorbidity measure variable. Previous research has shown that complete case removal (removing missing data in a data set) in meta-regression could lead to biased coefficient estimates of predictors (varied widely from complete-data estimates), whereas multiple imputation was found to perform well at generating estimates that were close to complete-data estimates.25 Therefore, in this review, multiple imputation with 60 imputed datasets and 10 iterations was conducted where random forest was used to impute missing data.26 27 Following multiple imputation, fraction of missing information was computed to quantify the impact of missing data, which ranged from 0.05 to 0.3 indicating that the uncertainty in the values imputed for missing data is small/moderate.28
A random-effects regression tree approach with 10-fold cross-validation was used to identify subgroups (cut-offs) of the ‘mean age’ and ‘number of conditions’ variables with differential effect sizes.29 Given considerable variation in the effect sizes, we conducted meta-regression with the restricted maximum likelihood (REML) estimator to examine the possible sources of heterogeneity in effect sizes.21 22 30 As the variable ‘multimorbidity prevalence’ did not follow the normal distribution (positively skewed), we applied logit transformation to the variable for analyses and converted the logits back to ORs (elogit) and proportions (p=elogit/elogit+1) for reporting. For model selection, we refitted the models using maximum likelihood and then conducted a log-likelihood test to compare the fit of models.31 A permutation test with 1000 permuted datasets was conducted to validate the robustness of the final model by rearranging and shuffling the order of the data and re-calculating p values to check whether there is type 1 error.32 Subgroup analysis with the REML method was used to estimate the pooled multimorbidity prevalence of subgroups of each variable (age, the number of conditions included in a measure, setting, data source, continent, country income, study risk of bias). Forest-like plots were used to display the effect sizes of included studies.33 The presence of publication bias was assessed using Egger’s test, which did not find evidence of publication bias.34 All statistical tests were performed using R V.4.0.4.
Patients and public involvement
No patients were involved in the development of the research question, outcome measures, study design and implementation. Nonetheless, we have previously discussed preliminary review findings and issues relevant to multimorbidity measurement with our patient and public involvement group. We plan to disseminate the review findings to researchers, clinicians, policy makers and public audiences through news media, social media and seminars.
Results
After screening 13 807 titles and abstracts, 217 studies were identified which estimated the prevalence of multimorbidity using a cut-off of ‘two or more’ conditions. Following the removal of 24 outlying studies, 193 studies were included in the meta-analysis (table 1, online supplemental table S4). Of the 193 studies, 64 studies were from Europe, 47 from North America, 44 from Asia, 11 from Australasia, 12 from South America and 4 from Africa (table 1 and figure 2).
Summary of study characteristics (online supplemental table S8 shows the definition of variables)
Seventy-five per cent of studies were from high-income countries (n=145) and 24.9% from LMICs (1 from low-income, 8 from lower middle-income, 29 from upper middle-income and 10 from multiple LMICs). The majority of studies (n=147) estimated the prevalence of multimorbidity in community settings, followed by primary care (n=32) and hospital setting (n=14). Prevalence data were collected through either self-report (n=150) or medical records and administrative databases (n=43). In a univariate linear regression (online supplemental table S5), we found that studies from Europe, database studies and studies conducted in hospital settings were more likely to measure multimorbidity in an older population and included a larger number of conditions in a multimorbidity measure, compared with those from other continents, self-report studies and studies conducted in primary care and community settings. In respect to risk of bias in included studies (online supplemental table S6 and figure S3), 11.4% were rated as high risk of bias, 83.9% as moderate risk of bias and 4.7% as low risk of bias.

Relationship between the prevalence of multimorbidity and mean age or number of conditions (the area of points is proportional to inverse variances).
The pooled estimate of multimorbidity prevalence across the 193 studies was 42.4% (95% CI 38.9% to 46.0%), τ2 is 1.0 (95% CI 0.9 to 1.3) with high heterogeneity (I2 >99%) and meta-regression was therefore used to examine study characteristics associated with heterogeneity. Mean age (F=89.8, p<0.0001, R2=31.7%) and number of conditions (F=39.2, p<0.0001, R2=16.7%) were the strongest univariate predictors and positively associated with the estimated prevalence of multimorbidity (figure 3). Meta-regression tree analysis (online supplemental figure S4) partitioned the mean age variable into three homogeneous subgroups (aged <59, 59–73 and ≥74 years) and the number of conditions variable into four homogeneous subgroups (<9, 9–19, 20–43, ≥44). The categorical ‘mean age’ and ‘number of conditions’ variables explained 35.9% and 19.5% of the heterogeneity in effect sizes, respectively (larger than the original numerical variables). Therefore, the categorical variables identified from the regression trees for meta-analyses were used for meta-regression.

The distribution of prevalence estimates within the subgroups of mean age and number of conditions (forest-like plot for a large review).
In univariate meta-regression, primary care studies (pooled multimorbidity prevalence 50.5%, OR 1.6, 95% CI 1.1 to 2.3) and hospital-based studies (pooled multimorbidity prevalence 59.6%, OR 2.3, 95% CI 1.3 to 4.0) had significantly higher rates of multimorbidity than community-based studies (39.1%) (table 2). Multimorbidity prevalence was significantly higher in database studies (pooled multimorbidity prevalence 52.7%, OR 1.7, 95% CI 1.2 to 2.4) than self-reported studies (pooled multimorbidity prevalence 40.0%). In the mean age categorical variable, the pooled prevalence estimates of the three subgroups were statistically significantly different from one another, and considerably higher in studies with mean participant age ≥74 years (pooled multimorbidity prevalence 67.0%, OR 5.2, 95% CI 3.8 to 7.2) and mean participant age 59–73 years (pooled multimorbidity prevalence 47.6%, OR 2.3, 95% CI 1.8 to 3.0) than those with mean participant age <59 years (pooled multimorbidity prevalence 28.0%) (table 2 and figure 4). Similar patterns were also found in the number of conditions variable where studies including ≥44 conditions in measurement (pooled multimorbidity prevalence 87.6%, OR 16.5, 95% CI 6.4 to 42.6), 20–43 conditions (pooled multimorbidity prevalence 52.1%, OR 2.5, 95% CI 1.7 to 3.7) and 9–19 conditions (pooled multimorbidity prevalence 43.7%, OR 1.8, 95% CI 1.3 to 2.5) yielded higher prevalence estimates than studies including <9 conditions in measurement (pooled multimorbidity prevalence 30.1%) with a dose-response relationship. The estimated prevalence of multimorbidity was 44.3% in high-income countries compared with 36.8% in LMICs, but the difference was not statistically significantly different (OR 1.4, 95% CI 1.0 to 1.9). In study risk of bias, no statistically significant difference in pooled prevalence of multimorbidity was found between studies with low, moderate and high risk of bias.
Output of meta-analytic models (n=193)
In the adjusted meta-regression model, compared with studies where participant mean age was <59 years, multimorbidity prevalence remained significantly higher in studies with mean participant age 59–73 years (OR 2.2, 95% CI 1.7 to 2.8) and in studies with mean participant age ≥74 years (OR 4.4, 95% CI 3.3 to 5.9). Compared with measures including <9 conditions, multimorbidity prevalence was higher in measures including ≥44 conditions (OR 8.2, 95% CI 3.8 to 17.5), 20–43 conditions (OR 2.3, 95% CI 1.6 to 3.2) and 9–19 conditions (OR 1.8, 95% CI 1.4 to 2.3). In respect to study settings, the pooled prevalence was significantly higher in primary care settings compared with community settings (OR 1.6, 95% CI 1.1 to 2.3). Compared with studies from North America, prevalence was lower in studies from Europe (OR 0.5, 95% CI 0.4 to 0.7), Australasia (OR 0.5, 95% CI 0.3 to 0.8), Asia (OR 0.6, 95% CI 0.4 to 0.8) or Africa (OR 0.3 95% CI 0.1 to 0.6). No significant difference in prevalence estimates between self-report and routine database studies was evident after controlling for study and measure characteristics. The model explained 54.3% of the heterogeneity in multimorbidity prevalence, with the mean age and number of conditions variables providing most explanatory power (47.8% of the heterogeneity).
Sensitivity analysis including the 24 outlying studies (online supplemental table S7) was similar to primary analysis except for ‘number of conditions’ variable. The mean participant age and number of conditions variables remained the strongest predictors of multimorbidity prevalence in sensitivity analysis. However, the estimated prevalence in sensitivity analysis (including outlying studies) was much lower in studies including ≥44 conditions in a multimorbidity measure (pooled multimorbidity prevalence 54.5, OR 2.8, 95% CI 1.5 to 5.4) compared with primary analysis excluding outlying studies (pooled multimorbidity prevalence 87.6, OR 16.5, 95% CI 6.4 to 42.6). The difference in estimates was mainly attributed to the three outlying studies that included 146, 147 and 259 conditions in a measure respectively but yielded relatively low mean multimorbidity prevalence (mean prevalence 54.3%).35–37
Discussion
The overall estimate of multimorbidity prevalence in adults across all the included studies was 42.4% (95% CI 38.9% to 46.0%), but with very high heterogeneity. More than half of the observed heterogeneity was explained by study mean participant age and the number of conditions included in the multimorbidity measure, with older age and larger number of conditions strongly associated with a higher prevalence of multimorbidity. The difference in estimated prevalence was small between self-reported and administrative/clinical databases, and between study settings. No significant difference was found between studies from LMICs and high-income countries, but North American studies had higher estimated prevalence and African studies had the lowest estimated prevalence than other continents.
Three prior systematic reviews examined the prevalence of multimorbidity across studies.38–40 Fortin et al 38 and Violan et al 40 conducted a narrative review and found various operationalisations of multimorbidity and a large variation in the prevalence of multimorbidity, particularly in studies with older adult populations or those with low socioeconomic status.38 40 Nguyen et al 39 meta-analysed the prevalence of multimorbidity across 70 studies from community settings and found that the pooled estimated prevalence was 33.1% with high levels of heterogeneity (I2 >99%).39 The pooled prevalence of multimorbidity in the study by Nguyen et al is lower than in this study, likely because we have included studies from primary care and hospital settings (the pooled prevalence of multimorbidity in community-based studies in this analysis was 39.5%). Nguyen et al 39 did not carry out a meta-regression, but in narrative analysis comment that the prevalence of multimorbidity appeared higher in older adults and women.39 Our review findings are consistent with previous literature finding that age is most important determinant of multimorbidity.5 38 39 41 While we did not find a significant difference between LMICs and high-income countries, Nguyen et al in their review showed a statistically significantly higher pooled prevalence in high-income countries (the pooled prevalence from 18 studies was 37% compared with 36.8% in this review of 145 studies) than LMICs (the pooled prevalence from 31 studies was 29% compared with 44.3% in this review of 48 studies). This difference in findings may be due to the inclusion in our review of a larger number of studies from high-income or upper middle-income countries. The low number of included studies from low-income countries in this review could be explained by less attention paid to this relatively new research field (multimorbidity) in low-income countries and our literature search restricted to English language (proficient language of reviewers). The estimated prevalence of multimorbidity in North America was higher compared with other continents in this study despite older study populations and larger numbers of conditions found in studies from Europe. A possible explanation for the higher prevalence in North America is that private or insurance-based healthcare systems are more likely to code conditions since it affects remuneration, as well as cultural differences in relation to overdiagnosis and medicalisation.42 On the other hand, the lower estimated multimorbidity prevalence in African studies could be attributed to the predominance of infectious diseases and inadequate access to medical care including diagnostic services.43
The strengths of this review are searches conducted in multiple databases, the large number of studies identified and the use of meta-analytic approaches to examine factors associated with heterogeneity of estimated multimorbidity prevalence. We examined and handled outlying studies and missing data (multiple imputation) with rigour and excluded studies that did not take into account ‘healthy’ populations (populations with no long-term conditions) to minimise biased estimates of multimorbidity prevalence. This review has limitations. Sensitivity analysis including all studies had similar findings with one exception, namely that sensitivity analysis found a weaker (but still statistically significant) association with the number of conditions included in the multimorbidity measure than primary analysis. Although we examined associations with study characteristics including mean participant age, a limitation is the lack of information in the reviewed studies on prevalence estimates stratified by participant characteristics including sex, ethnicity and socioeconomic status. An additional uncontrolled factor is how studies measured multimorbidity in terms of the type (as opposed to the number) of the conditions included in measures, which varied substantially across studies with too much heterogeneity to model.13 The exclusion of non-English studies in this review may also limit the generalisability of the research findings. Last but not least, measurement of multimorbidity is a relatively new research field and its labelling has been used variably. Thus, it is likely that not all relevant studies were identified and included in this review, but we were rigorous in our application of inclusion/exclusion criteria and did not favour adding known papers that did not appear in the search or where excluded through the process.
In spite of the methodological limitations, this review adds to our understanding of how study and measure characteristics can influence the estimated prevalence of multimorbidity. Mean age of the study population and the number of conditions included in the multimorbidity measure were the major factors associated with varying estimated prevalence of multimorbidity. A key implication is that comparing prevalence between studies requires more stratified estimates of multimorbidity prevalence. We therefore strongly recommend that as well as overall prevalence, future studies should clearly report multimorbidity prevalence stratified by age, in 5-year age bands to ensure granularity and by sex at a minimum, and ideally by ethnicity and socioeconomic status. This will allow readers to capture a more holistic picture of multimorbidity prevalence in the population studied, and allow better comparison of prevalence in different populations, and accurate pooled estimates of prevalence in reviews.
Additionally, the number of conditions included in a measure is strongly associated with estimated multimorbidity prevalence. It would be ideal if studies additionally reported prevalence using a common core set of conditions agreed by consensus. Parallel reporting of the bespoke set chosen for the context and purpose, and a core set would improve comparability of prevalence estimates, and help identify the additional value of any bespoke multimorbidity measures. The lack of any significant difference in estimated prevalence between self-report and clinical/administrative databases in this review suggests that provided careful attention is paid to the number and type of conditions included in measures, exactly how data are collected may be less important.
To conclude, in recent years, there has been an increasing interest in the epidemiology of multimorbidity internationally. This review finds that population characteristics and measurement content are the major factors that influenced prevalence estimates of multimorbidity. Studies with older populations and larger numbers of conditions yielded a higher estimate of multimorbidity prevalence. However, heterogeneity between studies has made comparison of multimorbidity prevalence across studies difficult. To improve comparability and quality of reporting, this review suggests that future studies should use common core condition set for the measurement of multimorbidity and clearly report the prevalence of multimorbidity stratified by sociodemographics.
Data availability statement
All data relevant to the study are included in the article or uploaded as supplementary information.
Ethics statements
Patient consent for publication
Ethics approval
Not applicable.
References
Supplementary materials
Supplementary Data
This web only file has been produced by the BMJ Publishing Group from an electronic file supplied by the author(s) and has not been edited for content.
Footnotes
Twitter @multimorbidity1, @AshleyAkbari
Contributors CMcC, KN, UK, KK, RL, JD, AA, AA-L and SWM were involved in conception of the work, acquisition of funding and critically commenting on the manuscript. IS-SH led and BG substantially contributed to the design, analysis and interpretation of data for the review, and are responsible for the decision to submit the manuscript. IS-SH and PH screened and reviewed retrieved studies. All authors contributed to the edits of the manuscript and had access to the data. The final draft has been approved by all authors. The guarantor (IS-SH) accepts full responsibility for the finished work and/or the conduct of the study, had access to the data, and controlled the decision to publish.
Funding This study was funded by Health Data Research UK (CFC0110).
Map disclaimer The inclusion of any map (including the depiction of any boundaries therein), or of any geographic or locational reference, does not imply the expression of any opinion whatsoever on the part of BMJ concerning the legal status of any country, territory, jurisdiction or area or of its authorities. Any such expression remains solely that of the relevant source and is not endorsed by BMJ. Maps are provided without any warranty of any kind, either express or implied.
Competing interests None declared.
Patient and public involvement Patients and/or the public were not involved in the design, or conduct, or reporting, or dissemination plans of this research.
Provenance and peer review Not commissioned; externally peer reviewed.
Supplemental material This content has been supplied by the author(s). It has not been vetted by BMJ Publishing Group Limited (BMJ) and may not have been peer-reviewed. Any opinions or recommendations discussed are solely those of the author(s) and are not endorsed by BMJ. BMJ disclaims all liability and responsibility arising from any reliance placed on the content. Where the content includes any translated material, BMJ does not warrant the accuracy and reliability of the translations (including but not limited to local regulations, clinical guidelines, terminology, drug names and drug dosages), and is not responsible for any error and/or omissions arising from translation and adaptation or otherwise.