Article Text

Abstract
Objectives This study aims to find if the incidence and pattern of traumatic brain injury (TBI) changed during the COVID-19pandemic. We also aim to build an explanatory model for change in TBI incidence using Google community mobility and alcohol sales data.
Design A retrospective time-series analysis.
Setting Emergency department of a tertiary level hospital located in a metropolitan city of southern India. This centre is dedicated to neurological, neurosurgical and psychiatric care.
Participants Daily counts of TBI patients seen between 1 December 2019 and 3 January 2021 (400 days); n=8893. To compare the profile of TBI cases seen before and during the pandemic, a subset of these cases seen between 1 December 2019 and 31 July 2020 (244 days), n=5259, are studied in detail.
Results An optimal changepoint is detected on 20 March 2020 following which the mean number of TBI cases seen every day has decreased and variance has increased (mean 1=29.4, variance 1=50.1; mean 2=19.5, variance 2=59.7, loglikelihood ratio test: χ2=130, df=1, p<0.001). Two principal components of community mobility, alcohol sales and weekday explain the change in the number of TBI cases (pseudo R2=58.1). A significant decrease in traffic accidents, falls, mild/moderate injuries and, an increase in assault and severe injuries is seen during the pandemic period.
Conclusions Decongestion of roads and regulation of alcohol sales can decrease TBI occurrence substantially. An increase in violent trauma during lockdown needs further research in the light of domestic violence. Acute care facilities for TBI should be maintained even during a strict lockdown as the proportion of severe TBI requiring admission increases.
- COVID-19
- accident & emergency medicine
- epidemiology
- substance misuse
- public health
- neurosurgery
Data availability statement
Data are available in a public, open access repository. Deidentified data sets and analysis scripts are available in public repository at: https://doi.org/10.6084/m9.figshare.17170943.v1.
This is an open access article distributed in accordance with the Creative Commons Attribution Non Commercial (CC BY-NC 4.0) license, which permits others to distribute, remix, adapt, build upon this work non-commercially, and license their derivative works on different terms, provided the original work is properly cited, appropriate credit is given, any changes made indicated, and the use is non-commercial. See: http://creativecommons.org/licenses/by-nc/4.0/.
Statistics from Altmetric.com
Strengths and limitations of this study
This study uses an entirely empirical, robust statistical model to study the impact of the COVID-19 pandemic on traumatic brain injury (TBI).
Findings from this hospital-based study need cautious generalisation to the community.
A more extended time series could have shed light on seasonal influences on the number of TBI cases.
Another limitation is that only a subset of the entire sample has been studied in detail.
Introduction
Traumatic brain injury (TBI) represents more than one-third of all injury-related deaths. It is the most important cause of neurological disability worldwide.1 The burden of TBI has increased in high and low-income and middle-income countries (LAMICs); for different reasons. In high-income countries, demographic ageing has increased the incidence of falls. In contrast, economic growth and motorisation have increased Road Traffic Accidents’ (RTA) incidence in LAMICs. It must be noted that LAMICs have registered a disproportionate increase in the incidence and prevalence of TBI. Also, there is a lack of useful data from these regions to quantify the modifiable risk factors responsible for this increase.1 2
India contributes about a quarter of deaths due to trauma and 21% of new TBI cases globally.2 3 Over-speeding, driving under the influence of alcohol (DUI), faulty vehicles and adverse weather/road conditions are some of the modifiable determinants of TBI due to RTA.4 However, it is not known how much each of these factors contributes to the incidence of RTA-related TBI. For example, DUI is reported in as low as 2% to as high as one-third of RTAs.5 Evidence-based policies to decrease RTAs are needed to realise sustainable development goal number 3.6, to halve the global number of RTA deaths and injuries. In this context, interventions that demonstrate effectiveness in decreasing TBI in India can inform other LAMICs’ policies.
A natural experiment using a major external shock like an epidemic can estimate the effects of policy changes that decrease the exposure of a whole population to risk factors.6 For example, while it may be unpragmatic to halt the increasing motorisation in LAMICs or to expect complete alcohol prohibition, it is still helpful to know what proportion of TBI cases are preventable by policy changes that target these risk factors.
In this study, we have used the COVID-19 pandemic as an external shock to study the epidemiology of TBI. A statistically significant decrease in TBI incidence is reported from Tyrol, Netherlands,7 8 and India9 10 during the COVID-19 pandemic. These reported studies have compared the mean number of cases seen during the COVID-19 pandemic and a corresponding period before COVID-19. The comparison of pre–post aggregates disregards secular trends. It assumes that we already know the exact date when the COVID-19 pandemic altered TBI incidence.11 We can improve this evidence by first empirically establishing when TBI incidence changed (if it did) and including explanatory variables that explain this change.5
India reported the first case of COVID-19 on 30 January 2020 and underwent varying levels of lockdown during the rest of the year. In the current manuscript, we aim to use the retrospective data from this period to answer the following questions. Did the incidence of TBI change substantially during the COVID-19 pandemic? What are the primary reasons for this change, and did the profile of patients change during this period? We hypothesise that changes in vehicular traffic and alcohol sales will explain a change in TBI incidence.
Methodology
Data sources
We have used three data sources. Figure 1 shows the availability of these sources.

Sources of data used in the study and their availability. TBI, traumatic brain injury
Clinical data
We have used the Emergency Department (ED) records of the National Institute of Mental Health and Neurosciences (NIMHANS) situated in Bangalore. NIMHANS is a dedicated centre for neurological, neurosurgical and psychiatric clinical services. The neurosurgery team receives TBI cases brought directly to our ED and cases referred from other hospitals. In the year 2019, we received 12 352 cases of TBI. Bangalore is a metropolitan city with an estimated population of 12.3 million. It is the capital of the southern state of Karnataka. Bangalore is divided into rural and urban administrative districts with 2298 and 2196 square kilometres of area.
We have included the number of TBI cases received in the ED between 1 December 2019 and 3 January 2021 (400 days). For cases seen between 1 December 2019 and 31 July 2020 (244 days), we have also collated deidentified records of sociodemographic information (age, gender, residence—rural or urban), circumstance of injury (fall, assault, road accident and others), compliance with safety regulations like seatbelts and helmets (for RTA), Glasgow Coma Scale score and clinical severity of injury (mild: ED care only, moderate: inpatient care for up to 6 hours or severe: inpatient treatment for more than 6 hours). Doctors in ED record these data during patient’s treatment. Sociodemographic information, the circumstance of injury and compliance with safety regulations are recorded based on self-report, information given by attenders and good Samaritans and first responders’ records. The attending neurosurgeon records the Glasgow coma scale score and clinical severity of the injury. We have separately analysed the counts of cases declared ‘dead on arrival’ for the corresponding period. The presence or absence of head injury in these cases cannot be ascertained with certainty. Thus they are not included in the primary analysis.
This study has been reviewed by the institute ethics committee and received a waiver on 9 October 2020.
Community mobility data
We have used Google Mobility Report data as a proxy of road traffic volume.12 A detailed description of this data set is available online.13 Briefly, this data set uses mobile location data to estimate a ‘headline number’ for six categories of places—recreation/retail, transit stations, parks, pharmacy/grocery, workplaces and residential areas. The headline number is the percentage change in mobility at a given category of place for a given date compared with the usual mobility in that category adjusted for the day of the week. The ‘usual mobility’ is the median value for 5 weeks, that is, 3 January to 6 February 2020. The data are available from 15 February 2020 to 3 January 2021 (324 days) separately for Bangalore urban and rural areas (total 12 variables). Since the 12 mobility estimates are highly correlated, we have done a principal component analysis (PCA) to derive uncorrelated measures. There were 12 missing values for pharmacy/grocery in the rural area. The PCA is done accounting for these missing values using the ‘missMDA’ R package.14
The first two principal components account for 74% and 15% of the variance in this data set. They are used as predictor variables in further analysis. The correlation between different mobility types and their contribution to the principal components is shown in tables 1 and 2.
Correlation between six types of community mobility in rural (R) and urban (U) areas of Bangalore and the two principal components (PC1 and PC2)†
Contribution (in percentage) to the two principal components of six types of community mobility in rural and urban areas of Bangalore*
Alcohol consumption data
We are primarily interested in a measure of daily alcohol exposure for the population residing in Bangalore urban and rural areas. However, there is no source for this data, and therefore a proxy is used as follows. We use the daily sales data from the records of Karnataka State Beverage Corporation Limited (KSBCL). KSBCL is the sole agency which supplies alcoholic beverages to vendors across the state of Karnataka (www.ksbcl.com). For Bangalore, the supply chain is—24 KSBCL depots (7 rural and 17 urban) supply alcoholic beverages to vendors who sell them to consumers. KSBCL reports the total units of Indian Manufactured Liquor (alcohol by volume=42.8 %) and beer sold by each depot for a given day. Since KSBCL does not sell alcohol directly to consumers, the recorded sales are a lagged indicator of population exposure as long as the supply chain is maintained. Considering this peculiarity, we have used the summary of liquor and beer sold in the preceding 7 days (to account for the weekday effect in sales) to indicate population exposure.
A further adjustment is needed whenever the supply chain breaks due to the government-ordered prohibition of sales. There were two periods of prohibition; the first of 44 days between 21 March 2020 and 3 May 2020 and the second of 6 days between 15 July 2020 and 21 July 2020. The population exposure during these periods is set to zero as no sales were allowed. For a week after the first period and for 2 days after the second period, the reported figures do not accurately represent population exposure as vendors were clearing stocks that were lying with them. Therefore, the population exposure for these days is set to the median value for the whole period. These changes in raw data are documented in online supplemental table 1. These modelling decisions are checked in a sensitivity analysis.
Supplemental material
Statistical analyses
We have used a Generalised Additive Model for Location, Scale and Shape (GAMLSS) framework to fit a count time series model.15 Graphical analysis of the time series indicates a bimodal, over-dispersed and seasonal (weekday effect) pattern; thus, a double Poisson distribution with weekday as a predictor for mean and variance is chosen as the base model.
Changepoint analysis
A change-point analysis in time series involves detecting abrupt changes in time-series (mean or/and variance). Briefly, we fit new models, including a change point shifted along with the time range, and compare it against the base model with the Akaike Information Criterion (AIC) and likelihood ratio test.16 Timepoint with minimal AIC and maximum test statistic (χ2) indicates when the TBI incidence changed significantly.
Modelling change in the incidence of TBI
The full model is fit on a subset for which mobility data are available from 15 February 2020 to 3 January 2021 (324 days). Four variables are available as predictors—alcohol sales, the first and second principal components of community mobility and weekday. We have used the stepGAICAll function of the GAMLSS package for principled variable selection.15 First, a model for the mean (mu) using forward selection is built; once the best subset of predictors is identified for mean, the forward selection is used to build a model for variance (sigma). Then, backward elimination is done for the mean to identify the final model.17
Regression diagnostics are done using normalised quantile residuals. Graphical analysis using quantile–quantile (Q–Q) plots and detrended plots (worm plots) at different levels of predictors is done to evaluate the model fit.18
Marginal effects of the covariates are derived using model predictions after fixing other covariates. No extrapolation is involved, and only values in the observed range are used for these simulations.
Statistical inference is performed using bootstrapped CIs. Simulated samples (n=1500) are created by resampling from the original data; the model is refit and estimates are extracted.19 The 95% uncertainty interval (CI for regression coefficients and prediction intervals for marginal effects) are calculated using the bias-corrected acceleration method.20
Sensitivity analysis
We have refit the model using the originally reported sales values for periods of prohibition and reported the change in estimates.
Change in the profile of cases
We have compared the clinical characteristics of patients seen before and after the empirically derived changepoint. Overall, there are seven comparisons, and thus a Bonferroni corrected p-value of 0.007 is considered the threshold. For categorical tests, if the overall χ2 test is significant, a comparison of proportions is made, and the p-value is appropriately corrected for multiple comparisons.
All analyses are conducted in R software 4.0.3 on an ubuntu machine with 64 cores. The data set and analyses scripts are shared with this article (data set).21
Patient and public involvement
Due to the nature of the study, there is no patient or public involvement in this research.
Results
Changepoint analysis
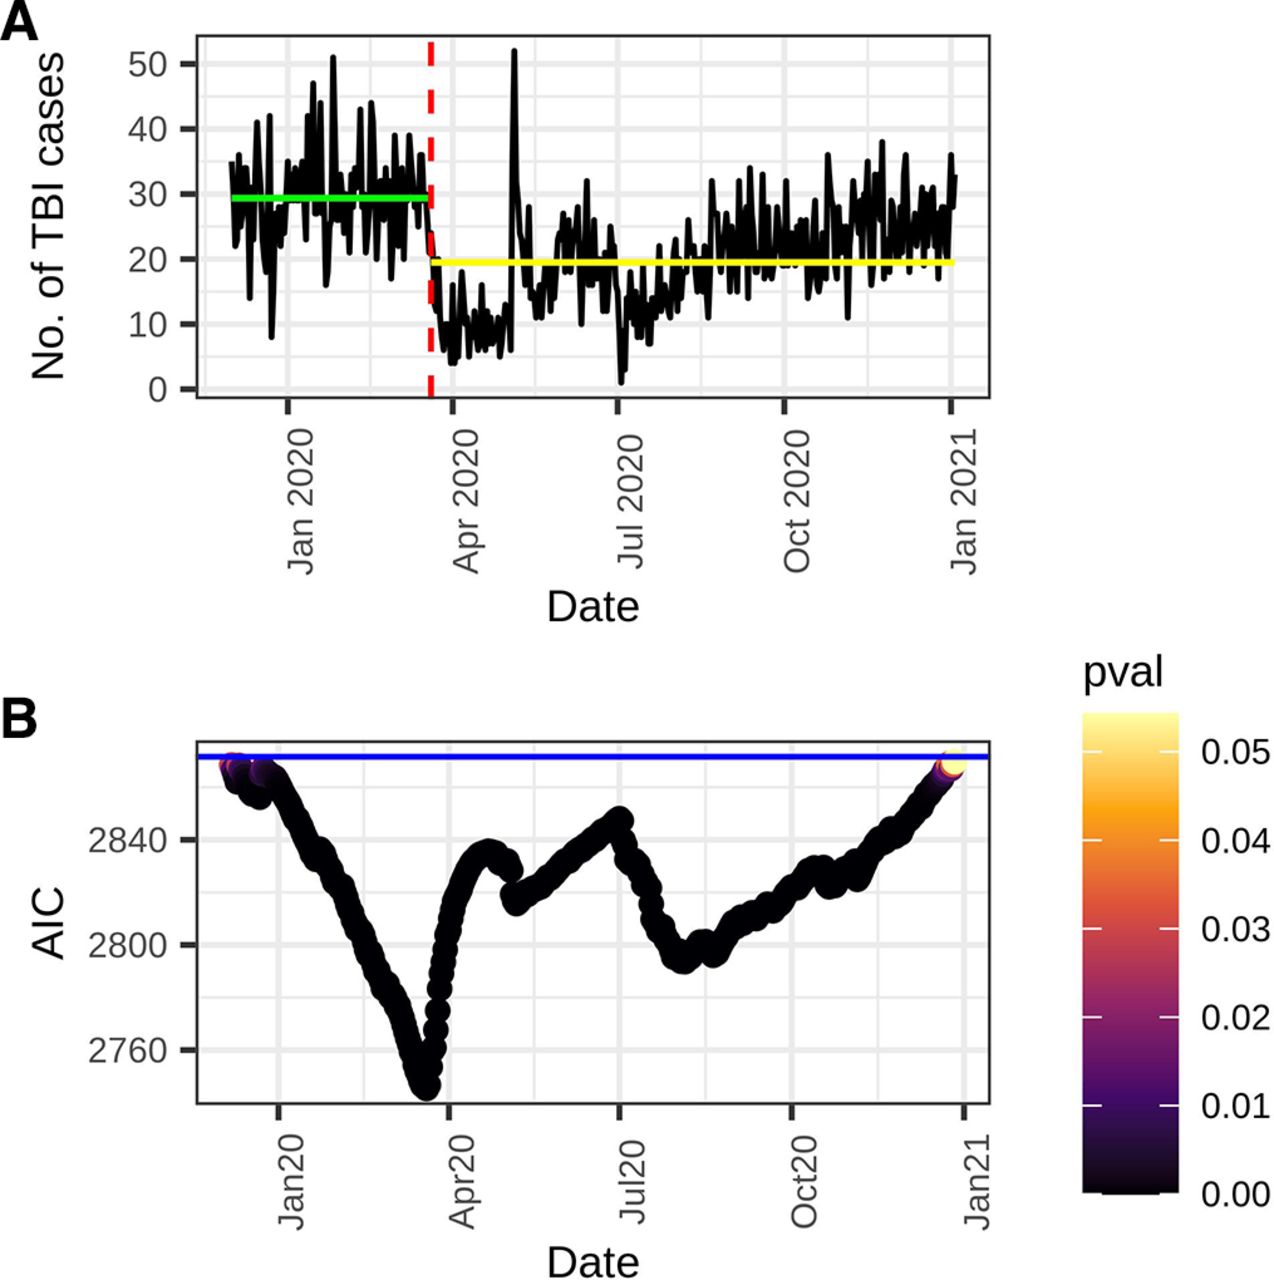
A changepoint on date 20 March 2020 best describes the 400-day time series (Loglikelihood Ratio Test: χ2=130, df=1, p<0.001). Figure 2 shows that all models with a changepoint are better than the base model; however, there is only one minimum for AIC. The mean number of TBI cases seen between 1 December 2019 and 20 March 2020, that is, in segment one, is 29.4 with a variance of 50.1, while between 21 March 2020 and 3 January 2021 (segment 2), mean is 19.5, and variance is 59.7.

Number of traumatic brain injury (TBI) cases per day seen in the emergency department between 1 December 2019 and 3 January 2021 (a) and a changepoint analysis (b).
Pandemic-related restrictions during this period are as follows: (a) there were no restrictions prior to 21 March 2020, (b) strict restrictions between 21 March 2020 and 3 May 2020, (c) less strict restrictions between 4 May 2020 and 14 July 2020, (d) Karnataka state had a second strict lockdown between 15 July 2020 and 21 July 2020 and finally, (e) minimal restrictions after 21 July 2020. The mean and variance of the number of TBI cases in these periods are 29.3 (7), 9.9 (4), 18.6 (7.7), 12 (4.3) and 22.8 (6), respectively. It must be noted that the Karnataka state government ordered another lockdown between 15 July 2020 and 21 July 2020 to curb the spread of the virus. There was complete alcohol prohibition and restriction on the hours during which vehicles could ply on the roads during this period.
A comparison of number of ‘dead on arrival’ cases between the two periods shows no significant change (χ2=0.54, df=1, p=0.5).
Model for change in TBI incidence
Stepwise modelling shows that weekday effect, alcohol sales and the two principal components of community mobility explain 58% of the variance in the number of TBI cases. Table 3 shows the relative contribution of these terms and the final model.
Model to explain the change in the number of traumatic brain injury cases seen per day between 15 February 2020 and 3 January 2021*
Alcohol sales and community mobility adequately explain the observed changepoint, evidenced by an increase in AIC (2027 to 2029) and a non-significant likelihood ratio test (χ2=0.29, df=1, p=0.6) when a changepoint is added to this model.
The bivariate correlation coefficients of types and location of mobility12 and the total number of TBI cases are reported in online supplemental table 2.
Randomised quantile residuals from the model are normally distributed (mean=0, variance=1.001, skewness=0.1, kurtosis=3.07) and have a high Filliben Correlation Coefficient of 0.99 with an expected normal distribution. The worm plots indicate satisfactory fit at different levels of predictor variables (online supplemental figures 1–3). There are two extreme outliers (z score>3), one on 5 May 2020 when alcohol sales restarted along with a relative relaxation in mobility restriction. There were 52 TBI cases on this day which is the maximum in this time series. Another outlier is on 3 July 2020 when only one TBI case was seen.
Supplemental material
Bootstrap analysis (n=1500) shows a significant relationship between the number of TBI cases per day and alcohol sales and the first principal component of community mobility but not with the second component (table 4).
Regression model of the number of traumatic brain injury cases seen per day between 15 February 2020 and 3 January 2021
Figure 3A,B show the marginal effects, that is, the expected number of TBI cases as a function of alcohol sales and community mobility (first principal component).

Marginal effects of alcohol sales (a) and community mobility (b) on the number of cases of TBI (black line) and associated 95% prediction intervals (grey bands). TBI, traumatic brain injury.
Sensitivity analysis
This model is sensitive to the alcohol sales values during prohibition and immediately after it (see section 3.1.3). If we do not correct these artefactual figures, the association between alcohol sales and TBI is not significant (estimate=1.0003, bootstrap 95 % CI=0.99 to 1.0004). This model’s residuals deviate substantially from a normal distribution with long tails (coefficient of kurtosis=4.22, skewness=0.22) (online supplemental figure 4). Worm plots show many residuals beyond the 95% confidence band. The curve origin is above 0, and it has a negative slope indicating underestimation of mean and overestimation of dispersion, respectively (online supplemental figure 5).
Change in the profile of TBI cases
Comparison of cases that presented between 1 December 2019 to 2020 March 2020 (n=3232) with cases that were seen between 21 March 2020 to 31 July 2020 (n=2027) shows that mode and severity of the injury and reported use of helmet/seat belt (for RTAs) is significantly different. On the other hand, gender, age, residence (rural/urban) and GCS scores are not different between the two groups of patients. Online supplemental table 3 reports these comparisons.
The proportion of RTAs (P1=0.592 and P2=0.544) and falls (P1=0.237 and P2=0.196) have decreased significantly (p<0.001 and p<0.001, respectively, multiple comparison corrected threshold=0.01), while proportion of assault (P1=0.06 and P2=0.09) has increased (p<0.001). Similarly, the proportion of mild injuries (P1=0.697, P2=0.564) have decreased, while moderate (P1=0.259, P2=0.367) and severe injuries (P1=0.041, P2=0.064) have increased significantly (p<0.001, p<0.001 and p<0.001, multiple comparison corrected threshold=0.01). Comparison between the RTA cases seen in the two periods (N1=1911, N2=1103) reveals a higher compliance with safety measures in the second period (P1=0.12 and P2=0.18, p<0.001).
Discussion
The usual or endemic frequency of injuries is maintained by processes that change slowly, for example, motorisation, public behaviour and population-level alcohol exposure. Furthermore, the number of injuries can have a wide variation due to seasonal factors or random fluctuations. It is difficult to separate signal (effect of determinants) from noise in such a scenario. Thus, abrupt policy changes like lockdown or alcohol prohibition provide a valuable research opportunity.
We report a significant decrease in the number of TBI cases seen in the ED of a neuropsychiatric hospital during the pandemic. This finding agrees with reports from some European countries22 and other parts of India.9 Furthermore, a decrease in community mobility and alcohol sales prohibition can explain this change. The empirically derived date of this change is 20 March 2020. On the evening of 21 March, Karnataka announced a lockdown and prohibition of alcohol sales for 2 days. On 24 March, the whole country entered a lockdown which lasted till 3 May. We must entertain other plausible explanations and acknowledge the limitations of this analysis before discussing these findings’ implications.
This study uses retrospective data from a single hospital with an undefined catchment area (the population it serves); therefore, we cannot interpret these findings as TBI incidence. The number of patients attending the ED of a hospital can change if new facilities open or if patients change their preference for some reason. However, to the best of our knowledge, no new acute care facilities opened in the city during this period. Furthermore, many public health facilities were earmarked for COVID-19 patients; thus, we must have seen an increase rather than a decrease in the number of cases. We have reported an increase in delirium tremens cases during the same period.23 Thus, we do not think that patient preference or change in the availability of options is responsible for decreasing TBI cases during the COVID-19 pandemic. A more sinister cause of decreased ED attendance is if patients avoid help-seeking for supposedly minor injuries due to fear of infection or mobility restrictions. For example, in the early phase of the pandemic, there was a reduction in the number of myocardial infarction cases seen in ED of various countries and possibly increased unattended coronary events.24 We believe, to some extent, this has contributed to the decreased numbers of TBI cases in our setting as well. Although we have not seen a significant increase in the number of dead-on-arrival cases, the change in clinical profile is telling. During the pandemic, the proportion of mild and moderate cases decreased, while severe cases increased. Patients who perceived their injuries to be minor may have avoided a visit to ED.
Another limitation of this study is the use of alcohol sales data from the wholesaler (KSBCL) rather than the vendors. The rules controlling alcohol sales in Karnataka allow vendors to buy only from KSBCL and restrict the number of alcoholic beverages vendors can stock on their premises. As a result, there is a lagged but strong concordance between vendors buying from a wholesaler and selling it to the public in usual circumstances. Sudden prohibition disrupts this concordance, and therefore we have to adjust the sales figures reasonably. For example, in the first week of May 2020, when alcohol vends opened after 44 days, there were long queues and record sales.25 However, since vendors were selling their stocks, the wholesaler reported sales were minimal. Also, there will be higher than usual unrecorded alcohol consumption during prohibition. We have no way to include it in this analysis.
Another limitation is the use of community mobility data as a proxy for traffic volume. Community mobility reports by Google are a measure of change in mobility from baseline rather than an absolute value. Furthermore, community mobility data may capture other factors that determine head injury, such as construction activity. Our data show that both RTAs and falls have also decreased during this period. Nevertheless, we must note that most TBI cases in both periods consist of RTA. Thus, a decrease in absolute numbers could not have occurred without a decrease in RTA leading to TBI. Also, the predictor variable has maximum contributions from the change in community mobility at retail/recreation, parks and transit stations. Therefore, we consider it a reasonable proxy for traffic in general.
We note that a robust time-series analysis should include at least 2–3 years of data to quantify monthly/weather-related trends. However, the weather conditions in Bangalore are not marked by snow or fog. Thus, we do not think a seasonal influence has played a significant role in our findings. Finally, we acknowledge that in a retrospective study, there will be unknown and unmeasured confounders.
Keeping in mind the above limitations, we discuss the implications of our findings for public health policy to decrease TBI incidence and plan ED services during further pandemic waves.
A change in community mobility explains approximately 44% of the change in TBI cases. There is a 0.3% increase in TBI cases for each unit increase in the value of the first principal component of community mobility. We must note that the relationship between traffic volumes and RTA can be a ‘U-shaped’ curve,26 such that extreme congestion and sparse traffic can lead to RTAs. However, in this brief period, the decongestion of roads has decreased the RTA occurrence. An increased presence of police may have led to higher compliance with safety regulations during this period. Thus, stricter enforcement of traffic safety regulations should be an essential part of decreasing TBI incidence. Furthermore, in 2019 Bangalore was reported as the city with the highest traffic congestion globally; in 2020, it is at the sixth position.27 Therefore, serious planning efforts to decrease traffic congestion are required to control RTA and TBI incidence.
Analysis shows that alcohol sales are also a significant predictor of the number of TBI cases. For an increase in alcohol sales by 1000 units, there is a 0.07% increase in TBI cases. Based on ED data from 26 countries, approximately 15% of injuries worldwide (17% in India) can be attributed to alcohol use.28 TBI due to RTA and assaults form the majority of this preventable morbidity and mortality. Governments worldwide faced the question of alcohol sales during the lockdown and made widely different choices. While some countries like Canada deemed alcohol an ‘essential commodity’, others like India and South Africa imposed a complete prohibition. The medical community has analysed and critiqued these decisions (see Stockwell et al and commentaries29). For example, in an informal analysis, Stockwell et al contend that in South Africa, more lives were saved due to a decrease in traumatic injuries following prohibition than lost to COVID-19.29 Our findings partly agree with this contention; we found evidence of decreased TBI associated with prohibition, but this association’s magnitude is not as high. However, we note that TBI is associated with a high risk of mortality or prolonged disability. Thus, any intervention that can decrease the incidence will have a substantial public health benefit. A vastly helpful public health intervention would be the mandatory recording of alcohol use in all trauma and injury cases. A WHO study found substantial barriers to generating this vital data in developing countries.30 Evidence shows that strict DUI checks, decreasing the density of alcohol outlets and delivering brief intervention services in ED can decrease alcohol-associated injuries.31
Interestingly, we see a change in TBI numbers immediately following prohibition indicating that alcohol consumption in our setting is tightly dependent on everyday sales. We have earlier reported an increase in severe alcohol withdrawal cases even with two to 2–3 days of prohibition.32 Therefore, policies that restrict the timing and days of sales can be expected to yield immediate benefits.
There was an increase in the proportion of TBI due to assault during the period of lockdown. Community mobility reports show that more people were spending more time at home than earlier. News items quoting data from relevant services like legal aid and helplines indicate a dramatic increase in domestic violence during the lockdown.33 We believe this phenomenon is critical for LAMICs and must be empirically studied. The findings of such research will be helpful in a risk–benefit analysis of work from home policies and future decisions regarding lockdown.
Our findings also have implications for planning and staffing ED during further waves of pandemics and lockdown. While the number of TBI cases may decrease during periods of restricted mobility, the proportion of cases that require inpatient care will increase. Thus, facilities for COVID-19 testing of patients without respiratory symptoms, beds for admissions and operation theatres must be maintained even during periods of strict lockdown.
Data availability statement
Data are available in a public, open access repository. Deidentified data sets and analysis scripts are available in public repository at: https://doi.org/10.6084/m9.figshare.17170943.v1.
Ethics statements
Patient consent for publication
References
Supplementary materials
Supplementary Data
This web only file has been produced by the BMJ Publishing Group from an electronic file supplied by the author(s) and has not been edited for content.
Footnotes
BMR and BID are joint first authors.
Contributors BMR and BID contributed equally to the planning of methodology, data collection, analysis and results drafting. DPS, LS, MJ and PM have substantial contributions to data analysis and interpretation of the results. DJ, KP and AK have contributed to the interpretation and critical revisions of the results. All authors have approved the final manuscript and are accountable for the work. LS shall act as the gurantor for this work.
Funding The authors have not declared a specific grant for this research from any funding agency in the public, commercial or not-for-profit sectors.
Competing interests None declared.
Patient and public involvement Patients and/or the public were not involved in the design, or conduct, or reporting or dissemination plans of this research.
Provenance and peer review Not commissioned; externally peer reviewed.
Supplemental material This content has been supplied by the author(s). It has not been vetted by BMJ Publishing Group Limited (BMJ) and may not have been peer-reviewed. Any opinions or recommendations discussed are solely those of the author(s) and are not endorsed by BMJ. BMJ disclaims all liability and responsibility arising from any reliance placed on the content. Where the content includes any translated material, BMJ does not warrant the accuracy and reliability of the translations (including but not limited to local regulations, clinical guidelines, terminology, drug names and drug dosages), and is not responsible for any error and/or omissions arising from translation and adaptation or otherwise.