Article Text

Abstract
Objective To identify what dimensions of socioeconomic position (SEP) are most closely associated with childhood obesity in Finland, leveraging population-wide data among the whole child population aged 2–17 years in Finland.
Design Registry-based study.
Setting Data from several administrative registries linked on individual level covering the whole of Finland were used. Data on height and weight measurements in 2018 were obtained from the Register of Primary Health Care visits and data on sociodemographic and socioeconomic indicators (2014–2018) from Statistics Finland.
Participants Children aged 2–17 years with valid height and weight measurements performed at the child health clinic or school healthcare in 2018 (final n=194 423).
Main outcome measures Obesity was defined according to WHO Growth Reference curves. Sociodemographic and socioeconomic indicators were linked on individual level for adults (both parents) who lived in the same household (42 predictors). Boosted regression model was used to analyse the contribution of SEP to obesity.
Results From socioeconomic indicators, annual household income (12.6%) and mother and father’s educational level (12.6% and 8.1%, respectively) had the highest relative influence on obesity risk. The relative influence of a child’s sex was 7.7%.
Conclusions The parents’ SEP was inversely associated with obesity among the offspring. A remarkable number of objective SEP indicators were analysed with parents’ education and household income finally being the indicators most strongly associated with obesity among children. In future research, more attention should be paid to reliable and objective ways of measuring educational status and income rather than on developing new SEP indicators. Administrative registries with information on both healthcare and socioeconomic indicators can in future provide better opportunities to assess the influence of SEP on various health risks.
- PAEDIATRICS
- PRIMARY CARE
- PUBLIC HEALTH
- SOCIAL MEDICINE
Data availability statement
No data are available.
This is an open access article distributed in accordance with the Creative Commons Attribution Non Commercial (CC BY-NC 4.0) license, which permits others to distribute, remix, adapt, build upon this work non-commercially, and license their derivative works on different terms, provided the original work is properly cited, appropriate credit is given, any changes made indicated, and the use is non-commercial. See: http://creativecommons.org/licenses/by-nc/4.0/.
Statistics from Altmetric.com
STRENGTHS AND LIMITATIONS OF THIS STUDY
The study is based on objective data from standardised height and weight measurements of children and adolescents aged 2–17 years (n=194 423), and on a large set of socioeconomic indicators from population-based Finnish administrative registries.
Height and weight data from the Register of Primary Health Care visits and socioeconomic indicators obtained from Statistics Finland were linked on individual level using the personal identity code.
A large number of objective indicators of socioeconomic position were analysed; altogether, 42 predictors were included in a boosted regression model.
Because of the study setting, self-report bias and selection bias could be virtually avoided.
The imperfect coverage of height and weight data among children aged 2–17 years (40%) is due to challenges in data transfer from different software used in primary healthcare across the country to the national healthcare register.
Introduction
Obesity is a globally growing challenge even among children.1 2 Like most health risk factors, obesity is not evenly distributed in the populations, with socioeconomic status being one of the key determinants influencing its risk. It is observed that in low-income countries high socioeconomic position (SEP) mostly increases the risk of obesity while in high-income countries, the risk is often increased among those with low SEP, with some exceptions.3–8
As SEP is a descriptive term for the position of a person in society, it is dependent on various societal factors. Even though it is commonly classified based on occupational, economic and educational criteria,9 also other factors such as ethnicity, literacy and cultural characteristics are related to SEP.10 Thus, determining SEP and comparisons between populations are challenging.11 12 Even more, regarding children, SEP needs to be designated based on parents or family’s characteristics.12 13 This complicates the operationalisation of childhood SEP as the indicators can be created in various ways using either information related to one or both parents and/or the household as a whole.7 14
Researchers have also identified challenges in collecting reliable socioeconomic data. Socioeconomic data can be collected from different data sources and using different methodology. Information from administrative registries, from questionnaires having self-reported data and information relying on neighbourhood statistics may often be discordant.15 In addition, even the key socioeconomic indicators such as education, occupation and income are not interchangeable and are differently affected by other factors, such as culture, and thus do not necessarily measure the same exposure.11 12 16 17
Income data have been seen to be especially affected by different reporting biases, even more so in low-income settings.18 For income, three main problems with self-reported survey information have been identified: (1) many forms of income exist, and people may not count all of them, which leads to misreporting; (2) income may be considered as sensitive information which may lead to high proportion of item non-response in surveys; and (3) people may be prone to over-report their income (social desirability bias).12 15 19–21
The wide-ranging administrative, population-based registries in Finland and the possibility of linking data on individual level from several registry sources using the personal identity code give possibility to use objective data sources for examining the associations of sociodemographic and socioeconomic characteristics of children and their families and the risk of childhood obesity. Furthermore, the use of administrative registers allows including several SEP indicators in the analyses simultaneously to examine their relative influence. The aim of this study was to analyse the impact of a large set of registry-based indicators of SEP on childhood obesity, based on measured height and weight, among the whole child population aged 2–17 years in Finland. This study was carried out within the framework of the STOP project (http://www.stopchildobesity.eu/).
Materials and methods
Study population
Data of children were achieved from the Register of Primary Health Care visits (Avohilmo) for all children aged 2–17 years who had visited child health clinic or school healthcare between 1 January and 31 December 2018. This registry includes real-time data on healthcare visits and treatments collected from primary healthcare in the public sector. Healthcare visits are regular (at least yearly among 2–15 year-olds and at least once among 16–17 year-olds in high school or vocational school), cover the vast majority of children and include assessment of health and development of children including height and weight measurements.22 23 The measurements at child health clinics and at school healthcare are carried out by trained healthcare professionals using standardised measurement protocols.24 From local and regional electronic health records data on height and weight are transferred electronically to the Register of Primary Health Care visits. Since 2011, the data collection has covered all health centres and municipalities in Finland. Notwithstanding, the coverage of data collection of height and weight of children was approximately 40% in 2018.25
Information extracted for the current study included sex, date of birth and all available height and weight measurements, with measurement date for children aged 2–17 years with a visit in 2018 (n=397 047). To check the measured height and weight values extracted from the Register of Primary Health Care visits, we calculated deviation statistics for height and weight using Finnish growth standard as reference values (relative to weight by sex and height, height by sex and age, body mass index (BMI) by sex and age).26 Height and weight measurements with deviation values outside [−4,4] boundary were excluded. Also, sex and age-specific weight index (ISO-BMI) was calculated based on Finnish growth standard. Height and weight measurements resulting in ISO-BMI≥50 were also excluded. Altogether 1537 children were excluded because no valid height and weight measurements from 2018 were not available. As a result, the number of children who were 2–17 years of age in 2018 and had at least one valid height and weight measurement in 2018 was 395 510.
Socioeconomic indicators
Socioeconomic indicators were obtained from Statistics Finland for adults (both parents) who lived in the same household with a child covering years 2014–2018, and linked on individual level to the height and weight data of children using deterministic record linkage and personal identification code. An extensive amount of information related to SEP was extracted from the registries including parents’ age, native language, country of birth, marital status, classification of socioeconomic group, educational level of highest qualification/degree, educational field of highest qualification/degree, occupational status, employed/unemployed, code of occupation, size of family, size of household-dwelling unit, number of children in the family and information whether there are children under 3, 7, 14 and 18 years old in the family, family type, municipality group of municipality of domicile according to the 2016 regional division, region according to the 2016 regional division, mode of housing, living space, annual household’s disposable money income (without equalising according to household size), earned total income in state taxation, total capital income, housing benefits and debts in total. Data on SEP of parents were used from year 2017. If this information was missing, it was imputed using data from years 2014–2016 and/or from year 2018. In addition, for adolescents aged ≥16 years, the type of their current education was obtained: (a) adolescent in high school and (b) adolescent in vocational school.
Many variables related to SEP had several categories. Based on logistic regression analyses on binary obesity outcome, some parental multinomial categorical variables were classified into fewer classes: region (from 19 to 4 categories), occupational status (from 8 to 3 categories), educational field of highest qualification/degree (from 12 to 4 categories for fathers and to 3 categories for mothers) and classification of socioeconomic group for mother/father (from 19 to 5 categories for fathers and to 4 categories for mothers, occupational code from 11 to 5 categories) (see online supplemental table S1 for categorisation of variables included in the final model). Variables like age, income, size of family, etc were kept in the analyses as continuous variables. Additional dichotomous indicators informing whether each parent was living in the same household as the child were created using the addresses of a child and parents: (1) proportion of households with mother and (2) proportion of households with father.
Supplemental material
Children with missing data on SEP from Statistics Finland were excluded (n=7887). Also, siblings and children having either same mother or father as well as children with two male or two female adults in the household were excluded (n=193 200), so each parent was only once in the data as well as only one child of each family to guarantee that each adult–child pair was independent of each other. The number of families with two male or two female adults was 374. The final data included 194 423 children. The used variables and their distributions are presented in table 1.
Subject characteristics
Definition of obesity
For the analyses, obesity was defined according to WHO Growth Reference curves.27 28 For children under 5 years of age the definition for obesity is weight for height greater than 3 SDs above WHO Child Growth Standards median, and for children over 5 years greater than 2 SDs above the WHO Growth Reference median.
Statistical analyses
Most of the categorical predictor variables on SEP were imputed using values from previous years. In case no previous individual data were available, data from 2018 were used. Adolescents’ own education was imputed using values from the previous year. For continuous predictors, individual trends were fitted and used for prediction of missing values. For continuous predictor data with only one observation, one trend line was fitted and used for prediction of missing values.
The analyses were carried out using randomly selected modelling data: training data (n=155 479) and validation data (n=38 944; 20% of the training data).
A machine learning model, boosted regression model, was used to analyse the contribution of parents' and family’s socioeconomic characteristics to children’s obesity defined as a binary variable.29 The analyses were carried out with R-package Generalized Boosted Regression Models (GBM). GBM was run using 10-fold cross-validation, that is, automatically selecting test data for every 10-fold which was specified as 20% random sample of the training data set. Finally, overfitting was avoided by using the so-called early stopping rule, which means that an optimal number of ensemble models were chosen by the GBM program.
For model performance evaluation, deviance and relative influences of predictors were used, and area under the receiver operating characteristic curve (AUC) and percentage of model deviance explained (pseudo-R2) were calculated. Based on cross-validation, AUC and deviance values were expected to have very small differences between the training and validation data sets. Also, model performance of the GBM model in the excluded data set was evaluated.
Logistic regression approximation of boosted regression prediction was used to calculate contributions of predictors as differences from mean predicted obesity prevalence.
Patient and public involvement
No patients were involved in setting the research question, study design, outcome measures or the conduct of the study. This study is solely based on data from Finnish administrative registries.
Results
Boosted regression modelling and model accuracy evaluation
The full model had 42 predictors included as 73 variables due to splitting of the original multinomial categorical variables into three or more indicator variables. None of the predictors had zero influence. The optimal number of ensemble models was 1530 selected out of the prespecified 2000 models by using a cross-validation method. The final model had 12 predictors as 12 variables, of which none had zero influence and the optimal number of ensemble models was 1237 selected. The AUC of the full model was 0.724 in the validation data set which was 0.025 lower than in the training data set and 0.018 lower than in the excluded data set. In the final model of the validation data set, the AUC was 0.718, which was 0.018 lower than in the training data set (0.003 lower than in the excluded data set). The difference of AUC between the full model and the final model in validation data set was 0.006. The difference between the full and final model AUCs was tested separately in 16 age groups (for ages 2–17) and none of the tests were significant at p=0.001 level.
The difference in AUC by sex was not significant (p=0.108). The AUC was higher for children aged 2–6 years (0.782) than for children aged 7–17 years (0.655) (p<0.0001).
Predicted risk and observed prevalence of childhood obesity
Figure 1 illustrates the predicted risk and the observed prevalence of obesity based on the training data set. The modelling resulted in practically same obesity estimates with the observed prevalences. The risk of being obese was about 1% among children under 5 years of age but increased to 5%–11% among children between 5 and 7 years of age. The risk of being obese was highest among children before puberty being 9.8% among girls and 17.4% among boys. During and after prepuberty and related growth spurt, the risk of being obese declined to about 8% in girls and 12% in boys.
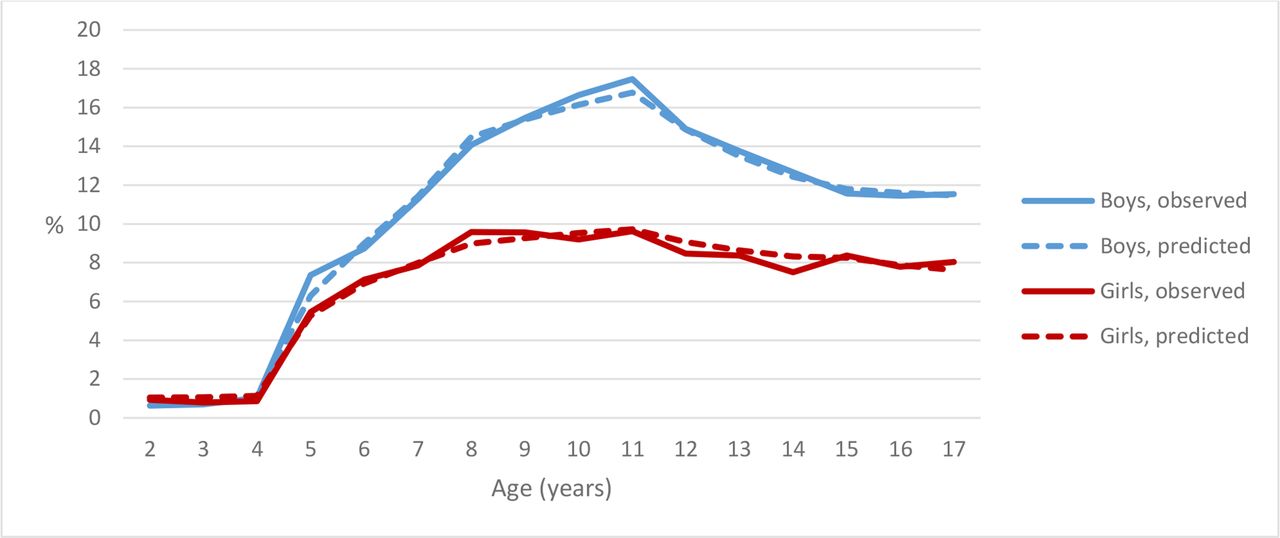
The predicted risk and the observed prevalence of obesity (%) among children according to WHO criteria by sex and age in the large register-based data from Finland in 2018.
Relative influence of predictors on childhood obesity
Table 2 shows the relative influence of the final 12 predictors. The age of the child had the highest relative influence (39.1%) on the risk of being obese. From socioeconomic indicators, annual household income (12.6%) and mother's and father’s educational level of highest degree (12.6% and 8.1%, respectively) had the highest relative influence on obesity risk, with higher risk among the lower household’s disposable money income and educational level groups. Relative influence of child’s sex was 7.7%, the risk being higher among boys. In addition to factors related to education and income, the number of children under 14 years of age in the family, mother's and father’s age, child in high school and municipality class (relative influence 0.9%–5.3%) influenced obesity risk. Two additional variables were included in the model, indicators of mother or father living in the same address, but both had a very low influence on obesity risk (<0.3%).
The relative influence of sociodemographic and socioeconomic indicators on childhood obesity
Based on multivariate logistic approximation, there were three significant interactions when entered separately to the model with all main effects: age of father*annual household income, age of mother*annual household income and age of child*degree of highest education of father. Only one interaction was significant when entered in full final model with main effects and interactions: age of father*annual household income.
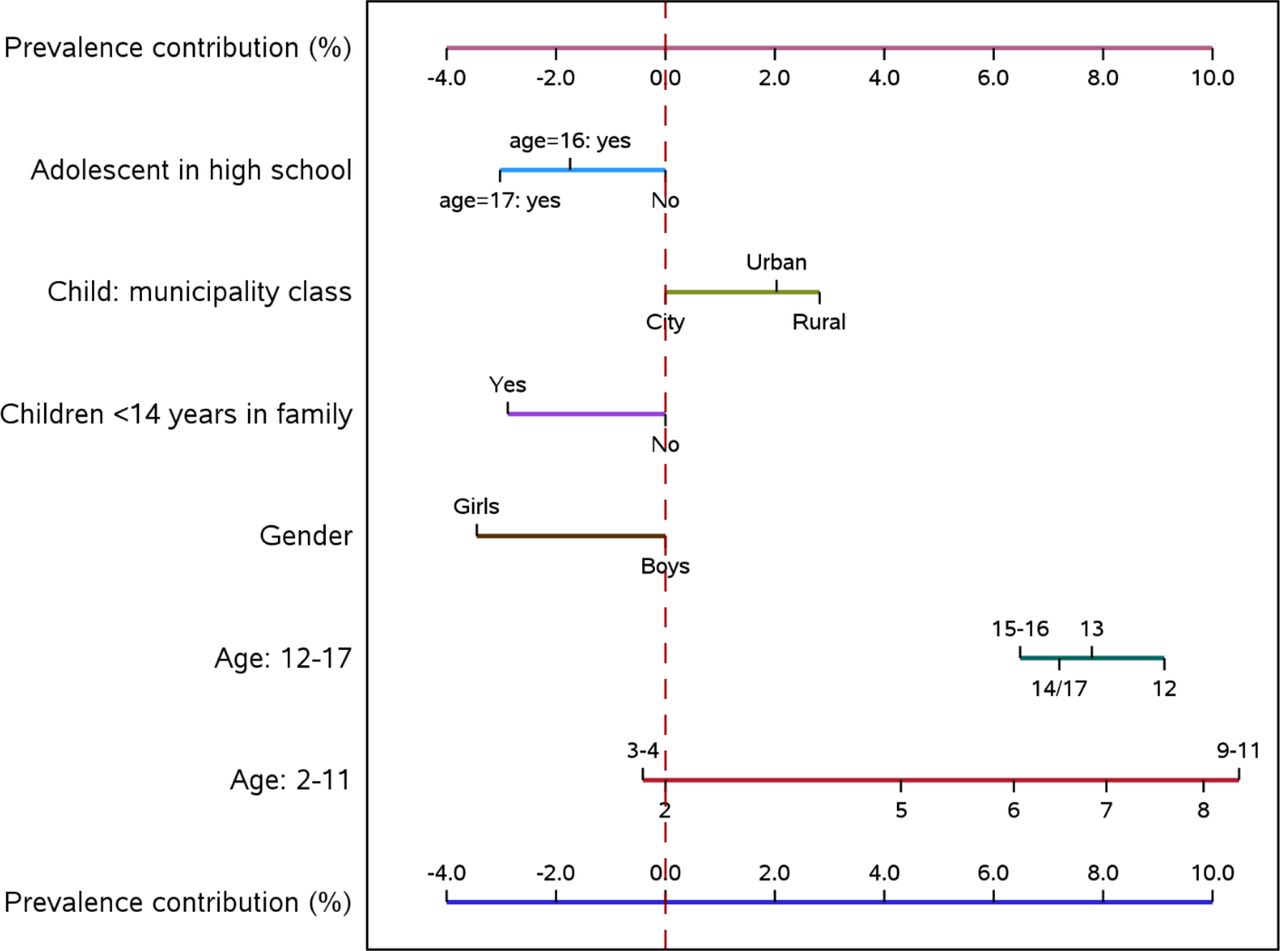
Boosted regression model effects were approximated using multiple logistic regression model for child and family predictor main effects (figure 2) and parental main effects and interaction of father’s age and annual household income (figure 3) excluding variables for mother or father living in the same household.

Contributions of child and family predictors to obesity prevalence (mean prevalence=8.6%).

Contributions of parental predictors and interaction of father’s age and annual household income (mean prevalence=8.6%).Parental education categories: 0=no qualification, 1=vocational education, 2=special vocational education, 3=lowest tertiary, 4=bachelor’s degree, 5=master’s degree, 6=doctoral education. Annual household income categories (€): 1=<30 000; 2=30 000–39 999.99; 3=40 000–59 999.99; 4=60 000–69 999.99; 5=70 000–79 999.99; 6=80 000–99 999.99; 7=≥100 000. When ‘father’s age 35–39’, categories 2 and 3 were recoded into 4, and categories 6 and 7 were combined into 5. When ‘father’s age 30–34’ or ‘father’s age <30’, category 1 was recoded to 2 and categories 5–7 were recoded into 4. When ‘father’s age 40–44’, ‘father’s age 45–49’ or ‘father’s age >49’, category 2 was recoded into 3.
Continuous variables such as annual household income, mother and father’s age and child’s age were included as categorical (see online supplemental table S1 for categorisation). Some of the category effects which were similar on obesity prevalence were combined for graphical representation. Based on logistic regression model, the prevalence was between 0.3% and 34.0% in the used training data set. In the original boosted regression model, the prevalence was between 0.7% and 66.7%. The prevalence >34.0% (516 predictions) can be interpreted as outliers in prevalence prediction distribution.
Figures 2 and 3 represent the contribution of model predictors to obesity prevalence. For example, the mean effect of being a girl in the multivariate model on obesity prevalence is about 3.5% points less than the overall mean obesity prevalence (8.6%) (figure 2). Having a mother aged >39 years has a mean effect, which is about 2% points higher than the overall mean prevalence (figure 3). Five-year-old boys with no younger siblings and parents <30 years of age, living in an urban area, and annual household income over €60 000 with mother’s highest educational qualification of bachelor’s degree and father’s highest educational qualification of master’s degree have 1.5% (=4.5+0+0+0+2–0.5−4−3.5) lower obesity prevalence than an average child. The wider the line for the predictor, the greater the multivariate contribution of a predictor.
The same applies to interaction for father’s age*annual household income, which was categorised to six age groups and to three to six income groups. Children with fathers over 49 years of age have the highest annual household income contribution and children with fathers under 40 years of age (separated into three groups) have the lowest annual household income contribution. Child’s age, mother’s highest educational qualification and annual household income with father’s age over 45 years (separated into two groups) have the highest contribution to children’s obesity prevalence.
Discussion
Our study based on objective data from Finnish administrative registry sources showed that child’s age and sex and his/her parents’ SEP are strong predictors of obesity in childhood. Altogether, 42 registry-based predictors were included in the analyses. Mother’s educational level and annual household income were the two socioeconomic indicators with the highest relative influence on the risk of obesity among the offspring. Childhood obesity was inversely associated with the included SEP indicators, that is, the risk of obesity was higher among children with lower parental SEP. The number of children in our analyses was remarkable (n=194 423) and enabled sophisticated utilisation of statistical methods such as machine learning models.
Finland has a comprehensive public healthcare system and almost all families with children use these services.22 23 The provision of health services, such as health check-ups, is mandatory for municipalities, but services are voluntary and free of charge for families. The coverage is extremely high among children from all socioeconomic groups eliminating the non-response bias commonly seen in survey data.22 In addition to providing an excellent data source, using registry data from health monitoring of children is cost-effective because there are no additional data collection costs. On the other hand, a disadvantage of relying on registry data is that information on behavioural factors, such as on diet or physical activity, is not available. Furthermore, in our study, the data did not allow for accurate inference on the relation of a child and the adults living with the child. As examples, whether the adults of the household were biological parents of a child or whether the family was reconstituted was not known.
The data for the parents and families’ sociodemographic and socioeconomic indicators were obtained from Statistics Finland and included information from several Finnish registries. Data from all included registries were linked on individual level using the personal identity code. Again, such data are much more objective compared with self-reported data and do not suffer from awareness or social desirability bias. Furthermore, individual and household-level SEP indicators used in this study are generally seen as more reliable and less tricky to interpret than area-based indicators, which may underestimate the association between SEP and a health outcome.30 31
Although theoretically the whole child population aged 2–17 years was included, the coverage of height and weight data on Finnish children was only around 40% in 2018.25 The imperfect coverage is due to challenges in data transfer from different software used in primary healthcare across the country to the national healthcare register. Therefore, despite the incomplete geographical coverage, the data were highly representative for different socioeconomic groups and the selection bias is minimal.
The age of a child was the most significant predictor of childhood obesity in our study. A remarkable shift in the prevalence of obesity at the age of 5 was seen. The shift was related to the inherent characteristics of WHO definition of childhood obesity, which is different for children under and over 5 years of age.27 28 The risk of being obese was only about 1% among children under 5 years of age but increased to 5%–11% among children between 5 and 7 years of age. Previous studies have shown differences between various childhood obesity definitions pointing to higher prevalence rates with WHO definition compared with the International Obesity Task Force, and national French, Italian as well as Finnish references.32–34 Therefore, the selection of childhood obesity definition directly affects the resulting prevalences, and the differences between the definitions are important to acknowledge when comparing results from different studies or countries.
Previous studies have suggested that in high-income countries, the parents’ lower SEP is associated with higher risk of childhood obesity, whereas the direction of the association is the opposite in low or middle-income countries.3 4 7 Our results from Finland, a high-income country located in northern Europe, support the earlier research literature with consistent inverse association of parents’ SEP and obesity among the offspring. In our study, both parents’ educational level had an influence on the risk of a child to be obese. However, the association was somewhat stronger for mother’s educational level. In general, mother’s education has been more often used as a SEP indicator in previous studies than that of father’s.7 However, previous studies also point to slightly stronger association between mothers’ educational level and obesity among children compared with that of fathers’.7 In our data, the proportion of missing values for educational level was higher among fathers than mothers, which may have resulted in somewhat less accurate or attenuated estimates regarding the association of fathers’ educational level and obesity among the children.
In our data among Finnish children aged 2–17 years, also the annual household income after taxes was a significant indicator of childhood obesity. In previous literature, wealth and family income indicators have been observed to be associated with other health-related outcomes as well, such as mortality.35 Whenever feasible to measure, these indicators would be valuable in studies examining the association of SEP and health behaviour or other health-related outcomes. Most often, however, education is used as the main SEP indicator, as it has proven to be more straightforward to assess. However, the indicators of education and income are not interchangeable, which justifies the use of separate indicators for the different dimensions of SEP such as education, occupation and household income.36 The information on income is regarded as rather sensitive information and therefore is challenging to inquire in surveys.12 37 In surveys, income questions tend to have relatively high item non-response rates.21 In a large study on the socioeconomic differences in overweight of children in 24 countries from the WHO European Region, self-reported data on SEP indicators were used, and the authors discussed that reporting bias may have occurred particularly for family-perceived wealth.3 In our study, on the contrary, the information on income, namely the annual household income, was obtained from reliable administrative registry sources, and thereby the challenges related to misreporting or item non-reporting were overcome.
The magnitude of data available for the analyses of the current study was remarkable. Using the unique personal identity code given to every Finnish resident, we were able to link each child’s height and weight data to registry data of their parents and household. We obtained data including information on the family composition, household disposable money income and parents’ educational level, among others from the abundant registries of Statistics Finland. The influence of a multitude of SEP indicators on childhood obesity was analysed. However, we observed that finally, the indicators which most strongly predicted obesity among children and were selected to the final model were those which quite commonly have been reported in previous studies, namely the parents’ educational level and household income. This is probable to apply to many other high-income countries as well. The results of our study thereby support the use of these indicators also in future studies.
To conclude, the commonly used indicators of family SEP, education and income, were most strongly associated with childhood obesity. Thus, in future research, more attention should be paid to ensure standardised, reliable and objective measures of educational status and household income rather than putting effort on developing new SEP indicators. Furthermore, development of administrative registries including information on both healthcare and socioeconomic indicators can provide excellent opportunities to assess the influence of SEP on various health risks in future. This is also a cost-effective way of data collection. However, comprehensive data sources, possibilities to link data on individual level and high-capacity and secure cloud computing platforms to analyse the data following the data protection rules are needed for efficient use of registry data. European Union proposal on European Health Data Space regulation is a step towards this.
Data availability statement
No data are available.
Ethics statements
Patient consent for publication
Acknowledgments
We would like to thank the members of the STOP management team for their valuable advice and support in all phases of the study.
References
Supplementary materials
Supplementary Data
This web only file has been produced by the BMJ Publishing Group from an electronic file supplied by the author(s) and has not been edited for content.
Footnotes
LP and EL are joint first authors.
Contributors TL, PM, EL, HT, FS and ME designed the study. EL had access to all the data and performed all statistical analyses. EL is the guarantor and takes responsibility for the content of the study. EL, PM and TL contributed to data acquisition and checking the data. FS and ME provided methodological guidance for the study. TL wrote the first draft of the manuscript. LP was responsible for writing the later version as well as the final version of the manuscript. All authors evaluated and interpreted the results of the analyses; read and commented on the manuscript; and gave final approval for the version to be submitted. LP and EL contributed equally to this paper.
Funding The STOP project (http://www.stopchildobesity.eu/) received funding from the European Union’s Horizon 2020 research and innovation programme under grant agreement number 774548. The STOP consortium is coordinated by Imperial College London and includes 24 organisations across Europe, the USA and New Zealand.
Disclaimer The content of this publication reflects only the views of the authors, and the European Commission is not liable for any use that may be made of the information it contains.
Competing interests None declared.
Patient and public involvement Patients and/or the public were not involved in the design, or conduct, or reporting, or dissemination plans of this research.
Provenance and peer review Not commissioned; externally peer reviewed.
Supplemental material This content has been supplied by the author(s). It has not been vetted by BMJ Publishing Group Limited (BMJ) and may not have been peer-reviewed. Any opinions or recommendations discussed are solely those of the author(s) and are not endorsed by BMJ. BMJ disclaims all liability and responsibility arising from any reliance placed on the content. Where the content includes any translated material, BMJ does not warrant the accuracy and reliability of the translations (including but not limited to local regulations, clinical guidelines, terminology, drug names and drug dosages), and is not responsible for any error and/or omissions arising from translation and adaptation or otherwise.