Article Text

Abstract
Objectives The rate of improvement in all-cause mortality rates has slowed in the UK since around 2012. While evidence suggests that UK Government ‘austerity’ policies have been largely responsible, it has been proposed that rising obesity may also have contributed. The aim here was to estimate this contribution for Scotland and England.
Methods We calculated population attributable fractions (PAFs) resulting from changes in Body Mass Index (BMI) between the mid-1990s and late 2000s for all-cause mortality among 35–89-year olds in 2017–2019. We used BMI data from national surveys (the Scottish Health Survey and the Health Survey for England), and HRs from a meta-analysis of 89 European studies. PAFs were applied to mortality data for 2017–2019 (obtained from national registries), enabling comparison of observed rates, BMI-adjusted rates and projected rates. Uncertainty in the estimates is dominated by the assumptions used and biases in the underlying data, rather than random variation. A series of sensitivity analyses and bias assessments were therefore undertaken to understand the certainty of the estimates.
Results In Scotland, an estimated 10% (males) and 14% (females) of the difference between observed and predicted mortality rates in 2017–2019 may be attributable to previous changes in BMI. The equivalent figures for England were notably higher: 20% and 35%, respectively. The assessments of bias suggest these are more likely to be overestimates than underestimates.
Conclusions Some of the recent stalled mortality trends in Scotland and England may be associated with earlier increases in obesity. Policies to reduce the obesogenic environment, including its structural and commercial determinants, and reverse the impacts of austerity, are needed.
- public health
- social medicine
- epidemiology
Data availability statement
Data may be obtained from a third party and are not publicly available.
This is an open access article distributed in accordance with the Creative Commons Attribution Non Commercial (CC BY-NC 4.0) license, which permits others to distribute, remix, adapt, build upon this work non-commercially, and license their derivative works on different terms, provided the original work is properly cited, appropriate credit is given, any changes made indicated, and the use is non-commercial. See: http://creativecommons.org/licenses/by-nc/4.0/.
Statistics from Altmetric.com
STRENGTHS AND LIMITATIONS OF THIS STUDY
We calculate population attributable fractions for the change in Body Mass Index (BMI) (including obesity) for the populations of Scotland and England, using measured (not self-assessed) BMI data from nationally representative health surveys.
We compare observed mortality rates, BMI-adjusted mortality rates and projected mortality rates in 2016–2019 to estimate the proportion of recent changes in mortality that is likely to be attributable to earlier changes in BMI (including increases in obesity).
Weaknesses include a lack of socioeconomic stratification: as recent changes in mortality rates in Scotland and England have been more profound among socioeconomically deprived populations, this would have been an important addition to the analyses.
While the use of nationally representative survey data represents a general strength of the methodology, declining response rates also present challenges to interpretation, and introduce potential biases.
Introduction
Deeply concerning changes to mortality rates have been observed across the UK since the early 2010s: population average mortality rates have stopped improving, while mortality rates among poorer populations have increased.1–5 Such changes have been seen for many different causes of death, with cardiovascular mortality particularly affected.6 7 Similar stalled mortality trends have been recorded in other high-income countries.
While the causes of these changes in the UK have been debated, a large body of evidence now suggests that UK Government ‘austerity’ measures, implemented in 2010 following ‘the great recession’ of 2008 and which have disproportionately affected the poorest in society, are largely to blame.8–14 The impact of similar austerity measures in slowing mortality improvement in other countries has also been demonstrated.15–18
However, it has also been proposed that these trends may have additionally been influenced by changes in levels of adult obesity prevalence: this has been suggested in relation to the UK,19 the USA,20 21 Australia21 and elsewhere.22 This is largely because of two factors. First, there is a clear association between obesity and both cause-specific (including cardiovascular disease) and all-cause mortality, with the weight of evidence suggesting this relationship is causal.23 Second, considerable increases in obesity prevalence have been recorded in the UK (and elsewhere) in recent decades,24 and these predate the more recent changes to all-cause mortality discussed above. While this hypothesis appears plausible, it has not yet been tested. The aim of this study, therefore, was to assess, and quantify, the extent to which any of the mortality changes observed in Scotland and England since the early 2010s may be attributable to prior increases in obesity levels in the population.
Methods
Populations and data sources
We used data for the populations of Scotland and England: the change in mortality rates since 2012 has been similar in both countries, and trend data on adult obesity prevalence are available for both.
Mortality (and matching population denominator) data by age, sex and year were obtained from national registries, the National Records of Scotland (NRS) and the Office for National Statistics (ONS), respectively. Data were for all causes of death combined (rather than specific individual causes) as that was the focus of the study. Data on adult Body Mass Index (BMI) distribution in the populations were accessed from the Scottish Health Survey (SHeS) and the Health Survey for England (HSE) via the UK Data Service.25–27 Both are long-running (from the early-to-mid 1990s to the present day), nationally representative, surveys which include measured (rather than self-reported) height and weight (from which BMI is calculated) for large samples of the adult population. In 2008 (the last year of data employed here), adult sample sizes were approximately 6500 (SHeS) and 15 000 (HSE), with household response rates of 61% and 64%, respectively.28 29 More precise details of the survey years employed in the analyses, and the size of the age-specific sample sizes, are provided below and in the online supplemental material.
Supplemental material
Statistical analyses
Population attributable fractions (PAFs) were calculated for changes in BMI distribution (including therefore the increase in overweight and obesity) between the mid-1990s and late 2000s in relation to all-cause mortality among 35–89-year olds. PAFs are defined as the proportion of cases (here, all-cause deaths) attributable to a particular exposure:30 in this case, the latter is defined as the change in BMI distribution over time. The 35–89-year age group was determined by the availability of age-specific hazard ratios (HRs): we used previously published HRs from a meta-analysis of 89 European studies of BMI and all-cause mortality undertaken by the Global BMI Mortality Collaboration (GBMC).23 To reduce the risk of confounding and reverse causality, the GBMC meta-analysis excluded smokers, those with chronic disease at time of recruitment, and participants who died within the first 5 years of follow-up. HRs were available for six BMI categories and three age groups (35–49 years, 50–69 years and 70–89 years) (Supplementary Table S1), and were based on c.14 years’ follow-up. The PAF calculation was based on comparison of the BMI distribution in 1995 (the earliest time point available for the Scottish data) and 2008: this covers the period of considerable increase in obesity in both Scotland and England (discussed further below), and also broadly fits with both the c.14-year follow-up period on which the HRs calculation was based, and the later period of stalling improvement in mortality in both countries. PAF was therefore calculated as:

The 1995 SHeS only sampled adults aged 16–64 years; data for 65–89 years were therefore estimated from age-specific distributions in 2003 (the first survey that included all adults aged 16+ years). Sample sizes for the 35–89 age band were approximately 4000 in SHeS in both years, and c.9700 (1995) and c.8750 (2008) in HSE. Full details of sample sizes and methods employed to derive data for the older age groups in 1995 are provided in online supplemental table S2.
PAFs were applied to observed counts of deaths by 5-year age band, sex, year and country for the period 2016–2019 (ie, the most recent period of the stalling prior to the COVID-19 pandemic): this enabled calculation and comparison of observed mortality rates with BMI-adjusted rates (ie, excluding deaths attributable to the change in BMI distribution). These were then further compared with projected rates (ie, the rates that were predicted had the stalling of improvement not occurred): the latter were calculated for 2011–2019 based on linear trends. Three sets of projections were produced: 1981 based (ie, based on the linear trend for 1981–2010), 1991 based and 2001 based. All rates were age-standardised using the 2013 European Standard Population,31 and stratified by sex and country.
A range of sensitivity analyses were undertaken. These included the use of survey data for 3-year averages instead of single-year points (eg, 1994–1996 average instead of 1995), and employing different HRs for different age groups in the calculation of the PAFs: the latter HRs were approximated from a large English study of over 3.5 million adults with c.18 years follow-up, and which employed similar exclusion criteria as the GBMC study (online supplemental table S3).32 Those PAFs were also applied to different age groups in the mortality analyses. Analyses of age-specific trends were undertaken to explore differences in the PAFs between Scotland and England.
An assessment of the scale and direction of any likely bias was informed by reviews of relevant PAF-based literature.
Patient and public involvement
Patients and the public were not involved in this study.
Results
As context to the main results, figure 1 presents trends in adult obesity prevalence in Scotland and England between 1995 and 2019. In 1995, the overall prevalence was approximately 16% in both countries; by 2019, it had increased to 28%–29% (with female rates slightly higher than male rates). However, the biggest increases took place between the mid-1990s and the late 2000s, with much smaller increases seen in the later period: for example, for males in England, and males and females in Scotland, prevalence increased by only 1–2 percentage points between 2010 and 2019.

Trends in the percentage of adults (aged 16+ years) classed as obese (BMI 30+), Scotland (from the Scottish Health Survey (SHeS)) and England (from the Health Survey for England), 1995–2019. BMI, Body Mass Index.
The calculated PAFs by age group and country are shown in online supplemental table S4. The age-specific values were broadly similar for both countries with the exception of the oldest age group (70–89 years) where the PAF was small but positive for English data (0.029) and small but negative (−0.008) for the Scottish data. This is discussed further below.
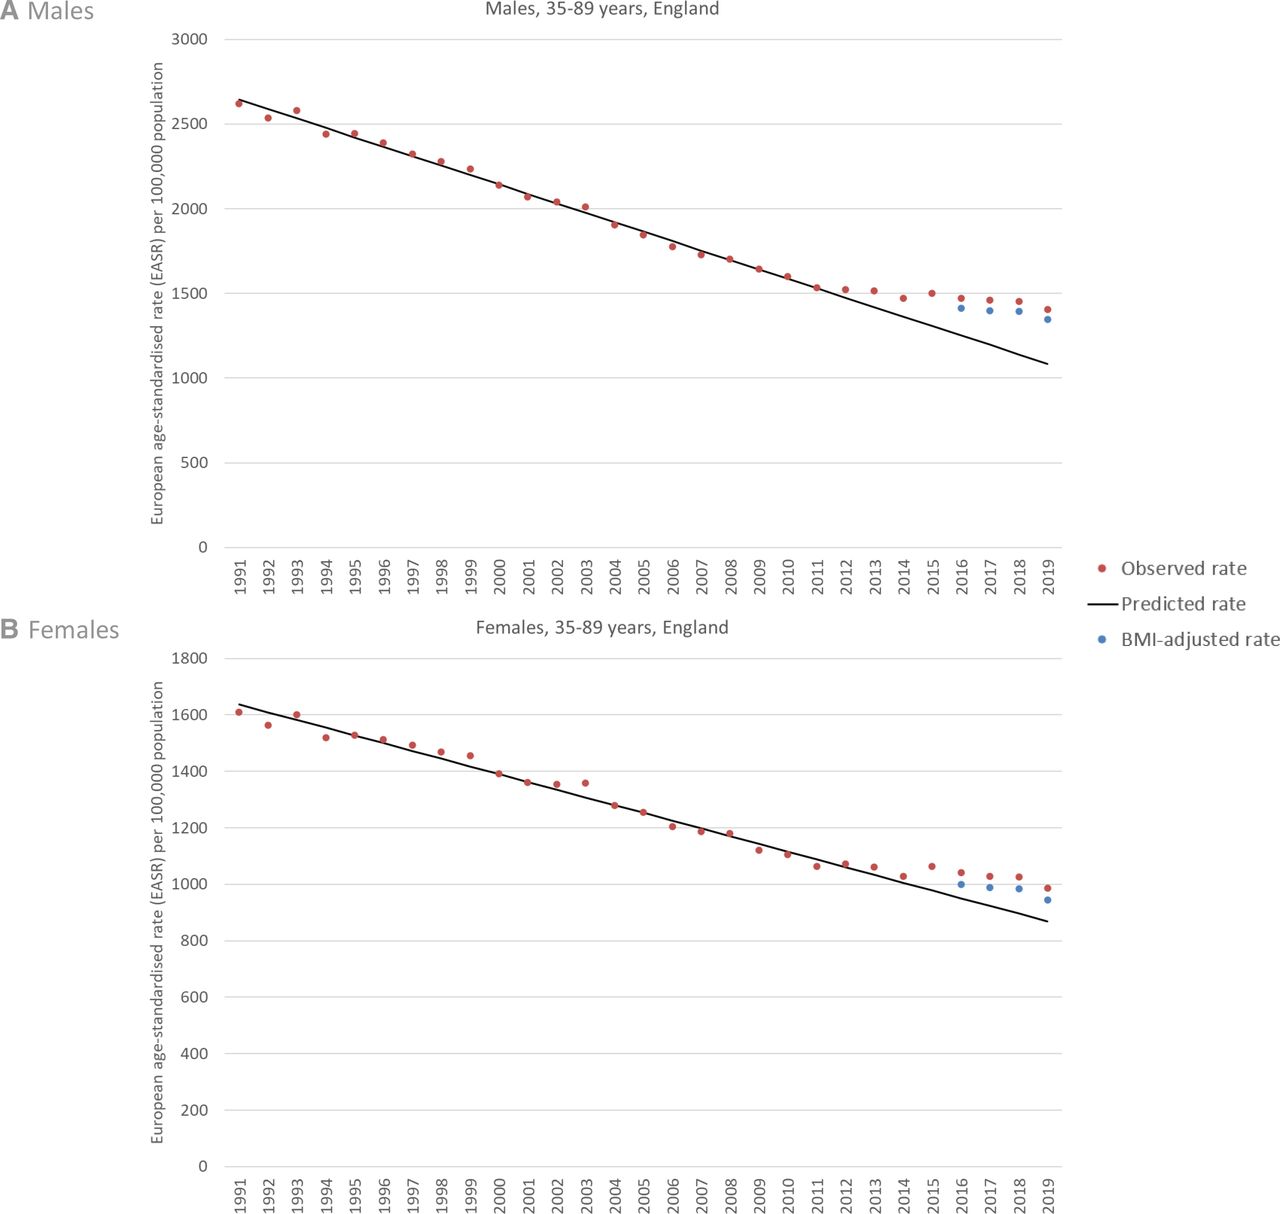
Figures 2 and 3 compare the observed European age-standardised mortality rates (EASRs) for 35–89-year olds with the BMI-adjusted EASRs and the 1991-based projected EASRs. Data are shown separately for males and females in Scotland (figure 2) and England (figure 3). The divergence between projected and observed rates is clear in all cases and has widened over time; it is greater for males than females. In all cases, the gap in each year is reduced by the BMI-adjusted EARS, but to a greater extent in England than in Scotland.
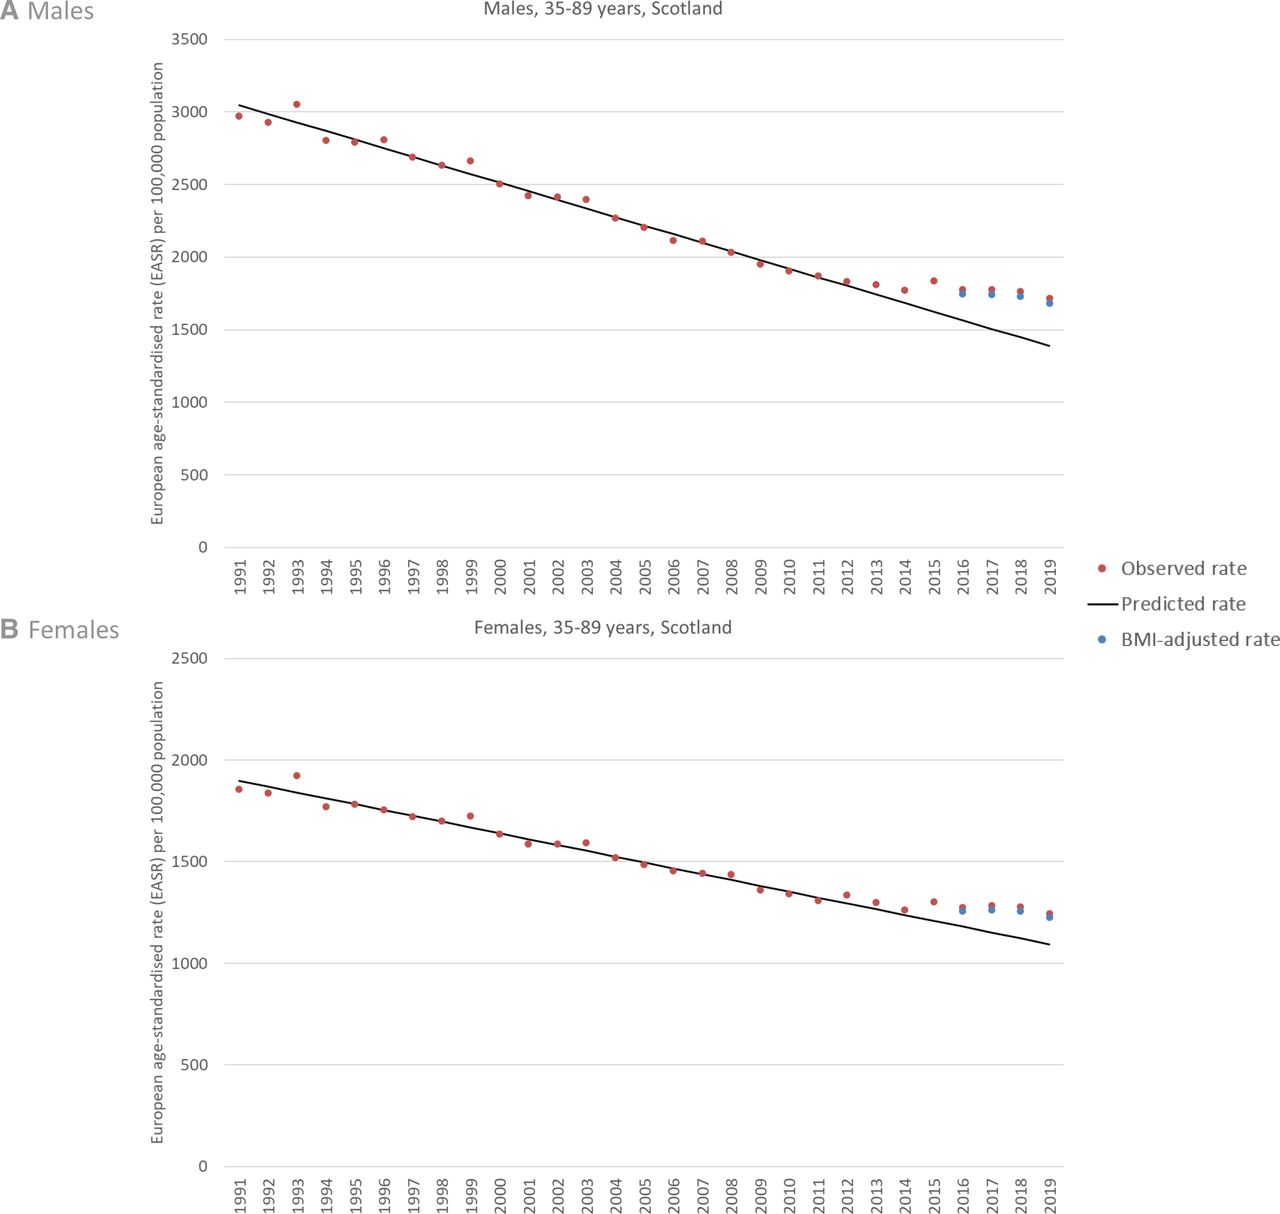
Observed, predicted and BMI-adjusted European age-standardised mortality rates (EASRs), Scotland 1991–2019. Note different y-axis scales for males and females. BMI, Body Mass Index.

Observed, predicted and BMI-adjusted European age-standardised mortality rates (EASRs), England 1991–2019. Note different y-axis scales for males and females. BMI. Body Mass Index.
Table 1 quantifies the differences shown in figures 2 and 3. It presents the three sets of EASRs (observed, projected and BMI-adjusted) as well as a comparison of the observed-projected gap with the BMI-adjusted-projected gap: this can be interpreted as the amount of the observed-projected gap that can be potentially attributed to the change in BMI between 1995 and 2008. Data are shown annually for 2016–2019, with—for simplicity—average figures for the most recent 3-year period also presented.
Comparison of observed, projected and BMI-adjusted age-standardised mortality rates per 100 000 population among 35–89-year olds, Scotland and England, 2016–2019.
This shows that for Scottish males, the average observed EASR for 2017–2019 was 1751 (95% CIs 1729 to 1773). This reduced marginally to 1719 (95% CIs 1697 to 1741) after adjustment for the change in BMI (in effect, excluding the increase in overweight-related and obesity-related deaths), but was still notably higher than the projected EASR of 1447 (95% CIs 1427 to 1467). The change in BMI therefore potentially ‘explained’ 10.5% of the difference between the observed and projected rates. For females, 13.6% of the difference could be attributed in this manner. However, the figures for England were notably higher: average figures of 20.1% for males and 35.1% for females.
The gap between the observed and projected EASRs is smaller when using 1981-based projections, and greater when using 2001-based projections. These are shown in online supplemental figures S1 and S2, and quantified further in online supplemental table S5.
The use of the different HRs and different age groups in sensitivity analyses resulted in lower PAFs (online supplemental table S6). Consequently, less of the difference between observed and projected mortality rates could be attributed to changes in BMI than was the case in the main analyses. For example, the 20.1% figure for males in England shown in table 1 was reduced to 16.4% when applied to the same 35–89 age band in the mortality analyses, to 15.1% when applied to 15–84 years, and to 13.2% when applied to 15+ years. Similar reductions of between approximately a third and a fifth were shown for females in England (online supplemental table S7).
Additional analyses to explore the difference in the PAFs for the oldest age group in Scotland (negative) and England (positive) suggested that it was partly explained by a smaller increase in grade I obesity in Scotland. In England, the prevalence in this age group increased by 44% from 13.6% to 19.6% between 1995 and 2008; in Scotland, the prevalence was already higher in 1995 (20.2%) and only increased marginally to 22.0% in 2008. A greater increase in Scotland would have resulted in a positive, rather than negative, PAF (data not shown). Given that the 70–89 years age group was not sampled in the 1995 SHeS, with estimates instead derived from proportions in the 2003 survey, the accuracy of these figures is uncertain. However, analyses of long-term trends for this age group showed that trends have fluctuated between approximately 20% and 24% in most years, and in that context, the derived estimate for 1995 seems plausible (online supplemental figure S3). Furthermore, comparison with English trends support the observation of higher grade I obesity in this age group: despite considerable fluctuation in rates over time, levels were higher in Scotland in 9 of the 13 available data points between 2003 and 2019 (online supplemental figure S4).
Despite such fluctuations in rates, only marginal differences in results were observed when using 3-year averages rather than single years in the calculation of PAFs across all age groups (online supplemental tables S8–S10).
The assessment of potential biases is shown in table 2. Of the 10 sources of potential bias listed, five suggest potential overestimation of effect size, two suggest underestimation and the remaining three are unclear. In the majority of cases, the size of any bias is either small or unclear. The implication is that the estimates produced are more likely to be overestimates of the contribution of obesity rather than underestimation, but this is uncertain.
Assessment of potential biases in calculation of population attributable fractions (PAFs)
Discussion
Overall findings and implications
Our analyses suggest that changes in the BMI distribution in Scotland and England between the mid-1990s and late 2000s may have potentially contributed to the mortality changes observed in both countries since around 2012. In Scotland, an estimated 10% (males) and 14% (females) of the difference between observed and predicted mortality rates among 35–89-year olds in 2017–2019 may be attributable to previous changes in BMI. The equivalent figures for England were notably higher: 20% and 35%, respectively. However, there is uncertainty around the accuracy of these estimates: sensitivity analyses and bias assessment suggest the potential for overestimation of effect size, although the degree is difficult to quantify.
Alongside the evidence of the role of UK Government austerity measures in the stalling of mortality improvement in Scotland and England,8–14 17 18 this suggests the need for a range of government policies to both reverse the damaging effects of austerity, as well as to address the negative consequences of an increased obesogenic environment in the UK.24
Strengths and weaknesses
A number of limitations of the study are acknowledged. In relation to the survey data sources, these include the following: the need to derive estimates for older age bands in the 1995 SHeS (although trend analyses suggest the data are plausible); the lack of non-response weighting in the 1995 HSE, as well as the general decline over time in response rates in all such population surveys and limited time series data (especially in the Scottish survey). Other limitations include the use of the proportional shift method in calculating the PAFS (although data constraints meant no other method was available), the use of age-specific (rather than age and sex specific) HRs (age/sex-specific HRs were not available) and the lack of any socioeconomic stratification of the analysis: the latter would have been important given that the mortality changes observed in the UK in the past decade have particularly affected more deprived populations.2–5 Such stratification was not possible for numerous reasons including: a lack of available HRs for different socioeconomic groups; lack of population denominator data for individual socioeconomic position (SEP) categories included in the surveys; the different area deprivation indices in use in Scotland and England, which would have made comparative interpretation of results problematic and the likely small sample sizes (especially in the Scottish survey data) which would also have increased levels of analytical uncertainty. We did not calculate 95% CIs for the PAFs on the basis that this would have misrepresented the key sources of uncertainty in the analyses, which were due to a range of potential biases rather than random variation. It was also difficult to find a means of combining assessment of random variation in each of the underlying data sources (BMI distribution, mortality, projected mortality and HRs), as well as the PAF estimate, that would have adequately represented the random variation. Other weaknesses are also included within table 2. However, the study also has a number of strengths. Despite their acknowledged limitations, both the SHeS and HSE are important data sources: they are large, nationally representative, surveys which have collected important measured (not self-reported) anthropometric data since the 1990s. The other data sources employed in the analyses were also strengths of the study: detailed mortality data for both countries’ whole populations, and HRs from a comprehensive meta-analysis of a large number of European studies of BMI (and the design of which minimised the risk of confounding). We also undertook a range of sensitivity analyses and a detailed assessment of potential biases.
Relevance to other studies
The relationship between obesity and all-cause mortality has been demonstrated in numerous studies.23 While the weight of evidence suggests that the association is causal, there has been considerable debate about both the extent of causality, and the measures such as PAFs that are used to assess it.33–38 For example, limitations of PAFs (and obesity-related PAFs in particular) highlighted by Levine34 include the following: the flawed nature of ‘simple causal partitioning’; the overlapping nature of exposures in a population meaning that different PAFs add up to more than 100% (thus, assessing single exposures in isolation is problematic); the importance of the definition of the exposure, such that a more broadly defined exposure will always increase the size of the PAF (meaning that a high PAF is ‘not necessarily indicative of a better scientific understanding of the causes(s) of disease in the population than a low PAF’). Flegal and colleagues have echoed many of these sentiments, also cautioning against interpretations of causality: ‘PAFs for obesity may be best considered as indicators of association’.33 They supported this argument on the basis of a number of definitional and methodological issues, including the importance of how the counterfactual is defined (with the size of the PAF varying depending on what definition is employed); potential overestimation in long follow-up studies (as alluded to in table 2); and important differences between studies in how obesity-related PAFs are calculated which make interpretation and comparison of results difficult.
Some of these criticisms of PAFs, particularly that relating to the sensitivity of the definition of the counterfactual, are potentially relevant to some of the results of our study. The differences between Scotland and England relate in large part to different PAF values for the oldest age group (70–89 years): although the values of the PAFs for this group are very small, their impact is significant because of the higher numbers of deaths that are observed. As described in the results section, the differences in PAF values between countries for this age group (small but negative for Scotland, small but positive in England) are in part explained by a smaller increase in levels of grade I obesity in the Scottish data between the two time periods; a larger increase would have resulted in a positive PAF value. With the value of the counterfactual here being derived from survey data with smaller, age-specific, sample sizes and annually fluctuating rates, this therefore both emphasises the need for caution in interpreting the precise values of the results, and also supports some of the criticisms of PAFs that have been made by Flegal and others.
Despite these criticisms and pleas for cautious interpretation of PAFs in terms of assessing causality, obesity-related PAFs have been calculated in many studies. This includes recent work by Ho and colleagues who calculated and compared obesity and smoking related PAFs from both data sources employed here: SHeS and HSE.39 The work suggested that deaths attributable to obesity increased from 18% to 23% between 2003 and 2017, overtaking the number of deaths attributable to smoking in the process. Other studies have demonstrated how different methodological approaches can result in different values of obesity related PAFs. For example, in the Netherlands Vidra et al generated PAFs ranging from 0.9% to 1.8% (twofold variation) for the same population, but based on different formulae.38 They also showed that the use of European, rather than global, HRs resulted in a higher PAF—this is relevant to our own study.
Vidra et al’s estimates for the Netherlands are clearly much lower than Ho et al’s for Scotland and England. Similarly, a comparative study of older (age 60+ years) English and Brazilian cohorts generated notably higher PAFs for the former compared with the latter: a PAF of 5.6% for the English cohort (broadly comparable to the PAF for those aged 50–89 years in the HSE in our study (although defined quite differently)) compared with 0.9% for the Brazilian.40 Finally, Stringhini et al calculated and compared PAFs for a range of risk factors (including obesity) from multiple cohorts across the globe.41 There was a considerable difference between the male (−5.6%) and female (3.5%) obesity-related PAFs, highlighting a limitation of our own study in not using sex-specific HRs and PAFs.
Conclusions
Changes to BMI (including, in particular, increases in obesity) between the mid-1990s and late 2000s are likely to have made a contribution to the stalled trends in mortality observed from around 2012 in both Scotland and England. However, a number of uncertainties are associated with the available data and cautious interpretation of our results is therefore required. The results are likely to be overestimates: thus the majority of the stalled trends is explained by other factors, most likely austerity policies. Action is therefore urgently needed to address both issues: to protect the income (and therefore the health) of the poorest and most vulnerable in society, and to counter the negative consequences, and the structural and commercial determinants, of the obesogenic environment in the UK.
Data availability statement
Data may be obtained from a third party and are not publicly available.
Ethics statements
Patient consent for publication
Ethics approval
Not applicable.
Acknowledgments
We are grateful to the organisations who supplied the required data: National Records of Scotland (NRS); the Office for National Statistics (ONS) and the UK Data Service (for access to the Scottish Health Survey and Health Survey for England data). Particular thanks also to professor Krishnan Bhaskeran at the London School of Hygiene and Tropical Medicine for assistance in accessing the data for some of the sensitivity analyses.
References
Supplementary materials
Supplementary Data
This web only file has been produced by the BMJ Publishing Group from an electronic file supplied by the author(s) and has not been edited for content.
Footnotes
Contributors The study was conceived jointly between GM, ET, DW and KAL. The research questions and analysis plan were agreed by all authors. DW undertook all analyses and drafted the manuscript. All authors provided substantial critical input to improve the manuscript and all authors approved the final draft. DW is responsible for the overall content as guarantor.
Funding GM has recently received funding from the WHO.
Competing interests None declared.
Patient and public involvement Patients and/or the public were not involved in the design, or conduct, or reporting or dissemination plans of this research.
Provenance and peer review Not commissioned; externally peer reviewed.
Supplemental material This content has been supplied by the author(s). It has not been vetted by BMJ Publishing Group Limited (BMJ) and may not have been peer-reviewed. Any opinions or recommendations discussed are solely those of the author(s) and are not endorsed by BMJ. BMJ disclaims all liability and responsibility arising from any reliance placed on the content. Where the content includes any translated material, BMJ does not warrant the accuracy and reliability of the translations (including but not limited to local regulations, clinical guidelines, terminology, drug names and drug dosages), and is not responsible for any error and/or omissions arising from translation and adaptation or otherwise.