Article Text

Abstract
Objective We analyse the impact of different vaccination strategies on the propagation of COVID-19 within the Madrid metropolitan area, starting on 27 December 2020 and ending in Summer of 2021.
Materials and methods The predictions are based on simulation using EpiGraph, an agent-based COVID-19 simulator. We first summarise the different models implemented in the simulator, then provide a comprehensive description of the vaccination model and define different vaccination strategies. The simulator—including the vaccination model—is validated by comparing its results with real data from the metropolitan area of Madrid during the third COVID-19 wave. This work considers different COVID-19 propagation scenarios for a simulated population of about 5 million.
Results The main result shows that the best strategy is to vaccinate first the elderly with the two doses spaced 56 days apart; this approach reduces the final infection rate by an additional 6% and the number of deaths by an additional 3% with respect to vaccinating first the elderly at the interval recommended by the vaccine producer. The reason is the increase in the number of vaccinated individuals at any time during the simulation.
Conclusion The existing level of detail and maturity of EpiGraph allowed us to evaluate complex scenarios and thus use it successfully to help guide the strategy for the COVID-19 vaccination campaign of the Spanish health authorities.
- COVID-19
- Epidemiology
- Health policy
- HEALTH SERVICES ADMINISTRATION & MANAGEMENT
- Public health
Data availability statement
Data are available in a public, open access repository. A link to the data in a GitHub repository is included within the article.
This is an open access article distributed in accordance with the Creative Commons Attribution Non Commercial (CC BY-NC 4.0) license, which permits others to distribute, remix, adapt, build upon this work non-commercially, and license their derivative works on different terms, provided the original work is properly cited, appropriate credit is given, any changes made indicated, and the use is non-commercial. See: http://creativecommons.org/licenses/by-nc/4.0/.
Statistics from Altmetric.com
Strengths and limitations of this study
EpiGraph is a highly scalable agent-based model that can directly represent characteristics of the individuals and their interconnections.
EpiGraph allows modelling of the effect of other factors, for example, non-pharmaceutical interventions or vaccination strategies.
The simulator we present cannot model individual pathologies nor indirect infection through surface contact.
Waning immunity is not implemented for the second dose in the current version.
The agents modelling individuals of the population do not have adaptive behaviour.
Introduction
Immunisation saves between 4 and 5 million lives annually.1 Its benefits extend beyond those vaccinated to include the individuals who cannot themselves be vaccinated—children, people with weak immune systems or those with contraindications. At the same time, resources that are saved due to fewer illnesses and hospitalisations can be invested into researching other diseases and caring for the otherwise ill,2 both activities that were clearly affected since the surge of COVID-19.
At the end of 2020, the first COVID-19 vaccine batches were available in Spain and the authorities were faced with the problem of how to best schedule the different population segments for immunisation, considering a limited number of existing doses at this time.3 The prevention and mitigation objectives are usually multiple: the immunisation policies seek to reduce not only the number of deaths but also the number of infections (to curb transmission), of hospitalisations (to reduce the pressure on intensive care units) or the incidence over high-risk population groups.4 The complexity of this problem increases with the large number of factors that have to be considered regarding the different types of vaccines—each one with different efficacies, batch sizes and availability—as well as the surge of new virus mutations with different levels of resistance to vaccines.
The work presented in this paper used EpiGraph5 to simulate the vaccination scenarios and compare the outcomes in terms of COVID-19 infections, hospitalisations and deaths. Our main result shows that the best strategy is to vaccinate first the elderly with the two doses spaced apart at an interval bigger than the one recommended by the vaccine producer.
This work was carried out in collaboration with a multidisciplinary team that provided data, feedback and support for public health decisions.
Materials and methods
Simulator overview
EpiGraph is an agent-based simulator containing several models that interact to reproduce the propagation of different COVID-19 virus strains throughout a geographical area with different urban centres that may exhibit population commute patterns. Modelling of the population is done at individual level, both in terms of characteristics (age, profession, etc) and interaction patterns between citizens. EpiGraph also models the non-pharmaceutical interventions (NPIs) (face mask use, social distancing, etc) that were implemented at the time of the simulation, as well as vaccination with the different available vaccines. The input data for these models is highly heterogeneous and comes from sources such as research papers or public and private databases.6 Please see Guzman-Merino et al7 and Merino et al8 for details.
The social model
This model reproduces the characteristics of the about 5 million population of the 10 largest cities of the Metropolitan Madrid region, including demographic data from the Spanish census,9 daily activities and interaction patterns. Online supplemental tables 1–5 show the different configuration parameters; the data was collected from the Spanish National Statistics Institute.3 10 Daily activities are structured around work/study time, leisure time and family time. In order to realistically reproduce social mixing, EpiGraph considers four different collectives (workers, students, unemployed and elderly people) as well as nine different professions, as shown in the online supplemental material.
Supplemental material
The epidemic model
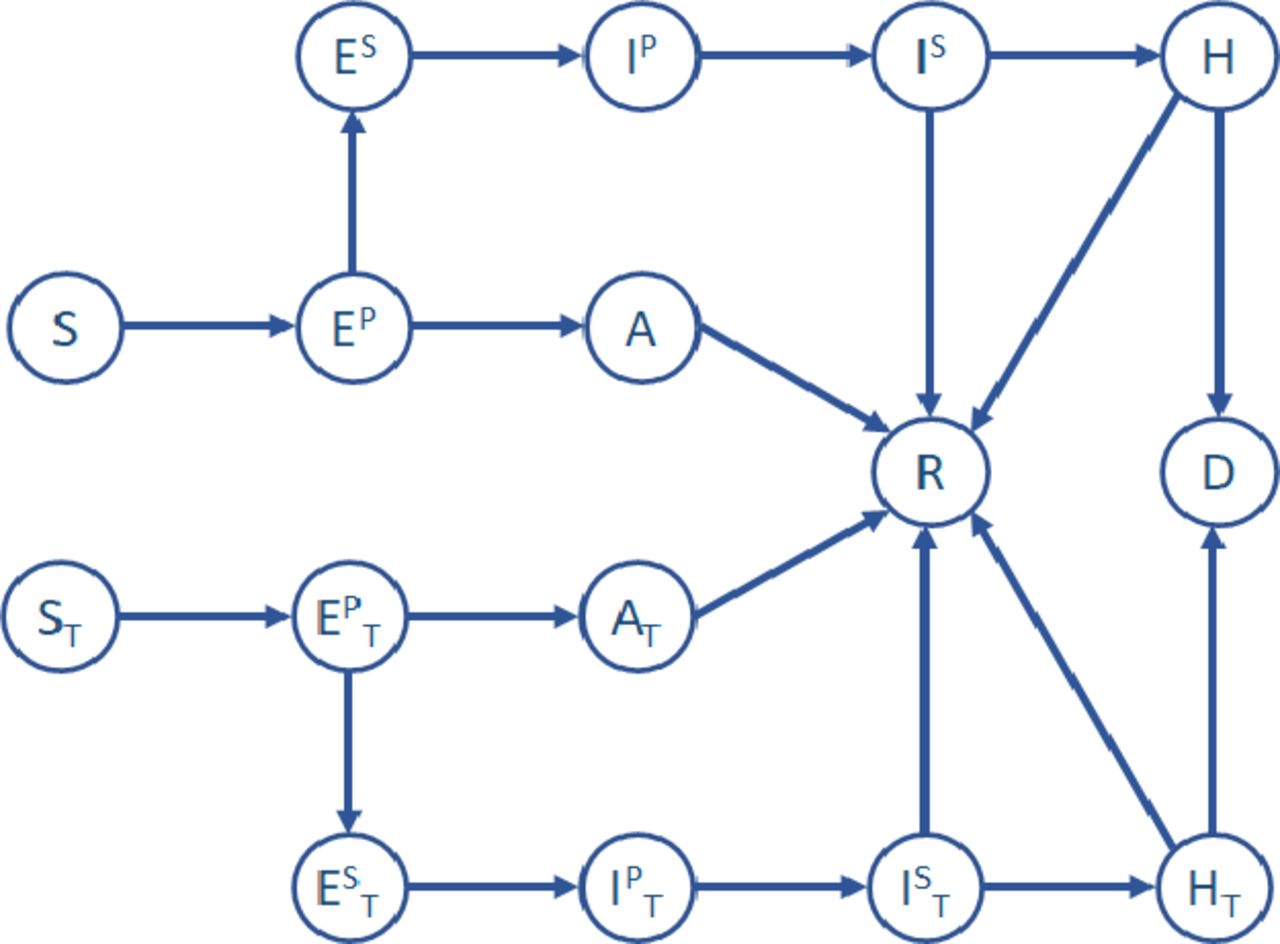
Figure 1 captures in its top part the transition between infection stages for individuals who were neither vaccinated nor previously infected. We assume that these individuals have become immune to COVID-19 and they will not become reinfected during the entire simulation time. Please see Guzmán-Merino et al5 for details. The lower part (with states subscripted with T, ie, treated) represents the transitions for vaccinated individuals—which is the focus of this work. Upon infection, a treated individual transitions from being susceptible (ST) to becoming exposed in a primary phase (exposed primary treated (EPT)); then moves to one of two possible states, as follows. If vaccination was effective, then the individual transitions to the asymptomatic treated state (AT). In an asymptomatic state, the individual may spread the disease, although to a lesser extent than an infected individual; on the other hand, the individual will not experience any health condition herself. In the case the vaccine was not effective, the individual transitions to the exposed secondary treated (EST) state and then to infected treated primary and secondary states (IPT and IST, respectively). In these states the individual is at risk of being hospitalised (HT) or dying (D). Online supplemental tables 6 and 7 show the R0 values and transition probabilities for each compartment state considered in the epidemic model. A more detailed description of the parameters used in the models can be found in Ministerio De Sanidad and Guzmán-Merino et al.3 5 For more information on the time spent in each state of the epidemic model, please refer to Singh et al9 or directly to Nishiura et al, Davies et al, He et al, Mizumoto et al, European Centre for Disease Prevention and Control, Berenguer et al and Chen et al.11–17

Compartmental model used by EpiGraph. It consists of the following states: susceptible (S), exposed: primary (EP) and secondary (ES), asymptomatic (A), infected: primary (IP) and secondary (IS), hospitalised (H), recovered (R), dead (D). States with index T (ST, EPT, etc) are related to vaccinated (treated) subjects.
The transportation model
The transportation model considers that some individuals commute between cities for work, study or vacation, and it is based on the gravity model proposed by Viboud et al.18 The number of people any two cities i and j exchange depends on the population (Pi and Pj) as well as the distance between them (di,j), and differs for short and long-distance commutes. We also consider people from any group type that move at any distance for several days for vacation purposes. The simulator randomly selects individuals from specific group types within the populations and moves them for a given time to another location. For short-distance commuters, 85% are workers and 15% are students; for long-distance commuters the percentages are 50% workers, 30% students, 15% retired individuals and 5% unemployed people; this is an approximation of the distribution for Spain, based on National Statistics Institute.10
The non-pharmaceutical interventions model
This model reproduces the NPIs followed during the simulation period and include the use of face masks, social distancing, mobility restrictions imposed by the authorities9 and population testing.5 Given that EpiGraph is an agent-based epidemic simulator, we can model in detail the different policies imposed by the authorities at the granularity of the individual. The NPI model links these policies with the social and the transportation models. Concretely, we are considering:
Social distancing. We leverage the four classes of contacts implemented in EpiGraph (school, work, family, leisure) to evaluate social distancing policies that can apply differently to the contact types, for instance closure of the schools and workplaces. We consider both essential and non-essential workers—which represent 35% and 65% of company employees—as well as the interruption of leisure activities.
Mobility restrictions. We introduce policies that restrict independently the two types of intercity movements: short and long distance.
Face masks. We have introduced the use of surgical and ffp2-grade face masks when used by the general population or by targeted groups, such as the elderly.
We choose the health, social health, defence and catering collectives as a target for sampling strategies, given that they had a higher incidence of COVID-19 cases. All the strategies we implement are parameterisable by the number of daily tests, the minimum testing frequency (ie, the minimum time between two tests of the same individual), the quarantine time and the percentage of quarantine breakers.
Vaccination model
This model determines the effectiveness of a vaccine for an individual according to the COVID-19 variant, vaccine type, whether it is the first or second dose (if applicable), and personal characteristics such as age or whether she has been previously infected with COVID-19. In the compartmental model shown in figure 1, we distinguish whether the individual is vaccinated or not. A vaccinated individual is categorised as treated.
In figure 2, we assume that the first dose is administered at time zero. During the first 12 days,19 the vaccine does not provide any protection, while during the next 8 days the efficacy of the vaccine increases linearly to 52%. So, in the figure at TD1Emin (day 12), this dose starts providing protection and reaches the maximum efficacy value at TD1Emax (day 20); for example, the maximum efficacy for a first dose (ED1max) of Pfizer-BioNTech is 52%.19 If the second dose is not applied, then the efficacy will start decreasing after time TD1Ewaning, reaching the minimum value of 25% a year after the first dose was administered. We are in the process of implementing a complete waning immunity model, which is out of scope for this paper. Given that the high incidence period occurs in the first 20 weeks of the simulation and that the Omicron variant had not yet appeared, some literature sources point to a less than significant decrease in vaccine effectiveness in this interval.20 Consequently, we expect limited effects of this phenomenon in the simulated scenarios. The second dose is applied at day 21,1 which increases the efficacy linearly to its maximum ED2max at TD2Emax, around day 38 (eg, 95% for Pfizer-BioNTech19). In this case, this maximum value for the second dose is maintained for 1 year. Online supplemental tables 8 and 9 show the parameters used in the vaccination model and the daily doses administered per 100 000 habitants, per vaccine type: Comirnaty (Pfizer-BioNTech), Spikevax (Moderna), Vaxzevria (AstraZeneca) and Janssen (Johnson & Johnson). Figure 2 shows the distribution used to model the vaccine efficacy over time (Comirnaty). This efficacy is defined as the probability of transitioning to the asymptomatic treated state (AT). For example, a vaccine efficacy of 95% means that 95% of the vaccinated individuals will transition to the AT state and remain asymptomatic if they are infected, without risk of severe symptoms. The remaining 5% will transition to the EST state if infected and a fraction of them will develop severe symptoms. Each compartmental state related to a vaccinated individual has an R0 value that is different from the case when no vaccination was applied and is dependent on the vaccine type and COVID-19 variant.

Vaccination model with values corresponding to Pfizer-BioNTech vaccine. The efficacy of a single dose is displayed in a solid orange line. The second dose efficacy is represented as a dashed blue line.
Vaccination strategies
Vaccination strategies reflect policies that can be adopted by health authorities and have as an objective determining the most effective approach. As a general rule applied by authorities in Spain, a candidate is subject to receiving the vaccine if she is in the susceptible, exposed primary or asymptomatic states. An individual who has been infected with COVID-19 before being vaccinated will receive a single vaccine dose.
Here, we consider five different strategies:
No vaccination.
Elderly First (baseline scenario): reproduces the vaccination strategy followed in Spain. For Pfizer-BioNTech and Moderna, the first group scheduled for vaccination was the elderly people living in nursing homes, their caregivers and front-line health professionals. The remaining health workers were vaccinated next, followed by the general population in age-decreasing order. For AstraZeneca, the target was people between 18 and 56 years old before 23 March; 18 and 65 years old between 23 March and 9 April; and 60 and 69 years old after 9 April. Priority was given to elderly caregivers and health, security forces and education professionals. In the simulations, the Janssen vaccine was only delivered to people between 50 and 70 years old.
Young First: prioritises individuals following an age-increasing order for the Pfizer-BioNTech and Moderna vaccines, starting with the teenagers. The idea is to limit the impact of transmission via groups that have the most social contacts within the entire population and tend to have the least noticeable symptoms. No specific professions are prioritised. This strategy stays unchanged compared with the ‘Elderly First’ for AstraZeneca and Janssen, a decision taken by the Spanish authorities.
Elderly First, 56 days between doses (56D): a variation of Elderly First in which the two doses are separated by 56 days (instead of 21) for the Pfizer-BioNTech and Moderna vaccines. For AstraZeneca and Janssen, the strategy stays the same. This is a scenario that the authorities tested to assess whether it could protect a larger fraction of the population from extreme symptoms that could lead to hospitalisation and death.
Elderly First, 2 doses already infected (2DI): a variation of Elderly First in which individuals who have been previously infected with COVID-19 also receive two doses of Pfizer-BioNTech or Moderna vaccines. The strategy for the rest of the population is the same as in the Elderly First.
Simulation configuration
The simulation starts with an initial percentage of infected population (per city of 0.6%, a number that corresponds to the officially reported cases at the end of December 2020). EpiGraph is calibrated only once for the baseline scenario over the entire simulation period; this is, the scenario that reproduces the actual vaccination strategy that has been applied during the simulation period. The initial conditions include prevalence values at simulation start time, that is, the percentage of the population that had already recovered from COVID-19 before the start of the third wave in Spain. These values are 11% for workers, 9.1% for students, 8.6% for unemployed and 1.01% for elderly people.21 The parameters related to the epidemiological and NPI models are taken to be the same for all the cities under study and were not involved in the calibration process. In terms of NPIs, we reproduce the social distancing measures that were applied in the Madrid metropolitan area during the simulation period. As a result, all individuals use face masks at work, school and during leisure time, but not when they are at home.
Patient and public involvement
None was required.
Results
Model validation
EpiGraph was validated using the Madrid province as a simulation scenario; this area mostly consists of the metropolitan area of Madrid which includes the city of Madrid and the cities of Alcalá de Henares, Alcobendas, Alcorcón, Fuenlabrada, Getafe, Leganés, Móstoles and Parla, for a total of 5 018 241 inhabitants. The simulations start on 27 December 2020—which corresponds to the initiation of the COVID-19 vaccination campaign in Spain—and runs for 190 days. Figure 3 (left) shows the aggregated number of infected individuals.22 Each city includes real demographic information to reflect the population pyramid, job sector distribution, size of household, etc. EpiGraph uses stochastic processes to perform the simulations, which may result in differences between the results in every run. To quantify the deviation in the results we have repeated the same simulation 40 times, obtaining a median number of notified daily cases of 3111 over the entire simulation timeline—similar to the average number of reported cases over this period (3255).

Left: results for model validation. These results include the aggregated number of infected individuals for the area under study. Real and simulated data are shown in red and blue, respectively. The simulated curve corresponds to the baseline scenario. Right: simulation results that include the percentage of infected population in blue bars and the number of deaths in orange, for each one of the vaccination strategies. The SD is the following for the different strategies (for the number of infected individuals): 0.167% (no vaccination), 0.111% (Elderly First), 0.134% (Young First), 0.138% (Elderly First 56D) and 0.122% (Elderly First 2DI).
Vaccination scenarios
Figure 3 (right) shows, for each vaccination strategy, the percentage of infected individuals from the overall population and the number of deaths at the end of the simulation. Each scenario was simulated 40 times and the error bars represent the 95% CI. Note the small magnitude of the CIs, detailed in the online supplemental material. In addition to face masks, all scenarios implement several social distancing restrictions that reduce the capacity in restaurants and social gatherings.
Figures 4 and 5 show the number of infections and deaths broken down by groups. We can observe that the no-vaccination scenario results in nearly 150% more infections and 200% more deaths than any of the vaccination scenarios. According to our model, Young Firsts results in a similar number of total infections and about 49% more deaths compared with the baseline approach (Elderly First). The reason is that one of the most vulnerable groups—the elderly—is not vaccinated until the end of the simulation. In figure 5, we can observe that most of the deaths are among elderly people. Spacing out the first and second doses by 56 days increases the number of people vaccinated at any time, although they may only have received one dose. According to our model, this approach reduces the final infection rate and the number of deaths by 6% and 3% with respect to the baseline. Lastly, the Elderly First 2DI stayed mostly unchanged—with a slight reduction in the number of infections and deaths that is within the 95% CI—compared with the baseline.

Percentage of infected population at the end of the simulation, by groups. ElderCG, caregiver for elderly people; Elder-DC, elderly attended in daily centerscentres; Elder-NA, elderly who live by themselves; Elder-NH, elderly who live in nursing homes; FL-Health, front-line health professionals; Health, non-front-line health professionals.

Number of deaths at the end of the simulation, broken down by groups. ElderCG, caregiver for elderly people; Elder-DC, elderly attended in daily centerscentres; Elder-NA, elderly who live by themselves; Elder-NH, elderly who live in nursing homes; FL-Health, front-line health professionals; Health, non-front-line health professionals.
Discussion
Main findings
In this work, we compare the efficacy of different vaccination strategies for the Madrid metropolitan area during the third pandemic wave. The strategies take into account the available vaccine doses at any time, the different variants and the variation in interaction patterns within specific professional groups (eg, front-line and non-front-line health professional, catering workers and teachers).
While a policy that targets the reduction of the number of susceptible persons that are exposed to infected individuals is reasonable, our results show that applying it without considering additional aspects is problematic. The young people are, in general, the population who have the most social contacts of all age ranges. This fact doesn’t make them necessarily a good candidate for early vaccination; in fact, we show that prioritising the vaccination of the young would significantly increase the number of deaths.
On the other hand, spacing out the first and second dose by 56 days would result in a slight reduction in the number of both infections (an additional 6%) and deaths (an additional 3%) with respect to vaccinating the Elderly First at the interval between doses recommended by the vaccine producer. Similar results have been obtained in other published works. The reason is probably the increase in the number of vaccinated individuals at any time during the simulation, although some may only have the first dose. Please see David et al23 for more results.
Strengths and weaknesses
The nature of EpiGraph as an agent-based model gives it the power to directly represent characteristics of the population under study, as well as the possibility to model the effect of other factors, for example, NPIs or vaccination strategies, on the individuals in a population. This allows us to—relatively—easily add individual attributes that are relevant, model different interventions, customise and refine them and observe their effects for the different segments of the population. EpiGraph is flexible and scalable enough that we were able to adapt it relatively quickly to the real requirements drawn within the Spanish task force on vaccination, led by the Spanish Health Ministry and initiated in October 2020.
EpiGraph also has limitations, some easier to address in the future than others: (1) We do not consider attributes such as previous pathologies that we now know that may come into play when we evaluate the risk of developing COVID-19 severe symptoms. (2) In the transportation model, the movement of individuals between cities depends only on the distance between the cities and the population size. In our experiments, we only model the largest urban regions; we could incorporate smaller cities and towns, including rural regions. (3) A recovered person (including those that have had COVID-19 at the start of the simulation) is considered immune to reinfection for the period one 1 year; this seems to depend on the COVID-19 strain and would require a waning immunity and reinfection model. (4) Infection is achieved in our model via social contacts (sharing the same space); infection through third media such as surfaces is not considered. (5) The agents representing the individuals do not have adaptive behaviour depending on external factors, for example, news, other people’s behaviour, etc.
Strengths and weaknesses in relation to other studies
The majority of the existing COVID-19 simulation approaches lack the detail necessary to model the characteristics of the population as well as the complex interaction with disease and health interventions. Some of the more detailed and mature models are agent based, but have other shortcomings such as considering homogeneous agents, not sequencing and stratifying vaccination strategies or not considering vaccination effectiveness across variants.
Reiner et al24 use a deterministic SEIR framework to model the propagation of the virus and the effect of NPIs (social distancing mandates and mask use) until Spring of 2021. Some of their limitations are the absence of age structure and the assumption of a well-mixed population. Kerr et al25 include demographic information about age structure and population size. Different from our work, contacts are not based on existing patterns; scalability issues are partly sidestepped by dynamic scaling. Vaccines are modelled by adjusting individuals’ susceptibility to infection and probability of developing symptoms after being infected; both of these modifications affect the overall probability of progressing to severe disease and death. However, some features we consider in EpiGraph (such as vaccine effectiveness across variants) are not currently implemented in Covasim. Modelling social mixing is crucial for obtaining realistic simulations. Other research26–28 considers different ways to refine social interactions. In EpiGraph, social mixing is modelled using the Facebook and Enron contact networks and individual contact matrices.
Bubar et al29 compare five age-stratified prioritisation strategies in terms of cumulative incidence, mortality and years of life lost. Some limitations have to do with using prepandemic contact matrices, not incorporating NPIs, and only considering variation in disease severity and risk by age—although contact rates, and thus infection potential, vary greatly not only by occupation and age. Results show, such as in our work, that people aged 60 years and older should be prioritised to minimise deaths. Matrajt et al30 use a mathematical model paired with optimisation algorithms to determine the optimal use of vaccine for different combinations of vaccine effectiveness and number of doses available under a wide variety of scenarios; the optimal allocation strategies were computed using age as the sole risk factor. This work obtains similar conclusions as our work, that is, for low vaccine effectiveness, the best option for reducing deaths is to allocate vaccines to older age-groups first.
Chang and Moselle31 use the agent-based infectious disease modelling tool CovidSIMVL to explore outcomes of two-dose vaccination regimens and a third ‘hybrid’ policy that reflects ranges of expected levels of protection according to Pfizer and Moderna, but with a 35-day separation between first and second dose instead of the shorter recommended period. Unlike in our work, agents here were considered homogeneous and vaccination strategies were not stratified (eg, by age ranges) nor sequenced in order to best manage risk on the basis of considerations of population-level transmission risk and on the basis of considerations of equity.
Kou et al32 propose a multiscale agent-based model to investigate the infectious disease propagation between cities and within a city using the knowledge from person-to-person transmission. This is a way to reduce the degree of freedom of the model: at microscale, an agent represents a person while at the mesoscale an agent refers to hundreds of individuals. Actual data on traffic patterns and demographic parameters are adopted; however, unlike in our work, no age stratification is considered for vaccination. Romero-Brufau et al33 propose a second dose delay strategy for people below 65 years old. Like in our work, this strategy shows benefits reducing the number of infections.
Impact for clinicians and policy-makers
This work was carried out as a collaboration of a multidisciplinary team that provided data, feedback and support for public health decisions. Our results helped health authorities in Spain to adjust the COVID-19 vaccination strategy to reduce the number of deaths. Tools that allow adaptation to changes and predict future situations are essential to achieve the best health decisions with the most efficient use of resources. It is worth mentioning that two other teams worked in parallel to simulate the same scenarios using different and independent approaches, as part of the joint task force of the Spanish Ministry; their results were similar to ours for all the models and were published in a joint publication.34
While our results may be of limited utility at the present time in Spain, they can be of great utility in other countries where the vaccination campaigns are not as advanced, for instance in developing countries. Equally important, they reflect the potential of this thoroughly tested and calibrated tool to model scenarios in a flexible manner and adapt to the information that is available at any time about the conditions of the epidemic, available vaccines and other policies. The fact that EpiGraph is a mature tool that we used successfully in practical scenarios can make a difference if assessment for decision-making becomes necessary again in the future.
Unanswered questions and future research
Our immediate plans include modelling and evaluating the effect of additional vaccination doses, together with waning immunity. Medium term, we will address the limitations we are reporting, starting with the implementation of pathologies and a more realistic transportation model.
Data availability statement
Data are available in a public, open access repository. A link to the data in a GitHub repository is included within the article.
Ethics statements
Patient consent for publication
Ethics approval
Not applicable.
References
Supplementary materials
Supplementary Data
This web only file has been produced by the BMJ Publishing Group from an electronic file supplied by the author(s) and has not been edited for content.
Footnotes
Contributors DES, MGM and CDG designed and implemented EpiGraph. DES, COL and ALS conceived and designed the experiments. DES, MGM and CDG processed the input data and ran the experiments. DES, COL, ALS and MGM wrote the paper. DES, CDS, DG-B, COL, ALS, M-CM and JCP provided insights on the validity of our assumptions, recommended additional related work and contrasted the results with their own findings. All authors review the different manuscript drafts and approved the final version for submission. The guarantor is DES.
Funding This work has been partially funded by the agreement between the Community of Madrid and the Carlos III University of Madrid for the funding of research projects on SARS-CoV-2 and COVID-19 disease, project name 'Multi-source and multi-method prediction to support COVID-19 policy decision making', which was supported with REACT-EU funds from the European regional development fund 'a way of making Europe' (2020/00692/003) and the European High-Performance Computing Joint Undertaking (JU) under the ADMIRE project (grant agreement No 956748). We have also used the Spanish Supercomputing Network (RES) under the grant BCV-2021-1-0011. The role of all study sponsors was limited to financial support.
Competing interests None declared.
Patient and public involvement Patients and/or the public were not involved in the design, or conduct, or reporting, or dissemination plans of this research.
Provenance and peer review Not commissioned; externally peer reviewed.
Supplemental material This content has been supplied by the author(s). It has not been vetted by BMJ Publishing Group Limited (BMJ) and may not have been peer-reviewed. Any opinions or recommendations discussed are solely those of the author(s) and are not endorsed by BMJ. BMJ disclaims all liability and responsibility arising from any reliance placed on the content. Where the content includes any translated material, BMJ does not warrant the accuracy and reliability of the translations (including but not limited to local regulations, clinical guidelines, terminology, drug names and drug dosages), and is not responsible for any error and/or omissions arising from translation and adaptation or otherwise.