Article Text

Abstract
Objectives This study aimed to explore the predictive value of single and multiple risk factors for the clinical outcomes of critically ill patients receiving enteral nutrition and to establish an effective evaluation model.
Design Retrospective cohort study.
Setting Data from the 2020–2021 period were collected from the electronic records of the First Affiliated Hospital, Nanjing Medical University.
Participants 459 critically ill patients with enteral nutrition in the geriatric intensive care unit were included in the study.
Primary and secondary outcome measures The primary outcome was 28-day mortality. The secondary outcomes were 28-day invasive mechanical ventilation time, intensive care unit stay, Nutrition Risk Screening 2002 (NRS2002) score and Acute Physiology and Chronic Health Evaluation II (APACHE II) score.
Results Independent prognostic factors, including prealbumin/procalcitonin (PCT) ratio and APACHE II score, were identified using a logistic regression model and used in the nomogram. The area under the receiver operating characteristic curve and concordance index indicated that the predictive capacity of the model was 0.753. Moreover, both the prealbumin/PCT ratio and the combination model of PCT, prealbumin and NRS2002 had a higher predictive value for clinical outcomes. Subgroup analysis also identified that a higher inflammatory state (PCT >0.5 ng/mL) and major nutritional risk (NRS2002 >3) led to worse clinical outcomes. In addition, patients on whole protein formulae bore less nutritional risk than those on short peptide formulae.
Conclusions This nomogram had a good predictive value for 28-day mortality in critically ill patients receiving enteral nutrition. Both the prealbumin/PCT ratio and the combination model (PCT, prealbumin and NRS2002), as composite models of inflammation and nutrition, could better predict the prognosis of critically ill patients.
- INTENSIVE & CRITICAL CARE
- Nutritional support
- NUTRITION & DIETETICS
- Adult intensive & critical care
Data availability statement
Data are available at: https://figshare.com/articles/dataset/EN3_original_data_xlsx/19960202.
This is an open access article distributed in accordance with the Creative Commons Attribution Non Commercial (CC BY-NC 4.0) license, which permits others to distribute, remix, adapt, build upon this work non-commercially, and license their derivative works on different terms, provided the original work is properly cited, appropriate credit is given, any changes made indicated, and the use is non-commercial. See: http://creativecommons.org/licenses/by-nc/4.0/.
Statistics from Altmetric.com
STRENGTHS AND LIMITATIONS OF THIS STUDY
This study investigated the nutritional risk factors in a critical scenario.
This study produced a convenient prediction model for the outcomes of the critically ill.
The study was retrospective and data were relatively abundant.
Since clinical data could not be obtained from other centres, no external validation was performed.
Introduction
In critically ill patients, due to severe stress or trauma, the metabolic rate is significantly increased, metabolic disorders and malnutrition are very common, and the incidence of malnutrition can be as high as 30%–50%.1 Malnutrition prolongs the patients’ hospital stay in the intensive care unit (ICU) and increases the incidence of infection and other complications, thus increasing mortality.2 Studies have shown that early enteral nutritional support can reduce the severity of disease in critically ill patients, reduce the risk of complications, shorten the length of ICU stay and improve the prognosis of patients.3 Nutrition practice guidelines in Europe, Canada and the USA suggest early implementation of enteral nutrition for critically ill patients with stable haemodynamics.4–7
Nutritional therapy includes nutritional risk assessment, nutritional plan formulation and implementation. Timely and accurate assessment of patients’ nutritional risk is a prerequisite for providing reasonable nutrition therapy. At present, there are a wide variety of nutritional screening and evaluation tools. Single indicators include haemoglobin, albumin, prealbumin (PA), creatinine, urea, body mass index (BMI), skinfold thickness, middle arm circumference, indirect calorimetry8 and phase angle.9 Composite indicators include Nutrition Risk Screening 2002 (NRS2002) score,10 Critical Care Nutrition Risk Score11 and others. Each nutritional risk assessment tool has advantages and disadvantages. To date, there is no gold standard for nutritional risk assessment of critically ill patients.
Critically ill patients often present with infection. Moreover, procalcitonin (PCT), an inflammatory marker, usually reflects the infection.12 13 Studies have shown that PCT has a predictive value for the prognosis of critically ill patients.14 Therefore, in this study, we aimed to screen the risk factors for 28-day mortality of critically ill patients, and to establish a composite model of inflammatory and nutritional factors to predict 28-day mortality in critically ill patients.
We present the following article in accordance with the Strengthening the Reporting of Observational Studies in Epidemiology reporting checklist.
Methods
Study design and participants
A retrospective study was conducted on critically ill patients in the geriatric ICU of the First Affiliated Hospital of Nanjing Medical University from January 2020 to January 2021.
The inclusion criteria were as follows: (1) admission to the ICU, (2) enteral nutrition received within 24–48 hours after admission to the ICU and (3) age >18 years. The exclusion criteria were as follows: (1) ICU stay or death <24 hours, (2) incomplete medical records, (3) patients receiving parenteral nutrition and (4) patients receiving oral nutrition.
The goal of nutritional support was 25–30 kcal/kg/day calories and 1.2–2.0 g/kg/day protein7 for each patient, via nasogastric or nasointestinal tube. According to the patient’s disease and nutritional status, a nutrition formula was applied.
Outcomes and risk factors
All the enrolled medical records were subjectively reviewed. The continuous laboratory test results were recorded within 2 weeks of ICU admission. The Acute Physiology and Chronic Health Evaluation II (APACHE II) score, NRS2002 and BMI were withdrawn for 2 weeks after admission. Other clinical data, including age, gender, length of ICU stay and 28-day mortality, were also collected. The value of the indicator was the average value within 2 weeks after admission. In this study, we analysed the risk factors for 28-day mortality and evaluated the predictive values of single and composite predictors. Subgroup analysis was conducted according to nutritional scores and inflammatory status.
The primary outcome evaluated in this study was 28-day mortality. Secondary outcomes were 28-day invasive mechanical ventilation time and ICU stay.
Statistical analysis
GraphPad Prism V.8.0, SPSS V.26.0 and R V.4.2.1 software were used for statistical analysis. All continuous variables were tested for normal distribution. Normally distributed variables were expressed as mean±SD, and unpaired t-test was used for comparison between two groups. Non-normally distributed variables were expressed as the median and IQR, and the Mann-Whitney test was used for comparison between groups. Count data were expressed as percentages, and the Χ2 test was used for comparison.
Univariable and multivariable logistic regressions were used to screen for risk factors for 28-day mortality. In the multivariable analysis, predictors were selected using forward stepwise regression. Multicollinearity among variables was evaluated before the regressions were conducted. A nomogram based on the results of the multivariable analyses was constructed. Calibration, discrimination and clinical usefulness of the nomogram were calculated to evaluate its performance. The area under the receiver operating characteristic curve (AUROC) and concordance index were used to assess the predictive capacity of the prediction model. Concordance indices were obtained by creating 1000 bootstrap samples from the corresponding cohort and replicating the estimation process. A calibration curve was used to analyse the agreement between the nomogram and the actual observations. Decision curve analysis was performed to assess the clinical usefulness of the prognostic nomogram.
Receiver operating characteristic (ROC) curves were constructed to analyse the predictive power of single and composite predictors. According to the inflammatory and nutritional status, subgroup analysis was performed based on PCT and NRS2002 levels. Survival curves were drawn for subgroups using the critical value when the Youden’s index was the largest as the best cut-off value. Statistical significance was set at p<0.05.
Patient and public involvement
No patients or members of the public were involved in the design, conduct or reporting of this study. The study results were not disseminated to study participants.
Results
Clinical and demographic characteristics of the studied patients
A total of 459 patients were enrolled in this study. Among the total enrolled population, 158 patients were excluded from the analysis because they met one or more of the exclusion criteria (figure 1). Finally, data from 301 patients were analysed, including 214 males and 87 females, 183 survivors and 118 non-survivors. Among the 301 patients, cerebral haemorrhage was the main surgical cause and pneumonia was the main medical cause, with 78 (25.91%) cases of cerebral haemorrhage and 197 (65.45%) cases of pneumonia. Majority of the patients had comorbidities, including 154 (51.16%) cases of hypertension, 110 (36.54%) cases of heart failure, 82 (27.24%) cases of renal failure, 82 (27.24%) cases of cerebral infarction and 73 (24.25%) cases of diabetes.
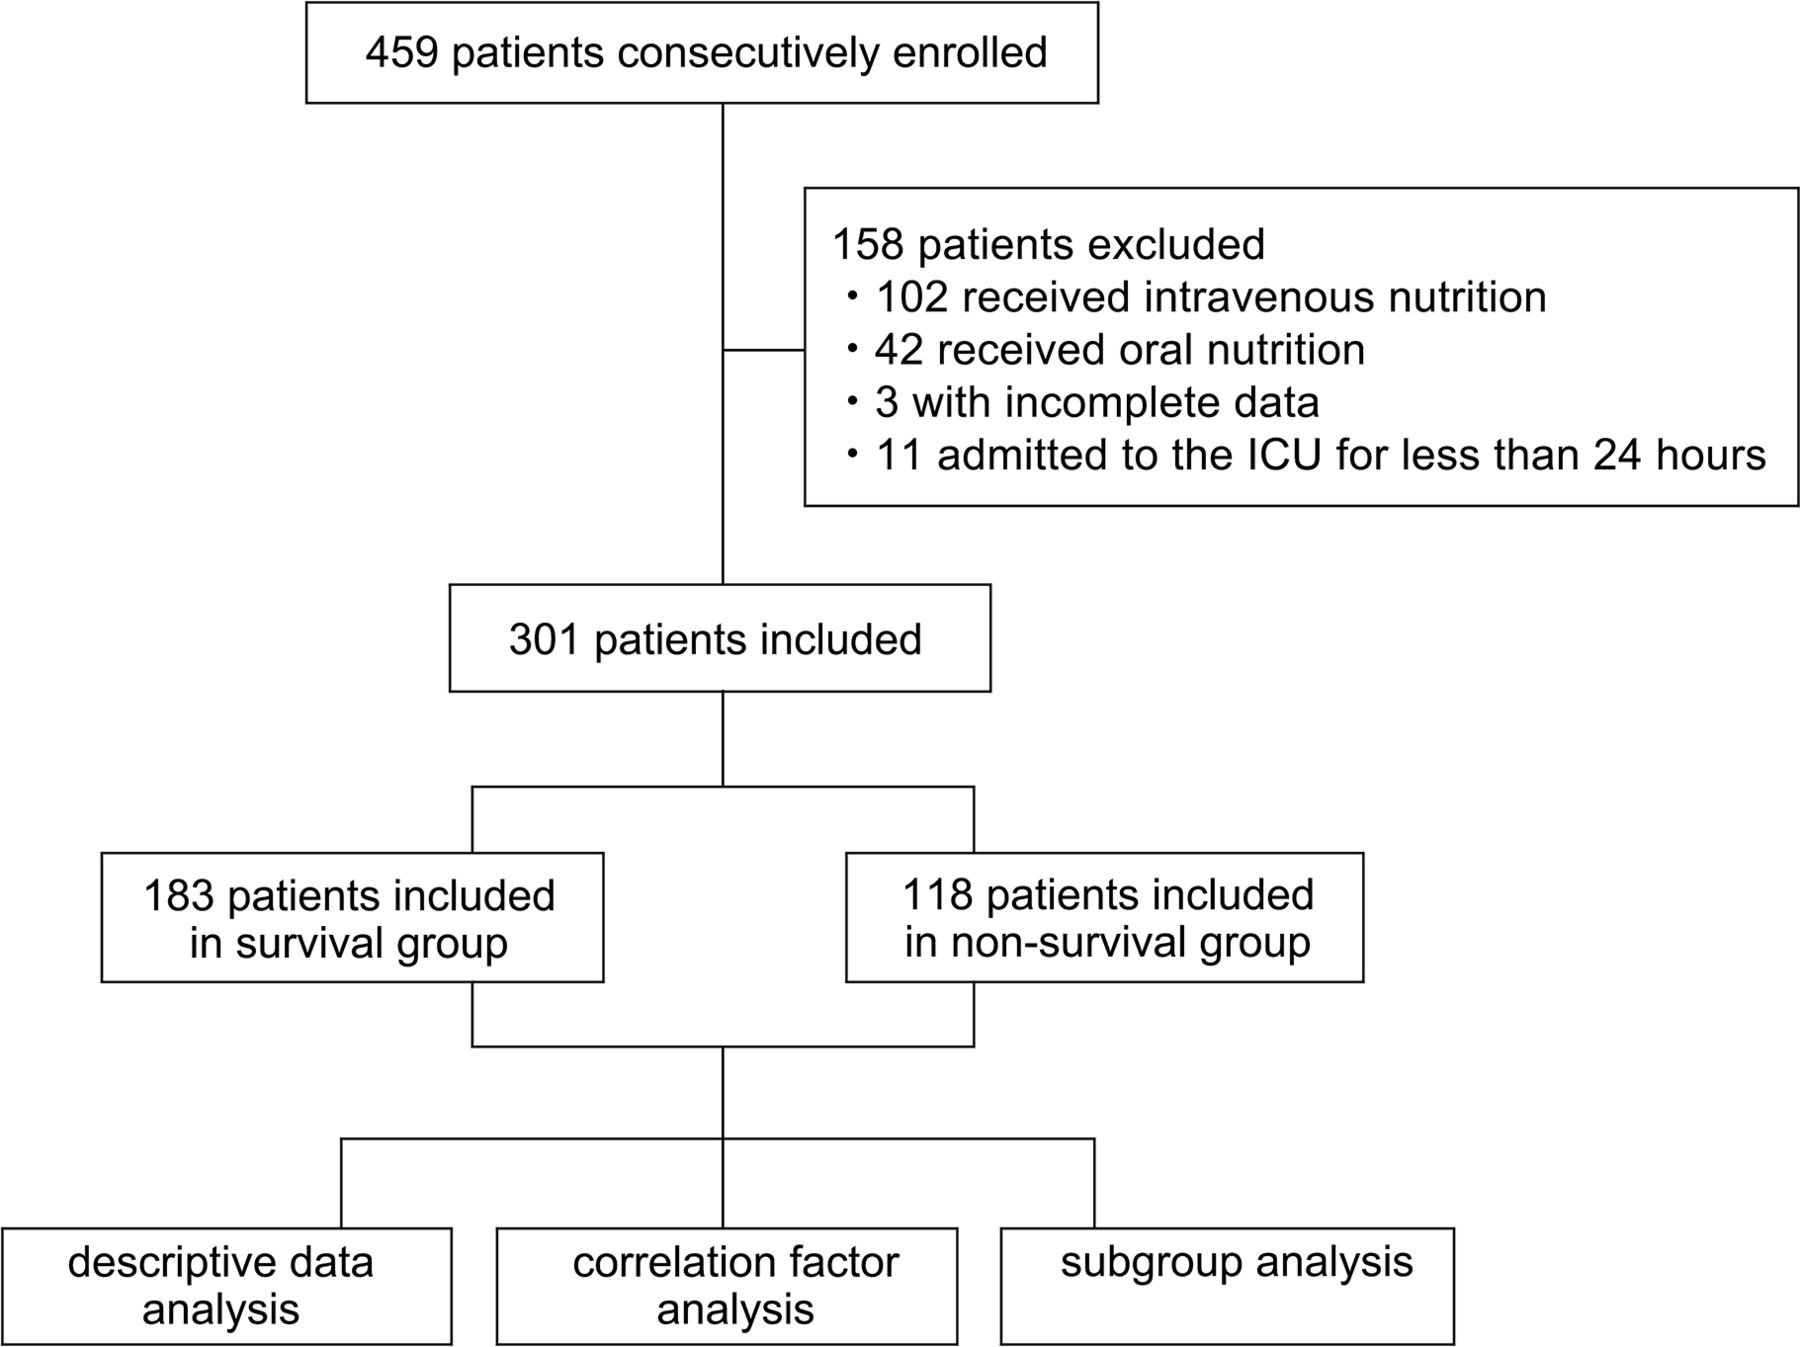
Patient records enrolment flow chart. ICU, intensive care unit.
Compared with the survival group, the non-survivors had higher APACHE II and NRS2002 scores; higher serum creatinine, urea, aspartate aminotransferase (AST) and PCT levels; lower PA and transferrin levels; and shorter ICU stay (p<0.05). There was no difference in 28-day invasive mechanical ventilation time between the two groups (table 1).
Clinical characteristics of study population
Screening of risk factors for 28-day mortality
In this study, univariable and multivariable logistic regressions were used to screen for risk factors for 28-day mortality in critically ill patients. Univariable regression showed that APACHE II, NRS2002, PA, serum creatinine, urea, AST, PCT and the ratio of PA to PCT (PA/PCT) affected the 28-day mortality of critically ill patients receiving enteral nutrition (p<0.05). NRS2002 and PA are major predictors for nutrition status, and PCT for inflammatory status. Inflammatory and nutritional factors interact in critical illness. We tried to find out better predictors that could combine inflammatory and nutritional status to predict the outcomes. All candidate factors screened out from univariable regression were entered into a multivariable logistic regression model. The result showed that APACHE II and PA/PCT were included in the final prediction model (p<0.05) (table 2).
Univariable and multivariable logistic regression analyses for critically ill patients with enteral nutrition
Prognostic nomogram for 28-day mortality
A prognostic nomogram for 28-day mortality was established using the two prognostic factors obtained from the multivariable logistic regression model (figure 2). A nomogram was generated by assigning a weighted score to each independent prognostic parameter. The APACHE II and PA/PCT scales ranged from 5 to 40 and 8 to 0, respectively. The highest total score was 180 points and the 28-day mortality risk ranged from 0.01 to 0.8. A higher score on the nomogram corresponded to a higher probability of death in 28 days.

Nomogram to calculate risk score and predict 28-day mortality. Scores were assigned for APACHE II and PA/PCT by drawing a line upward from the corresponding values to the ‘points’ line. The sum of all these scores, plotted on the ‘total points’ line, corresponds to predictions of 28-day mortality risk in critically ill patients. APACHE II, Acute Physiology and Chronic Health Evaluation II; PA, prealbumin; PCT, procalcitonin.
Performance evaluation of the prognostic nomogram
The AUROC and concordance index indicated that the predictive capacity of the model was 0.753 (95% CI 0.694 to 0.811) (figure 3A). The calibration plot demonstrated an adequate fit of the nomogram for predicting 28-day mortality, which was consistent with the Kaplan-Meier estimate (figure 3B). Decision curve analysis showed the net benefit obtained from the application of our nomogram (figure 3C).

Performance evaluation of the nomogram in the primary cohort. (A) Receiver operating characteristic curve analysis; (B) calibration curve analysis; (C) decision curve analysis. N=301. AUC, area under the curve.
Predictive values of each model on 28-day outcome
ROC curves were drawn based on the 28-day mortality for each index. PCT and APACHE II had higher predictive value, with AUROC at 0.71 and 0.72, respectively. In addition, NRS2002, PA, serum creatinine and urea also had good predictive values for the 28-day mortality of critically ill patients receiving enteral nutrition. The AUROCs were 0.60, 0.63, 0.68 and 0.63, respectively, and all p<0.01 (figure 4A).

Receiver operator characteristic (ROC) curves for single and composite indicators in predicting 28-day outcome. (A) ROCs for single indicators; (B) ROCs for PCT-based composite indicators; (C) ROCs for NRS2002-based composite indicators; (D) ROCs for PA-based composite indicators. N=301. APACHE II, Acute Physiology and Chronic Health Evaluation II; AST, aspartate aminotransferase; Crea, serum creatinine; NRS2002, Nutrition Risk Screening 2002; PA, prealbumin; PCT, procalcitonin; TRF, transferrin.
Based on the inflammatory status, we analysed the predictive value of the PCT-based composite model for patients’ 28-day outcomes. Results showed that PCT+AST had a higher predictive value, with an AUROC of 0.70. In addition, PCT+PA, PCT+NRS2002, PCT+transferrin, PCT+serum creatinine and PCT+urea also performed well in predicting 28-day outcomes of studied patients, with AUROCs of 0.63, 0.67, 0.65, 0.65 and 0.69, respectively, and all p<0.01 (figure 4B).
Based on nutritional risk, we analysed the predictive values of the NRS2002 based composite model for patients’ 28-day outcomes. The results showed that NRS2002+PA, NRS2002+transferrin, NRS2002+serum creatinine, NRS2002+urea and NRS2002+AST had good predictive values for 28-day outcomes. The AUROCs were 0.64, 0.61, 0.68, 0.66 and 0.63, respectively, and all p<0.01 (figure 4C).
Importantly, we combined the inflammatory and nutritional risks to establish a more effective model to predict patients’ 28-day outcomes. The results showed that triple indicator (PCT+NRS2002+PA) and double indicator (PA/PCT) performed better on predicting 28-day outcomes, with AUROCs at 0.73 and 0.71, respectively, and both p<0.01 (figure 4D).
In addition, the predictive value of the PA-based composite index for the 28-day outcome was less powerful (online supplemental figure S1).
Supplemental material
Survival analysis based on inflammatory and nutritional risks
In this study, patients were divided into groups based on whether the patients’ NRS2002 score was at a high nutritional risk (>3 or cut-off value 3.5) and whether the PCT level was in a severe inflammatory state (>0.5, or cut-off value 1.02). Differences in the 28-day outcomes of each group were compared. Survival curves were drawn, and the results showed that the overall survival rate of the patients in each group was significantly different at 28 days (p<0.01). For patients with higher inflammatory and nutritional risk, if PCT >0.5 and NRS2002 >3, the survival rate would be significantly lower than that of the other groups (figure 5).

Survival curves for critically ill patients with enteral nutrition. (A) Survival curves for groups divided by conventional values of NRS2002 and PCT; (B) survival curves for groups divided by cut-off values of NRS2002 and PCT. N=301. *P<0.05, **p<0.01. NRS2002, Nutrition Risk Screening 2002; PCT, procalcitonin.
Influences of different enteral nutritional formulae
According to nutritional formula, patients were divided into three groups: peptide-based formula group (PB), peptide step to whole protein formula group and whole protein formula group (WP). The results showed that after 3 days of enteral nutrition, the improvement in AST and alanine aminotransferase (ALT) in the PB group was higher than that in the other groups (p<0.05). After 7 days of enteral nutrition, the improvement in NRS2002 score in the PB group was higher than that in the other groups (p<0.01) (figure 6).

Improvement of critically ill patients with different nutritional formulae. (A) Improvement of AST after 3 days of enteral nutrition; (B) improvement of ALT after 3 days of enteral nutrition; (C) improvement of NRS2002 after 7 days of enteral nutrition. N=301. *P<0.05, **p<0.01. ALT, alanine aminotransferase; AST, aspartate aminotransferase; NRS2002, Nutrition Risk Screening 2002; PB, peptide-based formulae; PW, peptide step to whole protein formulae; WP, whole protein formulae.
APACHE II, NRS2002, serum creatinine, ALT and AST levels in the PB group were significantly higher than those in the other groups, while globulin levels were lower in the PB group than in the WP group at admission (p<0.05) (figure 7).

Severity scores, nutrition status and inflammatory markers in different nutrition formulae groups. (A) APACHE II score in different groups; (B) NRS2002 score in different groups; (C) globulin in different groups; (D) Crea in different groups; (E) ALT in different groups; (F) AST in different groups. N=301. *P<0.05, **p<0.01. ALT, alanine aminotransferase; APACHE II, Acute Physiology and Chronic Health Evaluation II; AST, aspartate aminotransferase; Crea, serum creatinine; NRS2002, Nutrition Risk Screening 2002; PB, peptide-based formulae; PW, peptide step to whole protein formulae; WP, whole protein formulae.
Discussion
The mortality rate in critically ill patients is generally high. In this retrospective study, we observed enterally fed patients in the ICU on their APACHE II score, NRS2002 score, serum creatinine, urea, AST, PCT, PA and PA/PCT, to identify risk factors for their clinical outcomes. Univariable analysis showed that patients in the non-survival group had more severe inflammation and nutritional deficiency, with worse multiorgan dysfunction. Multivariable logistic regression analysis showed that APACHE II was a risk factor for 28-day survival in critically ill patients receiving enteral nutrition. Meanwhile, PA/PCT ratio was a protective factor against the 28-day outcome. These results are consistent with previous studies.15 16 Based on the multivariable regression results, the APACHE II score and PA/PCT ratio were included to establish a prognostic nomogram. This nomogram showed satisfactory performance, as assessed by the area under the curve, calibration curve and decision curve analysis. Therefore, this nomogram can be effectively applied in clinical practice.
This nomogram model included two factors, the APACHE II score and PA/PCT ratio, in which, both were available from clinical data. Studies have shown that the APACHE II score can be used to assess disease severity and predict disease prognosis.15 Some studies have also shown that PA/PCT has a good predictive value for severe non-viral pneumonia in children treated with mechanical ventilation.16 This study demonstrated that PA/PCT ratio has a high predictive value for critically ill patients receiving enteral nutrition. On the basis of fully considering the relationship between inflammation and nutrition in critically ill patients, the predictive model included PA/PCT, an indicator with high predictive value, which greatly improved the predictive value of the model.
Compared with the survival group, non-survivors had lower PA levels and higher PCT levels, which indicated a high nutritional risk and inflammatory state related to a worse prognosis. Research has shown that the ratio of C reactive protein (CRP) to albumin has predictive value for in-hospital mortality in patients with sepsis.17 Li et al showed that CRP/PA ratio was independently associated with ICU mortality and length of stay.18 To comprehensively evaluate the state of inflammation and nutrition, this study used the ratio of PA to PCT as an indicator.16 ROC curve analysis proved that PA/PCT had a high predictive value for 28-day mortality for critically ill patients, and its AUROC was very close to that of APACHE II (p<0.01). In addition, PA/PCT is far more feasible and accessible than APACHE II.16
PCT is a precursor polypeptide to calcitonin. Under physiological conditions, serum PCT levels are extremely low (<0.05 ng/mL). In viral and fungal infections, PCT remains at a low level,19 20 but in bacterial infections, PCT can surge to a very high level.21 Studies have shown that in patients with sepsis, the use of PCT to guide the early discontinuation of antibacterial drugs can reduce the 28-day mortality rate and hospitalisation costs.22 A meta-analysis also reported that elevated serum PCT levels were closely related to all-cause mortality in patients with sepsis.14 In addition, PCT could be a good predictor of prognosis in critically ill patients.13 The results of this study proved that PCT could be predictive of 28-day outcomes in enterally fed critically ill patients.
Guidelines issued by the American Society of Parenteral and Enteral Nutrition in 2016 recommended the use of NRS2002 and NUTRIC (Nutrition Risk in Critically ill) scores for the nutritional risk assessment of patients.7 The NUTRIC score is more complex, involving plenty of parameters including age, APACHE II score, SOFA (Sequential Organ Failure Assessment) score, complications, duration of ICU stay and interleukin-6. Therefore, its clinical use is practically limited. Compared with the NUTRIC score, NRS2002 score is simpler and more practical. NRS2002 score is an evidence-based nutritional risk score that can be used to screen nutritional risks for patients, to evaluate the effect of nutritional support and to predict the clinical outcomes of hospitalised patients. Our results also proved that NRS2002 could be a predictor for 28-day mortality in critically ill patients, and when combined with PA, PCT, transferrin, serum creatinine, urea and AST levels, its predictive value would be further improved.
The results of this study showed that PA, NRS2002 and PCT were predictive of 28-day mortality of critically ill patients with nasal feeding, and the combined index of PA, NRS2002 and PCT had a high predictive value. Patients were divided into subgroups according to the NRS2002 scores and PCT levels. The results showed that the highest survival rate occurred in the low inflammatory state and nutritional risk group, and the lowest survival rate in the high inflammatory state and nutritional risk group. These results indicate that composite indicators of inflammation and nutrition could be reliable for evaluating the 28-day mortality of critically ill patients. Therefore, for critically ill patients, nutritional screening should be performed as early as possible, and appropriate nutritional support plans should be formulated, combined with infection control and inflammation regulation, to improve clinical outcomes. Although the critically ill patients included in this study are a very heterogeneous group (different ages, comorbidities, surgical and medical causes), the coexistence of inflammation and malnutrition remains a common phenomenon, so the conclusions of this study can be generalised to most critically ill patients.
This study has several limitations. First, this study was a retrospective design and the research data were relatively limited; second, this was a single-centre clinical study, and the average age of the patients was older, so subgroup analysis based on age could not be performed; finally, the clinical outcome of this study was set to 28 days of survival or death. The outcome was not followed up to a longer period.
In conclusion, critically ill patients are characterised by obvious nutritional deficiency, a higher inflammatory state and poor overall prognosis. As single indicators, PCT, APACHE II, NRS2002, PA, serum creatinine and urea can be used in disease evaluation and prognosis prediction for enterally fed critically ill patients. As composite indicators, PA/PCT and PA+NRS2002+PCT performed well in the severity evaluation and prognosis prediction. This study developed a prognostic nomogram including APACHE II and PA/PCT for predicting 28-day survival in critically ill patients receiving enteral nutrition, and the nomogram had good predictive value.
Data availability statement
Data are available at: https://figshare.com/articles/dataset/EN3_original_data_xlsx/19960202.
Ethics statements
Patient consent for publication
Ethics approval
This study was approved by the Medical Ethics Committee of the First Affiliated Hospital of Nanjing Medical University (approval number: 2020-SR-055). All the patients enrolled in this study received enteral nutrition. The data of all patients were reviewed and analysed anonymously, and the requirement for informed consent was waived.
Acknowledgments
The authors sincerely acknowledge Professor Qiulun Lu for inspiring the work, assisting in the research and providing technical help.
References
Supplementary materials
Supplementary Data
This web only file has been produced by the BMJ Publishing Group from an electronic file supplied by the author(s) and has not been edited for content.
Footnotes
Contributors Study concept and design—YH. Acquisition of data—JW, NZ and XC. Analysis and interpretation of data—JW and HQ. Drafting of the manuscript—JW and YH. Critical revision of the manuscript for important intellectual content—JW and NZ. Statistical analysis—JW, NZ and XC. Administrative and technical support—YH. Guarantor—YH.
Funding This work was supported by the National Natural Science Foundation of China (nos. 82070475 and 81770287 to YH).
Competing interests None declared.
Patient and public involvement Patients and/or the public were not involved in the design, or conduct, or reporting, or dissemination plans of this research.
Provenance and peer review Not commissioned; externally peer reviewed.
Supplemental material This content has been supplied by the author(s). It has not been vetted by BMJ Publishing Group Limited (BMJ) and may not have been peer-reviewed. Any opinions or recommendations discussed are solely those of the author(s) and are not endorsed by BMJ. BMJ disclaims all liability and responsibility arising from any reliance placed on the content. Where the content includes any translated material, BMJ does not warrant the accuracy and reliability of the translations (including but not limited to local regulations, clinical guidelines, terminology, drug names and drug dosages), and is not responsible for any error and/or omissions arising from translation and adaptation or otherwise.