Article Text

Abstract
Objective This study aimed to identify the associated factors of low and medium household (HH) dietary diversity (DD) compared with high DD among marginalised households in rural Bangladesh.
Methods Through the Suchana baseline survey, data on 5440 households from Sylhet and Moulvibazar districts of Bangladesh was collected between November 2016 and February 2017. Household DD was categorised as low, medium or high based on number of food groups consumed during the last 24 hours. Primary outcome measure was household DD; multinomial logistic regression was to determine independent correlations between outcome and independent variables.
Results Of the households examined, 0.72%, 31.8% and 67.5% had low, medium and high DD, respectively. Around 99% and 97% of households consumed cereals and vegetables. Cereals, fruits and legumes accounted for 36%, 18% and 16% of total food expenditure; vegetables only represented 8% of total expenditure; 70% of total monthly expenditure was on food items. Compared with high DD, low DD was significantly associated with severe food insecurity, not receiving remittance, not being supported by social safety-net programs, household size of 6–10, household income and expenditure on food below-median. Severe food insecurity was the strongest predictor of low DD. Age, occupation and educational status of the household head, amount of land owned and presence of a homestead garden, fish production and domestic violence were not significantly associated with DD.
Conclusion Our findings suggest that nine out of ten households were food insecure, and nearly two-thirds of households had high DD. Severe food insecurity was significantly associated with low DD. Expenditure on food items amounted to nearly two-thirds of total household expenditure. Diversification of income-generating activities would provide more sources of income to the households, allowing the households to spend more on non-cereal food items and increase the household dietary diversity.
- NUTRITION & DIETETICS
- PUBLIC HEALTH
- EPIDEMIOLOGY
Data availability statement
Data are available on reasonable request. The data that support the findings of this study are available on request from the corresponding author. The data are not publicly available due to privacy or ethical restrictions.
This is an open access article distributed in accordance with the Creative Commons Attribution Non Commercial (CC BY-NC 4.0) license, which permits others to distribute, remix, adapt, build upon this work non-commercially, and license their derivative works on different terms, provided the original work is properly cited, appropriate credit is given, any changes made indicated, and the use is non-commercial. See: http://creativecommons.org/licenses/by-nc/4.0/.
Statistics from Altmetric.com
STRENGTHS AND LIMITATIONS OF THIS STUDY
Since it was a cross-sectional study, data are susceptible to biases including recall bias and non-response bias
Analysis was relatively quick and inexpensive to conduct
Ethical integrity was maintained
Out of eight divisions of Bangladesh, analysis was limited to only Sylhet Division
Introduction
Other than breast milk, no single food item can provide an adequate intake of all of the nutrients required for optimal health and growth of children under 6 months of age.1 Therefore, consumption of a diversity of food items by children over 6 months is essential, though, children’s dietary diversity is not similar across the globe. Various dietary patterns that contribute to the consumption of adequate nutrients have emerged in different nations.1 2 Dietary diversity is a key indicator of nutritional status3 and correlates with energy consumption and micronutrient intake, and hence is an important driver for growth and development, especially for young children.4 Thus, high dietary diversity corresponds to an increased nutrient intake and leads to better nutritional status.5 The World Declaration and Plan of Action to improve global nutritional well-being and food consumption emphasized the need for the development of appropriate, culture and context-specific national action plans.1 Notable international dietary guidelines1 6 acknowledge the importance of consumption of an increased number of food groups, and food items within each food group to ensure adequate nutrient intake, good health and better birth outcomes. Furthermore, studies have shown that higher intake of various food items such as fat, sugar and salt are associated with an increased risk of chronic diseases; therefore, the promotion of increased dietary diversity and reduced intake of these food items is essential to avert chronic diseases.7 Thus, to assess the food consumption pattern reflected by dietary diversity and indicators of optimal nutritional intake, it is critical to estimate the intake of energy and essential nutrients to ensure the optimal nutrition intake for healthy individuals.1 Reduced dietary diversity is significantly more prevalent in developing countries as Bangladesh8 and is typically more prominent in the poorest segment of the population.7 The factors that lead to low dietary diversity are multifaceted and include predominant dependency on starchy foods as staples (which may constitute around 84% of the total energy consumed,9 low intake of animal source protein and household food insecurity.8–10 Natural shocks, such as flooding in Bangladesh, can also negatively affect dietary diversity among marginalised populations. Previous reports have identified various underlying mechanisms that contribute to higher food insecurity and consequently low dietary diversity due to calamities, such as direct crop loss, loss of both productive and non-productive assets, and a reduction in the number of days of paid day labouring work.11 Composite indicators have been developed to reflect overall dietary quality by encompassing several dietary measures, such as the number of food groups consumed, along with the quantity consumed.2 12 However, gathering information on both dietary quality and quantity is time-consuming and may be constrained in developing countries due to a lack of adequate resources. Evidence indicates that consumption of animal and fish origin food products, which have high protein and micronutrient contents, is more strongly associated with nutrition status than the amount of energy consumed10 13; therefore, sufficient intake of protein and micronutrients is required to ensure a healthy life.10 The literature suggests that most relevant studies on food consumption have focused extensively on the factors associated with dietary energy consumption, rather than dietary quality and diversity.10 Dietary diversity is usually low in rural parts of low-income and middle-income countries,8 and inadequate food intake is of dietary concern in resource-constrained settings. Furthermore, dietary quality and diversity can be used as proxy for nutritional adequacy.4 14 If associated factors affecting dietary diversity can be identified, then policy makers can formulate intervention strategies for implementation in this population living in the region of concern. Hence, in light of the lack of an evidence-based data on low dietary diversity in rural Bangladesh, objectives of this empirical study were to identify the associated factors of low and medium household dietary diversity while compared with high dietary diversity among marginalised population participating under Suchana programme in rural areas of Sylhet region. The 7-year Suchana programme started in 2015 and is being implemented in 157 unions (clusters), the smallest administrative unit in Bangladesh, of Sylhet and Moulvibazar districts. Sylhet has the poorest performance in terms of poverty reduction and key nutrition and health indicators of all divisions in Bangladesh.15 Sylhet also has a high fertility rate and one of the lowest immunisation rates in the country,15 coupled with deep social inequalities, high levels of household food insecurity and frequent natural calamities. The Suchana programme has adopted a collective approach, delivering both nutrition-sensitive and nutrition specific interventions, primarily to prevent stunting within the first 1000 days of life, that is, from conception to a child’s second birthday. The major programme interventions are directed towards improving nutrition governance: turning political commitments to practice, improving access to and utilisation of nutrition services, ensuring better nutrition through improved economic status, providing social and behavioural change communication to enhance the beneficiaries’ knowledge and skills, and promote appropriate infant and young child feeding practices. Through these interventions, Suchana aims to support around 235 500 of the most vulnerable households in the region to bring lasting change in the factors associated with chronic malnutrition, which have been passed over for generations in Bangladesh.16 Suchana appreciates the evidence on the positive impact of nutrition-specific interventions on undernutrition and has employed a pre–post evaluation to generate better evidence of the impact of nutrition-sensitive interventions on undernutrition.16
Materials and methods
Setting and study design
In the baseline survey, data on 5440 households in 80 unions containing 640 villages were collected between November 2015 and February 2016. The data collection period encompasses the harvest time of Aman rice, the transplantation period of Boro rice and is just before the transplantation period of Aus rice.17 The sample size was determined by considering a 6% assumed reduction in the prevalence of stunting among children 12–23 months of age after implementation of the intervention for 3 years. The minimum sample size calculation was undertaken using the STATA clustersampsi module, assuming 80% power, a 5% level of significance and an intracluster correlation of 0.01.
The sampling procedure primarily entailed the selection of 80 out of 157 unions by lottery, then vulnerable villages in the selected unions were identified through consultation with local elites, government officials and representatives. A participatory rural appraisal strategy18 involving the village household heads or representatives was used to identify the poor and very poor households in each village. The term ‘poor’ and ‘very poor’ were context-specific and reflected the villagers’ perception of each household’s level of poverty and vulnerability, thus these criteria varied between villages. A list of vulnerable households was made for each village, and these households were visited to confirm their vulnerable status. A structured questionnaire was administered to evaluate the households’ vulnerability according to the Suchana beneficiary inclusion criteria.
Selection of variables
Primarily, consumption data for the last 24 hours and last 7 days were collected for the following individual food groups using a standard questionnaire: (1) cereals (corn, rice, wheat, any other cereals or foods made from cereals, eg, bread, noodles, shuzi or other products), (2) white roots and tubers (white potatoes, white yam, other foods made from roots), (3) vitamin A-rich vegetables and tubers (pumpkin, carrot, sweet potato, other locally available vitamin A-rich vegetables that are orange inside, for example, red sweet pepper), (4) dark green leafy vegetables (including wild forms and locally available vitamin A-rich leaves for example, amaranth, spinach), (5) any other vegetables that are not vitamin A-rich or dark, green and leafy (tomato, onion, eggplant, other locally available vegetables), (6) vitamin A-rich fruits (ripe mango, ripe papaya, 100% fruit juices made from these and other locally available vitamin A-rich fruits), (7) any other fruits that are not vitamin A-rich (including wild fruits and 100% fruit juice made from these), (8) organ meat (liver, kidney, other organ meat), (9) fleshly meat (beef, lamb, goat, pork, rabbit, game, chicken, duck, other birds), (10) eggs (from chicken, duck, any other eggs for example, koel), (11) fish and seafood (small, medium, large fresh fish, dried fish and shellfish, including crab), (12) legumes, nuts and seeds (dried beans, dried peas, lentils, nuts, seeds, foods made from these, for example, hummus, peanut butter), (13) milk and milk products (milk, cheese, yoghurt, other milk products), (14) oils and fats (oil, fats, ghee or butter added to food or used for cooking), (15) sweets (sugar, honey, sweetened soda, sweetened juice drinks, sugary foods, eg, chocolates, candies, cookies, cakes), (16) spices, condiments (eg, black pepper, salt, soy sauce, hot sauce) and (17) miscellaneous drinks (tea, bottled juice, coffee, fizzy drinks). The 17 individual items were then grouped into the following 12 categories: cereals, roots and tubers, vegetables, fruits, meat/poultry/offal, eggs, fish and seafood, pulses/legumes/nuts, milk and milk products, oils/fats, sugar/honey, miscellaneous drinks and spices/condiments.
The Household Dietary Diversity Score (HDDS) was determined as a measure of food access.6 This continuous measure is determined by summing the number of food groups consumed in the 24 hours preceding the survey by the household members with the help of a standard questionnaire proposed. However, if the person responsible for the household food preparation mentioned in the last 24 hours were out of the ordinary, for example, the household had a funeral, feast or most of the household members were absent, then data for the previous day was collected. We also collected data on the household food consumption for the previous ordinary 7 days before the survey.
We categorised the HDDS as low, medium or high if the household consumed ≤3 food groups, 4–6 food groups or seven or more food groups, respectively. We excluded cereals, spices/condiments and miscellaneous drinks as these staple foods are regularly consumed as part of a typical Bangladeshi diet. Therefore, the HDDS was based on 10 food groups.
The Household Food Insecurity Access Scale was employed to quantify food insecurity following the Food and Nutrition Technical Assistance’s Guideline, which is a continuous measure of the degree of food insecurity in a household and categorised as food secure, mildly food insecure, moderately food insecure or severely food insecure.19
The other variables we examined primarily can be divided into four household domains: characteristics of the household head (age, occupation, education status, religion), general household characteristics (household size, presence of any household member above 50 years of age, number of children under 5 years of age, household food security status, the type of terrain of the homestead land, whether the respondent experienced domestic violence, whether households were under a social-safety net program, distance to the nearest market (km)), land and utilisation of land (whether households have a home garden, whether households have fish production, area of accessible homestead land (decimals), area of accessible cultivable land (decimals), livestock ownership (number), poultry ownership (number)), and the household’s financial status (number of earning members in the household, the yearly income of the households (Tk; US$1.00=~BDT84), whether any remittance was received from abroad, having loans, having savings, expenditure on food except for cereals (last month, BDT), expenditure on non-food items, money spent during shocks/hazards in last 12 months (BDT), and expenditure on tobacco in last 12 months (BDT)). The conceptual framework is shown in figure 1.
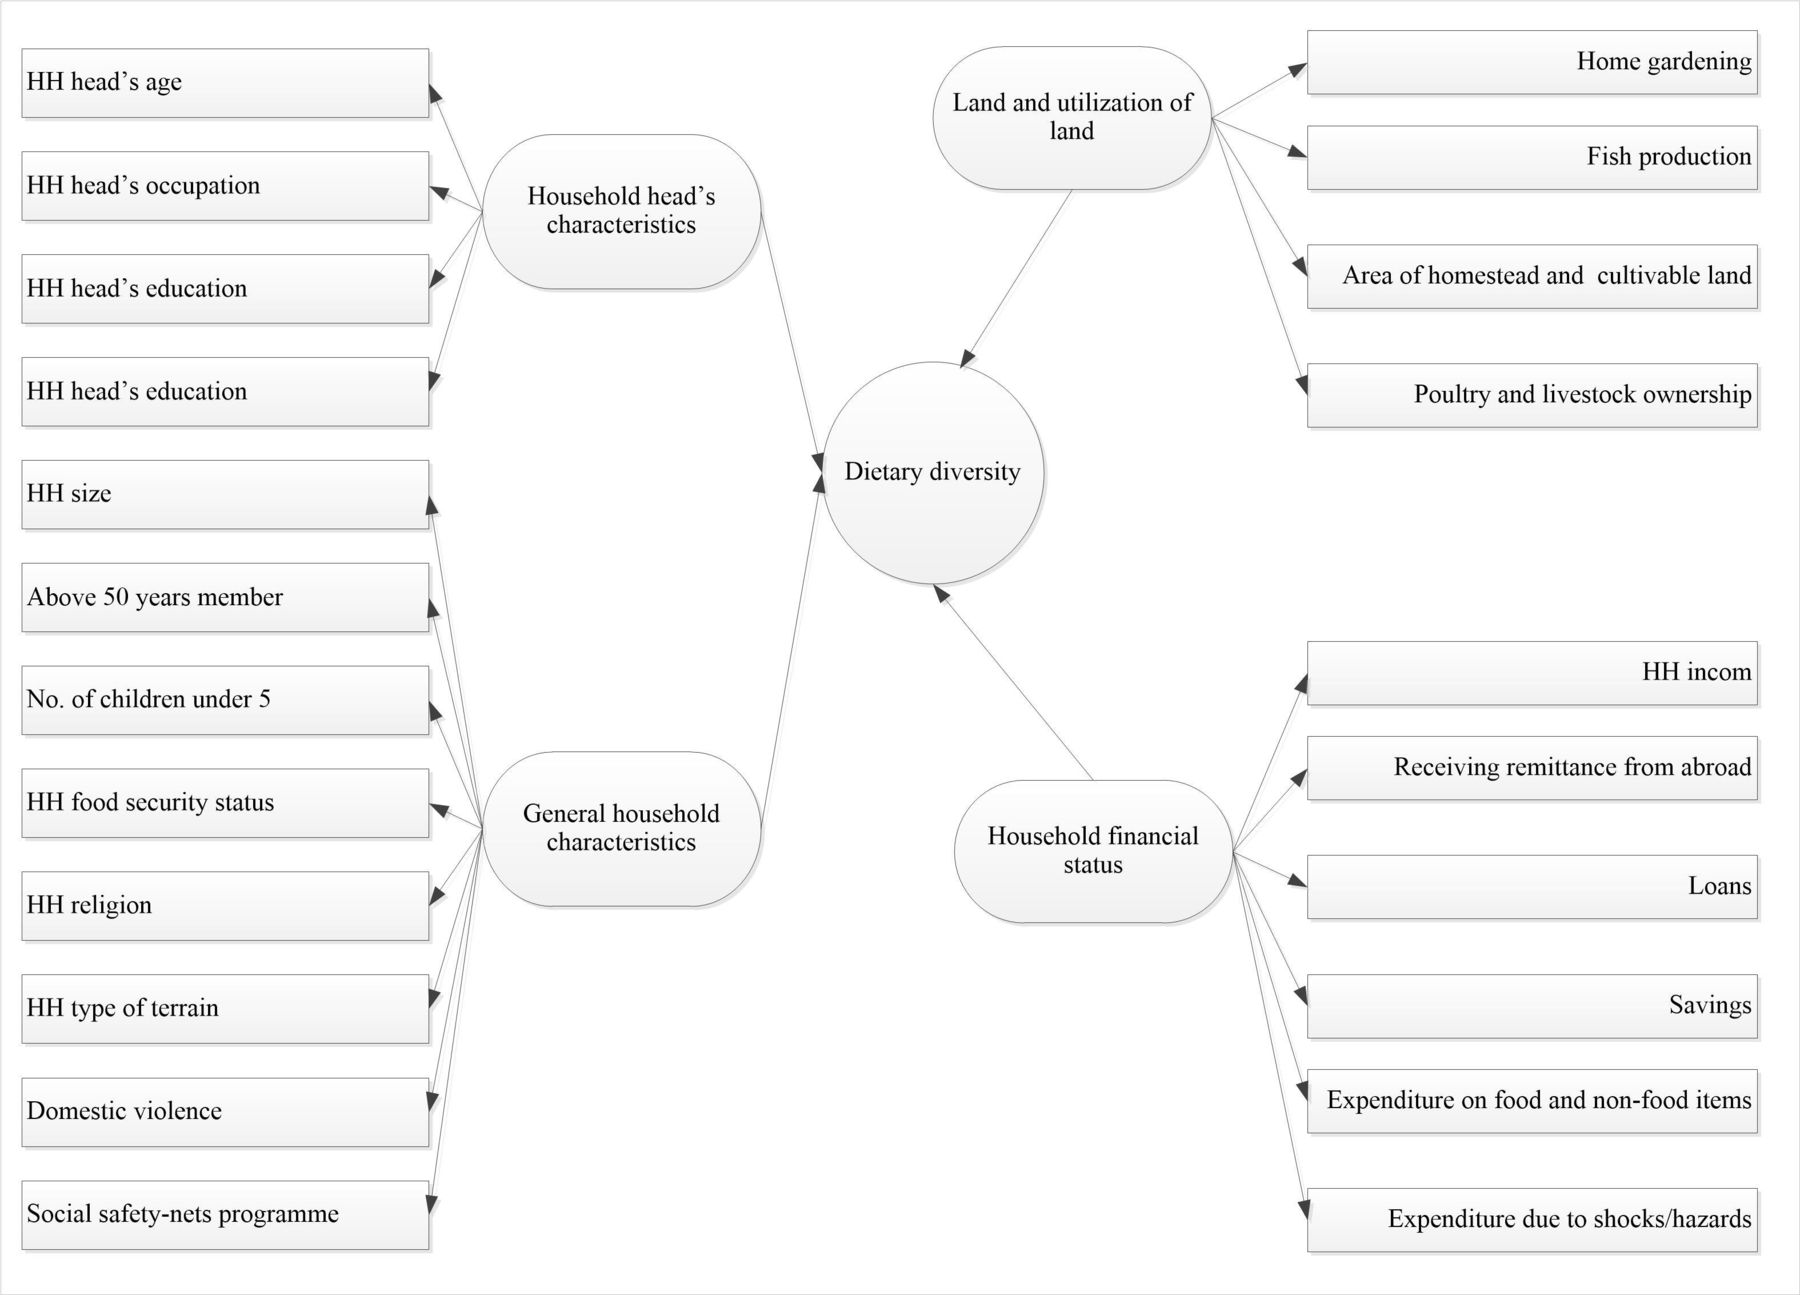
Conceptual framework
Statistical analyses
All statistical analyses were conducted in STATA V.15 (STATA). Descriptive statistics were used to describe the variables, and reported as percentages and 95% CIs and numbers for categorical variables and means with 95% CI and numbers for continuous variables. Only proportions are reported in graphs. The significance and effect size of the bivariate and multiple relationships between the outcome and response variables were examined via simple and multinomial logistic regression models; effect sizes were reported as relative risk ratios (RRRs) with 95% CI. Variables with a p<0.2520 21 in the simple regression models were entered into the final multinomial logistic regression model. Statistical significance was considered as a p<0.05. STATA’s svyset linearised command was used to adjust for the effect of clustering. Collinearity diagnostics were used to assess the level of correlation between the independent variables.
Patient and public involvement
Patients and public were not actively involved in formulating the research question and or protocol development, including the outcome measures. However, for smooth operation of the field works, local elites/influential persons, for example, teachers, religious persons and local government council members were informed about the study.
Results
Data on 5440 households were analysed, of which 64.5%, 31.8% and 0.72% had high, medium and low dietary diversity, respectively. The average HDDS was 7.16 out of 12, including cereals, spices/condiments and miscellaneous drinks. In total, 99.5% and 88.6% of households had consumed cereals and fish, respectively. Around, 61% of household heads were day labourers, and half of them did not have any schooling. Around 44.5% of households had members over the age of 50 years. Around 86% of the households were food insecure, 90% were Muslim, and around two-thirds of the households had loan(s) and one-third had savings. Around, 26% and 29% of households had over 10 decimals of homestead and cultivable lands, respectively. Only around 4% of households had fish in ponds, and 42% had a home garden. Around, 17% of households had received any remittance from abroad and 21.7% of households were under social-safety net programs. The average age of the household head was 39.8 years; the average yearly household income was BDT 104,905.8 and the average number of earning members in each household was less than 2. On average, one in every two households had livestock, and every household had around four poultry. The average expenditure on food (except for cereals) per household during the month preceding the survey was BDT 4172.61. The average proportion of expenditure on food items was around 70% of the total monthly household expenditure. These results are presented in table 1.
Characteristics of the surveyed households (N=5440)
Moreover, 36% of the total household expenditure on food items in the 30 days before the survey was on cereals and only 8% was on vegetables. Around 90% of food consumed was purchased and only around 5% was self-produced. These results are summarised in figure 2.

Method of food acquisition.
Unadjusted bivariate analysis revealed that compared with trading as an occupation, the household head being a day labourer was significantly associated with both low dietary diversity (RRR 2.38 (95% CI 1.34 to 4.23), p<0.01) and medium dietary diversity (RRR 1.84 (95% CI 1.50 to 2.26), p<0.001) relative to high dietary diversity. In addition, having no members above 50 years, mildly and severely food-insecure households, receiving remittances from abroad, spouse(s) having no savings, access to 10 or fewer decimals of homestead land, the household having no homestead garden, household not being under any social safety-net programs, household size more than 10, yearly household income, expenditure on food, livestock ownership and poultry ownership below the median value, the household having no fish production and households with a low number of earning members were all significantly associated with both low and medium dietary diversity compared with high dietary diversity. All of these results are presented in table 2.
Factors associated with HH dietary diversity (reference: high dietary diversity) in the unadjusted model (N=5440)
Our multinomial logistic regression showed that relative to food-secure households, severe food insecurity was independently and significantly associated with low dietary diversity relative to high dietary diversity (adjusted RRR (aRRR) 3.69 (95% CI 1.21 to 11.2), p<0.05). Moreover, relative to food-secure households, both severe (aRRR: 2.56 (95% CI 2.02 to 3.24), p<0.001) and moderate food security (aRRR 1.41 (95% CI 1.16 to 1.71), p<0.05) were significantly associated with medium dietary diversity relative to high dietary diversity. Not receiving remittances from abroad (aRRR 1.91 (95% CI 1.21 to 3.01), p<0.01), not being under a safety-net program (aRRR 1.96 (95% CI 1.13 to 3.39), p<0.05), having 6–10 household members (vs less than six members) (aRRR 1.72 (95% CI 1.10 to 2.94), p<0.05)), and monthly food expenditure below the median (aRRR 5.65 (95% CI 3.45 to 9.27), p<0.001) were all significantly associated with low dietary diversity relative to high dietary diversity. In contrast, not receiving remittances from abroad (aRRR: 1.27 (95% CI 1.07 to 1.51), p<0.01), not having savings (aRRR: 1.16 (95% CI 1.03 to 1.31), p<0.05), yearly household income below the median (aRRR 1.17 (95% CI 1.02 to 1.34), p<0.05), number of livestock owned below the median (aRRR 1.15 (95% CI 1.01 to 1.31), p<0.05), no ownership of fish in a pond (aRRR 1.47 (95% CI 1.06 to 2.03), p<0.05), monthly food expenditure below the median (aRRR 2.41 (95% CI 2.06 to 2.82), p<0.001) and the number of earning members (aRRR 0.91 (95% CI 0.85 to 0.98), p<0.05) were independently, significantly associated with medium dietary diversity relative to high dietary diversity. The collinearity diagnostics suggested that mean variance inflation factor (a measure of the amount of multicollinearity in a set of multiple regression variables) was 1.19 and the highest correlation was observed between household size and the presence of any member above 50 years-of-age (r=0.41). These results are shown in table 3.
Factors associated with household dietary diversity (reference: high dietary diversity) in the adjusted model
Discussion
This study investigated the drivers of dietary diversification and food expenditure among marginalised households in rural Bangladesh using the latest cross-sectional data from the Suchana baseline survey. Excluding cereals, spices/condiments and miscellaneous drinks, the average HDDS was 5.38, and 67.5% of households had high dietary diversity. This rate is comparable to previous studies conducted in rural Bangladesh.3 8 10 22 23 On an average, food items accounted for around 70% of total household expenditure. Our findings also suggest low household dietary diversity, but not homestead gardening or fish production, was significantly associated with severe food insecurity. In addition, the amount of homestead and cultivable land were not significantly associated with low dietary diversity. However, receiving remittances from abroad, higher household income, a larger number of earning members in a household and the amount of expenditure on food (except for cereals) were significant predictors of high dietary diversity.
The food consumption patterns of rural Bangladeshi households are evidently driven by multiple factors, including the region or terrain, religion and food preferences.3 Recent research suggests that average consumption of four or more of the 12 food groups indicates optimal dietary diversity in terms of both macronutrients and micronutrients.6 Thus, with an average consumption of over seven food groups, it could be said that our study population consumed a diverse diet enriched in both macronutrients and micronutrients, despite being a marginalised segment of society. Previous studies identified that larger household size was positively associated with dietary diversity.24 A larger household size indicates a greater range in the age of the members. Thus, a greater diversity of food is expected to be consumed in larger households due to the varied consumption patterns of different age groups. In addition, as food-related expenditure is expected to be higher in households with more members, a more diverse food menu can be expected. A higher number of household members may also result in more time for home gardening or poultry rearing, which would diversify the household diet.10 A previous study suggested fewer than 10% of rural households have a home garden, and these households consumed smaller amounts of cereals and had a higher dietary diversity than households without a home garden. However, we found a household size of 6–10 members was negatively associated with dietary diversity, and home gardening or the amount of cultivable land was not associated with dietary diversity. The discrepancies in these findings could be due to the vulnerability of the selected population. Around 40% of households had a home garden, and around 70% had access to less than 10 decimals (0.1 acre) of homestead or cultivable land; these values may not be sufficient to have an impact on dietary diversity either through home gardening or crop diversification. In addition, the mere presence of a home garden does not guarantee diversified production, and adoption of new technologies and techniques are required to produce the variety of food required to diversify the diet.
This analysis provides evidence of a close association between the severity of food insecurity (both severe and moderate) and reduced dietary diversity. Our findings are consistent with several studies that suggested household food security status is significantly associated with household dietary diversity.4 Household dietary diversity is a key indicator of household food security status, which in turn represents the household energy availability.4 Dietary diversity was also previously associated with changes in the price of cereals, fruits and vegetables, dairy products, meat and oils.10 Literature suggests that expenditure on non-cereal food items in countries like Bangladesh correlates with the price of cereals; thus, lower prices for cereal staples such as rice correspond to higher non-cereal food diversity.10 Our data showed that over 90% of the food items were purchased, with less than 5% self-produced. Thus, the limited self-production of food and limited purchasing capacity due to the socioeconomic vulnerability of the households could explain the low dietary diversity of the study population. Our findings suggested that lower expenditure on food items (except for cereals) is strongly associated with reduced dietary diversity. Low household income and not receiving remittances from abroad were both independently associated with low and medium dietary diversity. These associations were expected, as they were observed in a previous study.3 Conversely, a higher number of earning members in a household was associated with higher household income and expenditure on food items, which is likely to increase dietary diversity. Fish is the most common source of animal protein for the Bangladeshi population.10 Though less than 4% of our sampled households were involved in fish production, over 88% of the households had consumed fish, and only spent 16% of their total expenditure on purchasing fish. The significant positive relationship between fish production and medium dietary diversity indicates that increasing homestead fish production may further increase dietary diversity. Experience of domestic violence could be viewed as a proxy indicator of women’s empowerment. A woman’s status within a household and her ability to access resources and take critical household decisions, including those related to food consumption, play a key role in any household’s food security status.25 Our results demonstrate a significant crude association between any experience of domestic violence and medium household dietary diversity. However, domestic violence was not significantly associated with any level of dietary diversity after adjusting for other variables. Improving the country’s food security status is expected to have a positive impact on household dietary diversity.10 Further qualitative research in Bangladesh is necessary to understand the underlying relationships between dietary diversity and household socioeconomic indices, such as income and food security, as well as the independent role of dietary diversity in growth and development.4
The Suchana programme only targeted marginalised households, thus the inferences derived from this study are applicable to this marginalised subgroup and may not necessarily represent the determinant factors among the general population of Bangladesh.26 Food price has a major influence on the pattern of food consumption, and increased food price is associated with reduced food group consumption in marginalised households.10 However, we could not include the price of food as a variable due to the unavailability of reliable data.
Limitations
Large sample size, use of appropriate techniques for selecting poor and very poor households, and proper methodology for sampling and statistical analyses are also strengths of this study. A possibility of recall bias remains regarding the dietary diversity, as information for the 24-hour recall preceding the survey was gathered through maternal responses. Since one of the inclusion criteria of this study children was to be aged 0–23 months, the study faced high dropout rates due to the time gap between screening and verification, and data collection from the targeted households. When required, we replaced any household in the sampling frame by selecting the immediate prior household in an anticlockwise direction, in order to survey the required number of households by phase/area and by age group according to our randomly generated listing. Our study had several strengths, one of them was conducting this analysis was affordable and relatively quick. Also, ethical integrity was maintained, with use of verified methods for planning, conducting, and analysing the research data. One notable limitation of this study was out of eight divisions of Bangladesh, analysis was restricted to only Sylhet Division, hence the findings may not be generalisable in other regions or locations.
Conclusion
Low dietary diversity was strongly associated with the severity of food insecurity, and expenditure on food items amounted to nearly two-thirds of total household expenditure. Despite around 9 out of 10 households being food insecure, almost two-thirds of households had high dietary diversity. Receiving remittances from abroad, increased household income, and increased spending on non-cereal food items were also significantly associated with high dietary diversity in the surveyed households. Therefore, improving the food security scenario in rural Bangladesh would increase dietary diversity. Diversification of income-generating activities would provide more sources of income to the households, allowing the households to spend more money on non-cereal food items and increase the household dietary diversity.
Data availability statement
Data are available on reasonable request. The data that support the findings of this study are available on request from the corresponding author. The data are not publicly available due to privacy or ethical restrictions.
Ethics statements
Patient consent for publication
Ethics approval
This study was approved by the Research Review Committee and Ethical Review Committee, the two obligatory components of the institutional review board of icddr,b. Informed written consent was obtained from study participants. Ethics Committee’s approval ID# 00001822.
Acknowledgments
Suchana baseline survey data were assessed in this study; this intervention is being implemented by a consortium led by Save the Children, particularly the Monitoring, Evaluation, Accountability and Learning (MEAL) team, with support from the Foreign, Commonwealth and Development Office (FCDO) and the European Union. icddr,b acknowledges with gratitude the commitment of Save the Children, FCDO, and EU to its research efforts. We acknowledge with gratitude the commitment of the Government of the People's Republic of Bangladesh to icddr,b’s research. We sincerely acknowledge the following donors for providing unrestricted support to icddr,b’s efforts and advancement of its strategic plan: icddr,b is grateful to the government of Bangladesh, Canada, Sweden and the UK for providing core/unrestricted support. We would like to acknowledge the invaluable contributions of Save the Children as lead agency of Suchana, our technical partners Helen Keller International, World Fish, and International Development Enterprises, and the implementing partners Friends In Village Development Bangladesh (FIVDB), Rangpur Dinajpur Rural Services (RDRS), and the Center for Natural Resource Studies (CNRS) who played critical roles in generating and refining the data collection tools.
Footnotes
Contributors MJR and MA conceptualised the manuscript. MA, MAH and MJR performed statistical analysis. MA, MJR and ASGF drafted the manuscript. ASGF, MJR, MAH, FDF, MA and TA contributed to implementation of the survey. ASGF supervised the work and reviewed the manuscript and is guarantor. TJS, MAH, FDF, SMTA, SR, FN, ASGF and TA contributed to revision of the final draft for submission. All authors are responsible for the final content of the manuscript.
Funding This study was made possible by the committed contribution of Foreign, Commonwealth and Development Office (Grant number: 204131-103).
Competing interests None declared.
Patient and public involvement Patients and/or the public were involved in the design, or conduct, or reporting, or dissemination plans of this research. Refer to the Methods section for further details.
Provenance and peer review Not commissioned; externally peer reviewed.