Article Text

Abstract
Objectives We designed a population-based survey in Kashmir to estimate the seroprevalence of SARS-CoV-2-specific IgG antibodies in the general population aged 18 years and above.
Setting The survey was conducted among 110 villages and urban wards across 10 districts in Kashmir from 17 October 2020 to 4 November 2020.
Participants Individuals aged 18 years and above were eligible to be included in the survey. Serum samples were tested for the presence of SARS-CoV-2-specific IgG antibodies using the Abbott SARS-CoV-2 IgG assay.
Primary and secondary outcome measures We labelled assay results equal to or above the cut-off index value of 1.4 as positive for SARS-CoV-2-specific IgG antibodies. Seroprevalence estimates were adjusted for the sampling design and assay characteristics.
Results Out of 6397 eligible individuals enumerated, 6315 (98.7%) agreed to participate. The final analysis was done on 6230 participants. Seroprevalence adjusted for the sampling design and assay characteristics was 36.7% (95% CI 34.3% to 39.2%). Seroprevalence was higher among the older population. Among seropositive individuals, 10.2% (247/2415) reported a history of COVID-19-like symptoms. Out of 474 symptomatic individuals, 233 (49.2%) reported having been tested. We estimated an infection fatality rate of 0.034%.
Conclusions During the first 7 months of the COVID-19 epidemic in Kashmir Valley, approximately 37% of individuals were infected. The reported number of COVID-19 cases was only a small fraction of the estimated number of infections. A more efficient surveillance system with strengthened reporting of COVID-19 cases and deaths is warranted.
- COVID-19
- epidemiology
Data availability statement
Data are available upon reasonable request.
This is an open access article distributed in accordance with the Creative Commons Attribution Non Commercial (CC BY-NC 4.0) license, which permits others to distribute, remix, adapt, build upon this work non-commercially, and license their derivative works on different terms, provided the original work is properly cited, appropriate credit is given, any changes made indicated, and the use is non-commercial. See: http://creativecommons.org/licenses/by-nc/4.0/.
Statistics from Altmetric.com
Strengths and limitations of this study
The findings of our study are based on a representative sample of the population.
The laboratory test used for the detection of SARS-CoV-2-specific IgG antibodies in serum samples provides valid results.
We report seroprevalence estimates adjusted for sampling design and test performance.
Even though we adjusted the weighted seroprevalence estimates for test performance using manufacturer-provided sensitivity and specificity (100% and 99.63%, respectively), we did not quantify the test validity in-house.
Because of lack of age and gender-specific mortality data, we could not estimate age and gender-specific infection fatality rates.
Introduction
On 11 February 2020, the WHO announced that the disease caused by the SARS-CoV-2 would be named COVID-19.1 In Kashmir, the first case of COVID-19 was confirmed in Srinagar city on 18 March 2020.2 The government imposed the first phase of the lockdown in Kashmir on 24 March 2020. During this phase, interstate travel remained suspended. People were barred from moving outside except in an emergency. Except for essential services, all government and private offices were advised to work from home. Universal masking was made mandatory. The lockdown was extended until 31 May 2020 and later relaxed in a phased manner.
Mild or asymptomatic infections are common in COVID-19 and are an important source of infection transmission.3 4 Such cases are less likely to be detected by a surveillance system based on reverse-transcriptase PCR (RT-PCR) testing. Therefore, the number of reported RT-PCR positive cases is an underestimate of the true number of infections in a population.
Seroprevalence surveys have been conducted in various countries at different stages of the current epidemic among various population groups.5–14 Seroprevalence surveys provide a more accurate estimate of past infection, improve understanding of the infection transmission dynamics and guide public health response.15
We designed this survey with the primary objective to estimate the seroprevalence of SARS-CoV-2-specific IgG antibodies in the adult population of Kashmir Valley.
Methods
We designed a population-based cross-sectional study. The study covered all the 10 districts of Kashmir, a valley in northern India (figure 1). We completed data collection in 3 weeks, from 17 October 2020 to 4 November 2020.

Location of the 10 districts and seroprevalence (%) by district. Numbers in parentheses indicate a 95% CI for seroprevalence.
Sample size
Based on the results of a previous study conducted in July 2020, we speculated that, by October 2020, the prevalence would have increased to around 20%.16 We calculated the minimum sample size based on an anticipated seroprevalence of 20%, an absolute precision of 2% and a design effect of 2. We used OpenEpi to make sample size calculations.17 We adjusted the sample size for a possible non-response of 10% to obtain a minimum size of 3376. We decided to select 3600 individuals from nine of the 10 districts (except district Srinagar). To obtain precise estimates for district Srinagar, sample size estimation was made for the district separately. We used a design effect of 1.5, an anticipated seroprevalence of 20% and absolute precision of 2% to obtain a sample size of 2302 for the district, further increasing to 2400 to account for non-response. We thus targeted a total sample size of 6000 (3600+2400).
Participants
All adults ≥18 years of age were eligible to participate in the study. We selected eligible participants using a three-stage stratified cluster sampling technique. We listed all clusters in the valley using the census 2011 data.18 Within each of the 10 districts in the valley, clusters were stratified into urban and rural clusters. We selected clusters within each of the 20 strata by probability proportionate to size sampling. Except for district Srinagar which we oversampled to obtain precise seroprevalence estimates for, 10 clusters were randomly selected from each district. We selected 20 clusters from district Srinagar. We divided each selected cluster into four equal areas and chose a central location within each of the four areas as the starting point. Thereafter, we approached consecutive households to enrol at least 10 eligible participants. We thus identified a total of 440 random locations within 110 clusters in 10 districts. We invited all eligible adults in a household for participation.
Variables
The primary outcome variable of interest was SARS-CoV-2-specific IgG antibodies. In addition, we obtained information from participants about their age, gender, history of COVID-19-like symptoms in the 3 months before the interview date, history of contact with a COVID-19 patient and history of COVID-19 testing.
Procedure
We informed eligible adults about the purpose and the procedure of the study. Study participation was voluntary. Participants were interviewed by health personnel specifically trained for the interview. Interview responses were recorded in an Epicollect5 form.19 Once the interview was completed, a trained phlebotomist collected 3–5 mL of venous blood from the antecubital vein under aseptic precautions into a red-top collection tube containing a clot activator. The tube was left standing, undisturbed, for at least 30 min for clot formation. The sample was later transported to a central facility for centrifugation. Centrifuged samples were transported to a central laboratory for further processing and analysis. Serum samples were tested for the presence of SARS-CoV-2-specific IgG antibodies using the Abbott SARS-CoV-2 IgG assay. The assay uses chemiluminescence to detect IgG antibodies against the SARS-CoV-2 nucleocapsid protein. The reported sensitivity and specificity of the assay are 100% (95% CI 95.89% to 100.00%) and 99.63% (99.05% to 99.90%), respectively.20 As recommended by the manufacturer, we labelled assay results equal to or above the cut-off index value of 1.4 as positive for SARS-CoV-2-specific IgG antibodies.
Statistical methods
We report unweighted seroprevalence estimates in percentages. We used the Agresti-Coull procedure to calculate a 95% CI for seroprevalence estimates.21 A weighted estimate of seroprevalence is provided. To calculate survey weights (inverse of sampling probability), we used the estimated population of the districts. We used the census 2011 data and growth rates from Sample Registration System to estimate the population of the districts in 2020.18 22 Survey weights obtained were further adjusted for non-response and age and sex structure (poststratification weights). We further adjusted the weighted seroprevalence estimates for test performance to calculate ‘weighted seroprevalence adjusted for test performance’. We did this using the formula: Weighted seroprevalence adjusted for test performance=(Weighted seroprevalence+Test specificity-1)/(Test sensitivity+Test specificity-1).23
We used the manufacturer-provided sensitivity and specificity in the above formula.20 We used the extremes of the manufacturer-provided 95% CI of the test sensitivity and specificity (upper limit of sensitivity, lower limit of specificity; and lower limit of sensitivity, upper limit of specificity) to report sensitivity analyses.
We analysed the difference in seroprevalence estimates across levels of a categorical variable using a χ2 test adjusted for the sampling design.
We estimated the number of SARS-CoV-2 infections by multiplying the weighted seroprevalence adjusted for test performance with the estimated population of the valley. To estimate the number of infections per reported case, we divided the estimated number of SARS-CoV-2 infections by the reported number of COVID-19 cases 2 weeks before the survey date. We calculated the infection fatality rate by dividing the reported number of deaths by the number of estimated infections, assuming a 3-week lag time from infection to death.24
We analysed the data using Stata V.15 (StataCorp. 2017. Stata Statistical Software: Release 15. College Station, Texas: StataCorp).
Patient and public involvement
No patients or members of the public were involved in this study.
Results
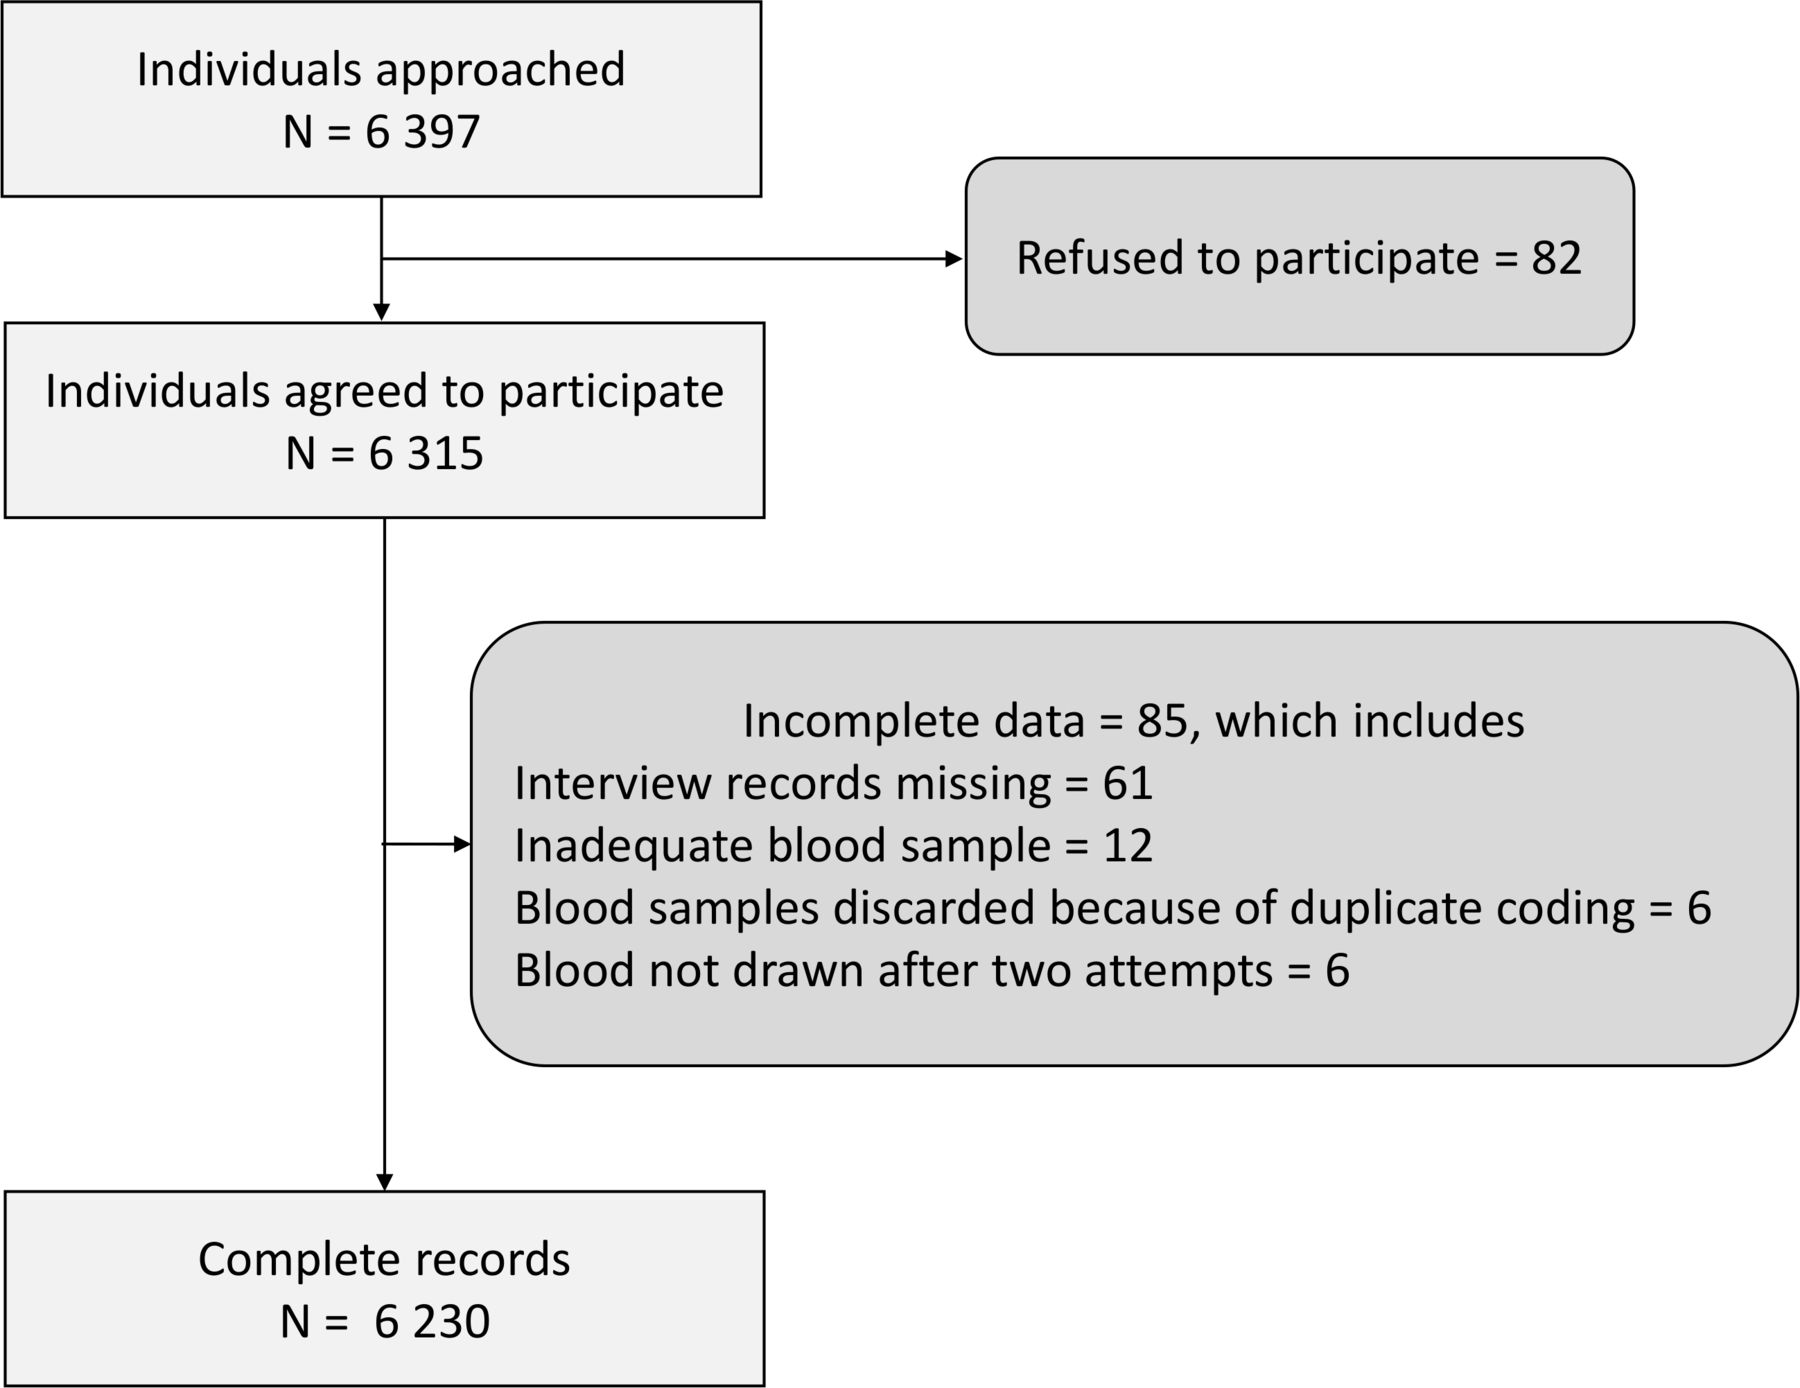
We enumerated 6397 individuals ≥18 years from 3077 households and 110 clusters (34 urban clusters and 76 rural clusters) between 17 October 2020 and 4 November 2020. Of the 6397 eligible individuals, 6315 (98.7%) agreed to participate and were enrolled. The final analysis was done on a sample of 6230 participants (figure 2).

Participant flow.
Of the 6230 participants, 1513 (24.3%) were between 18 and 30 years of age, 2672 (42.9%) were aged 30–49 years, 1643 (26.4%) were aged 50–69 years and 402 (6.4%) were 70 years and older (table 1). There was equal representation from males and females, and 3364 (54.0%) resided in a rural area. Of the 3104 females, 56 (1.8%) reported being pregnant at the time of the survey. Four hundred and seventy-four (7.6%) reported COVID-19-like symptoms in the 3 months preceding the survey, and 439 (7.0%) reported to have ever come in contact with a known COVID-19 case. One thousand and ninety-two (17.5%) reported having been tested for COVID-19 using RT-PCR or a rapid antigen test previously, of whom 176 (16.2%) reported to have tested positive for the disease.
Characteristics of study participants
We found an overall unweighted seroprevalence of 38.8% (95% CI 37.6% to 40.0%). The seroprevalence ranged from 28.5% in district Kulgam to 43.1% in district Pulwama (figure 1 and online supplemental file 1). The overall weighted seroprevalence (adjusted for sampling design) was 36.9% (95% CI 34.5% to 39.4%). The weighted seroprevalence adjusted for test performance was 36.7% (95% CI 34.3% to 39.2%) (table 2). On sensitivity analyses, the weighted seroprevalence adjusted for test performance ranged from 36.3% (95% CI 33.9% to 38.8%) to 38.4% (95% CI 35.9% to 41.0%) (table 3).
Supplemental material
Seroprevalence of SARS-CoV-2-specific IgG antibodies by participant characteristics
Sensitivity analyses for seroprevalence at extremes of test performance
Seroprevalence was lowest among participants aged 18–29 years (33.5%; 95% CI 29.8% to 37.4%) and was higher in older age groups. Seroprevalence was highest in those aged 70 years and above (45.1%; 95% CI 37.6% to 52.8%). Seroprevalence was not significantly different among males and females (p=0.34). The seroprevalence among urban residents was 40.0% (95% CI 36.1% to 43.9%), slightly but not significantly higher than rural residents (35.3%; 95% CI 32.2% to 38.5%, p=0.07) (table 2).
One in five participants (1145/6230, 18.4%) self-reported history of at least one chronic disease (table 1). Hypertension (815/6230, 13.1%) and diabetes mellitus (314/6230, 5.0%) were the most commonly reported chronic diseases (online supplemental file 2). Seroprevalence was significantly higher in participants who self-reported history of chronic disease (41.7%; 95% CI 37.2% to 46.4%) as compared with those who did not report a history of chronic disease (36.0%; 95% CI 33.5% to 38.7%) (table 2).
Supplemental material
Among participants who reported a history of COVID-19-like symptoms, seroprevalence was 47.2% (95% CI 37.7% to 56.9%) compared with 36.1% (95% CI 33.7% to 38.6%) among participants who did not report such symptoms. Seroprevalence was higher among those who reported contact with a known COVID-19 case (45.0%; 95% CI 38.1% to 52.0%) than participants who did not report any history of such contact (36.3%; 95% CI 33.9% to 38.8%) (table 2).
Seroprevalence was not significantly related to being tested for COVID-19 (RT-PCR). However, those who reported a positive RT-PCR COVID-19 test had significantly higher seroprevalence (81.7%; 95% CI 74.7% to 87.1%) as compared with those who reported a negative RT-PCR COVID-19 test (38.6%; 95% CI 33.1% to 44.5%) (table 2).
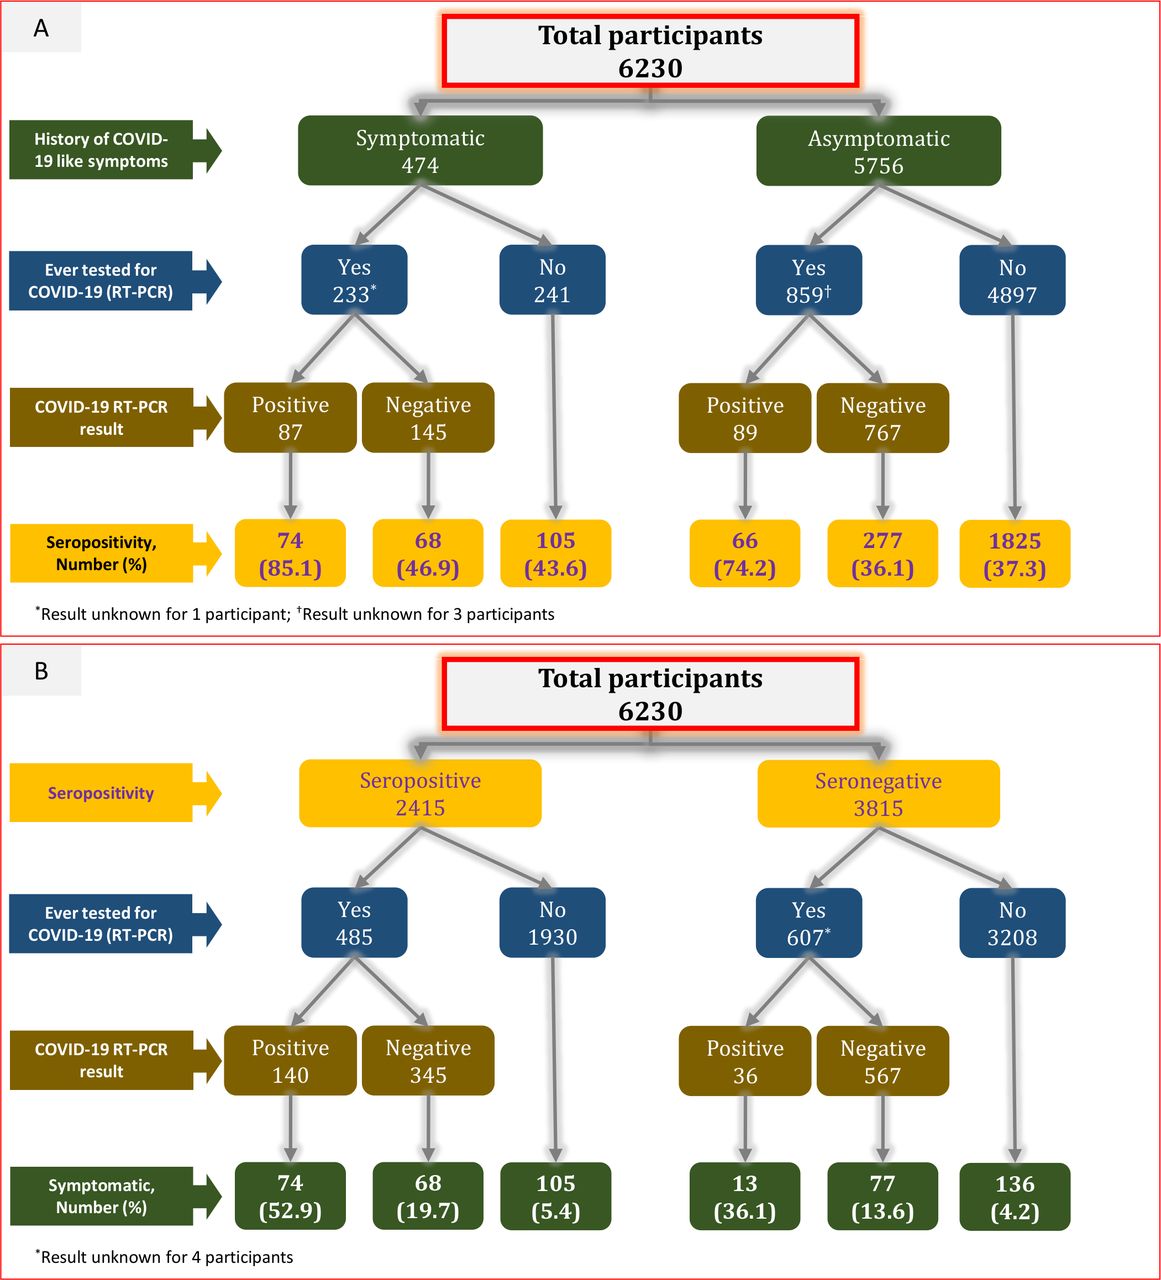
Among 2415 seropositive individuals, only 247 (10.2%) reported a history of COVID-19-like symptoms. Only 20.1% (485/2415) of the seropositive individuals were tested for COVID-19 (RT-PCR). Among 474 who reported a history of COVID-19-like symptoms, 233 (49.2%) were tested for COVID-19 (RT-PCR). Among 4897 individuals who did not report a history of COVID-19-like symptoms and were never tested for COVID-19 (RT-PCR), 1825 (37.3%) were seropositive (figure 3).

(A) Seropositivity by the history of COVID-19-like symptoms, RT-PCR testing and test result. (B) History of COVID-19-like symptoms by seropositivity, RT-PCR testing and test result.
Among 36 participants who reported a positive RT-PCR COVID-19 test but were seronegative, the duration between COVID-19 RT-PCR test and serological testing ranged from 9 to 101 days. In only four of these 36 participants, the duration between the COVID-19 RT-PCR test and the serological test was 14 days or less. Of the remaining 32 participants, 21 did not report a history of COVID-19-like symptoms, 9 did not report a history of contact with a known COVID-19 case and 8 reported neither a history of COVID-19-like symptoms nor a history of contact with a known COVID-19 case.
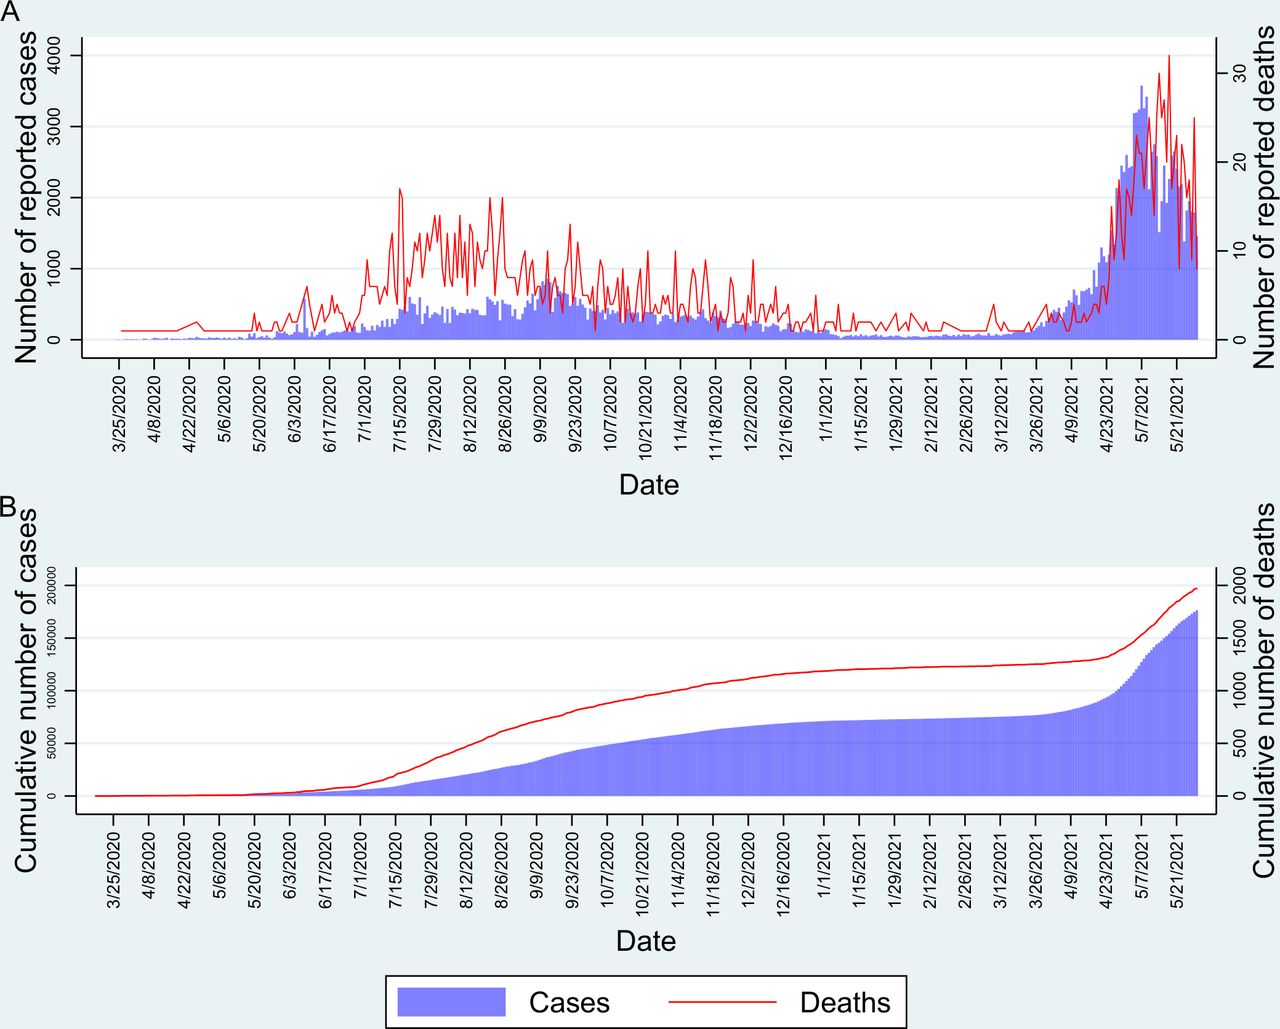
We estimated that there were a cumulative number of infections at 1 673 484 (95% CI 1 564 047 to 1 787 482) among adults aged ≥18 years in the valley by 3 October 2020, two weeks before the start of the survey. If we assume that the seroprevalence was similar to the overall seroprevalence in the population not included in our study (<18 years of age), then the estimated cumulative number of infections in the valley by 3 Oct 2020 was 2 791 933 (95% CI 2 609 354 to 2 982 119). Considering that the cumulative number of reported COVID-19 cases was 47 071 by 3 October 2020 (figure 4), we estimate the number of infections per reported case as 59.3 (95% CI 55.4 to 63.4). The number of reported COVID-19 deaths after a 3-week lag period (on 24 October 2020) was 955. Thus, we estimated the infection fatality rate as 0.034% (95% CI 0.032% to 0.037%). Of the total estimated SARS-CoV-2 infected persons, only 1.69% (47 071/2 791 933) were reported. Of the total reported COVID-19 cases, 2.03% (955/47 071) died.
(A) Daily cases and deaths in Kashmir since the start of the COVID-19 pandemic. (B) Cumulative number of cases and deaths in Kashmir.
Discussion
We report the results of a seroprevalence survey conducted in Kashmir from October to November 2020, seven months after the appearance of the first local COVID-19 case. The COVID-19 pandemic is rapidly evolving worldwide. In Kashmir, several important events happened since we completed our survey. From 16 January 2021, COVID-19 vaccination was introduced in a phased manner. Healthcare workers were given preference during the first phase. From 1 March 2021, the vaccine was made available for people ≥60 years of age and those with chronic diseases in the age group of 45–59 years. However, especially during the early phases of the COVID-19 vaccination campaign, many people were hesitant to receive the vaccine doses. During the same time, SARS-CoV-2 variants of concern began to emerge and circulate. The daily number of COVID-19 cases started to rise again. The ‘second wave’ in April 2021 was more explosive than the ‘first wave’ at the beginning of the pandemic. The fear of the disease had diminished, and COVID-19 appropriate behaviour was no more a norm. The government and the people were caught unawares. There were several reports of a possible ‘second infection’ and reports of cases among previously vaccinated individuals. Given these developments, the current seroprevalence in Kashmir will be higher than what we report in this study.
The results of our study indicate that by the first week of October 2020, nearly 7 months after the appearance of the first laboratory-confirmed COVID-19 case on 18 March 2020, close to 37% of the valley’s population aged ≥18 years had been infected. Our results suggest that the cumulative number of SARS-CoV-2 infections by the first week of October 2020 was nearly 2.8 million, with an estimated infection fatality rate of 0.034%. Seroprevalence did not differ by gender but was higher in older age groups.
The findings of our study are based on a representative sample of the population. The laboratory test used for the detection of SARS-CoV-2-specific IgG antibodies in serum samples provides valid results.20 25 We report seroprevalence estimates adjusted for sampling design and test performance.
The overall adjusted seroprevalence of around 37% indicates that, by October 2020, a large proportion of the valley’s population had been infected with the virus. Easing of lockdown, being fed up with the restrictions and non-adherence to prevention norms are the possible reasons. Using several assumptions about the test sensitivity and specificity to calculate adjusted seroprevalence estimates yielded small differences.
Several factors potentially influence the seroprevalence rates. These include population density, social and demographic structures of the population, governmental policies and the extent of their implementation, immunity level of the population, time since the start of infection transmission, adherence to infection prevention guidelines, quality of contact tracing and quarantine, and possibly the geography and environment of an area. The emergence of several variants of concern and the introduction of COVID-19 vaccination will also influence population immunity. Herd immunity in the context of COVID-19 is a matter of debate as reports of a second infection continue to pour in.26
Comparison with previous reports suggests that, by October 2020, the seroprevalence had increased almost 10-fold since July 2020.16 27 The second of the three nationwide seroprevalence surveys in India conducted in August to September 2020 reports an overall seroprevalence of 6.6%, ranging from 5.2% in rural areas to 16.9% in urban slums.28 A nationwide survey conducted in December 2020 to January 2021 reported an overall seroprevalence of 24.1% ranging from 4.9% to 44.4% across districts.29 Kashmir is thus not a low-infection area. Being an oft-visited tourist area, Kashmir is at an increased risk of infection transmission. Adherence to COVID-19 appropriate behaviour (use of face masks in public, frequent handwashing, physical and social distancing) has been poor. The experience of a ‘second wave’ of COVID-19 in April to June 2021, the appearance of virus variants and the introduction of vaccination programmes warrant robust surveillance of the epidemic.
The seroprevalence of SARS-CoV-2 IgG antibodies was higher in older age groups. During the early period of the pandemic, people were adherent to social distancing and other non-pharmaceutical interventions because of a fear of the disease and administrative restrictions. With time, administrative restrictions were relaxed, fear of the disease attenuated and people became fed up with the social restrictions. This led to an increase in the number of reported COVID-19 cases and provided the population, including older age groups, an opportunity to contract the infection. That older people have an increased risk of symptomatic and more severe disease is now well known.30 31 However, age-based differential susceptibility to SARS-CoV-2 infection antibody response and the reasons thereof are still a grey area and need further understanding. Existing literature might suggest that the more mobile and socially active young have a higher risk of infection.6 7 However, this should not imply that the elderly have a decreased susceptibility to SARS-CoV-2 infection or a decreased antibody response.32 On the contrary, several studies suggest that the seroprevalence of SARS-CoV-2-specific IgG antibodies is higher in the older age groups and particularly so in more dense population groups.4 5 8–11 13 Furthermore, SARS-CoV-2 antibody levels have been reported to be higher in older people.12
The seroprevalence of SARS-CoV-2-specific IgG antibodies did not differ significantly by gender, though the figure was slightly higher for females. These findings are consistent with the available literature.6 13 Difference in seroprevalence by gender has been suggested by some studies, and females have been reported to have lower antibody levels.5 7 9 11 12 14 33
Urban areas are more densely populated than rural areas, accelerating the transmission of infections in the population. The seroprevalence of SARS-CoV-2-specific IgG antibodies is thus expected to be higher in urban areas, especially during the early phases of an epidemic. However, as the epidemic progresses, the seroprevalence gap between urban and rural areas will wane off. We estimated an adjusted seroprevalence of 40.0% (95% CI 36.1% to 43.9%) in urban areas as compared with 35.3% (95% CI 32.2% to 38.5%) in rural areas (p=0.07).
People with a chronic disease experience more severe COVID-19 symptoms and are more likely to die when compared with people with no chronic disease.34 We found a higher proportion of symptomatic infection among participants with a self-reported history of chronic disease (78/1145, 6.8%) as compared with participants with no chronic disease (169/5085, 3.3%) (online supplemental file 3). Little is, however, known about the risk of infection in patients with chronic disease. We found a significantly higher seroprevalence among participants with a self-reported history of chronic disease (table 2). This finding needs further research for corroboration and possible explanations.
Supplemental material
People with a self-reported history of COVID-19-related symptoms, a contact with a known COVID-19 case or a positive COVID-19 RT-PCR had a higher seroprevalence as compared with their complement. Among seropositive individuals, only 10.2% reported being symptomatic. The percentage of asymptomatic infections, thus, was 90%. However, only 49% of individuals with a history of COVID-19-like symptoms were tested using RT-PCR. We also estimated that only one out of almost 59 infections gets reported. This reflects the necessity of improving the efficiency of RT-PCR testing so that more symptomatic individuals receive the test. Not all individuals with a known RT-PCR positive result showed the presence of IgG antibodies. Around 20% of RT-PCR positive individuals were seronegative, and in a large majority of them (32 out of 36), the duration since RT-PCR positivity was more than 2 weeks. This may be attributed to a poor B cell response or a false-negative antibody test.35 Around 38% of RT-PCR negative individuals were seropositive, suggesting a false-negative RT-PCR or infection acquisition at a date later than the RT-PCR test.
We estimated an infection fatality rate of 0.034% (95% CI 0.032% to 0.037%). The infection fatality rate in SARS-CoV-2 infection has been reported to range from as low as 0.00% to 1.63%.36 Our estimates of the infection fatality rate are low as compared with estimates from several Indian studies.5 28 37 Under-reporting of COVID-19 deaths because of the non-uniform definition for a ‘COVID-19 death’ may falsely lower the infection fatality rates.38 Many other factors can influence the infection fatality rate in SARS-CoV-2 infection—the quality of available health facilities, the age structure of the population and COVID-19 epidemic intensity.39 40 Developing countries usually have a younger population as compared with the developed countries, and Kashmir is not an exception. However, because of the possibility of under-reporting of COVID-19 deaths, the true infection fatality rate in Kashmir may be higher than our estimates. The infection fatality rate is, however, known to be lower in developing nations.30 41 In developed nations like the USA and many European countries, a higher infection fatality rate has been reported.30 42
Limitations
One important limitation of our study is that even though we adjusted the weighted seroprevalence estimates for test performance using manufacturer-provided sensitivity and specificity (100% and 99.63%, respectively), we did not quantify the test validity in-house. Another limitation of our study estimates is that we excluded people <18 years of age. The results of our study may not thus be generalisable to this group of the population.
Our estimated seroprevalence was much higher than we anticipated at the designing stage. This has impacted the precision of our estimates to some extent. However, we believe we still have been able to estimate the seroprevalence with reasonable precision.
Lack of reliable death counts is another potential limitation. This may have led to an underestimation of the infection fatality rate. We did not perform any adjustment for death counts. Further, because of lack of age and gender-specific mortality data, we could not estimate age and gender-specific infection fatality rates.
Conclusions
We conclude that nearly 37% of individuals aged 18 years and above were infected with SARS-CoV-2 in Kashmir by October 2020. The infection fatality rate in the valley is around 0.034%. A majority of cases go unreported. For every reported case, there are 59 unreported infections in the population. Since almost half of the symptomatic individuals go unreported, testing of symptomatic individuals and effective contact tracing need to continue. Given the emergence of mutant variants of concern, increasing the population immunity through augmented and sustained vaccination is necessary. We further recommend that adherence to COVID-19 prevention measures should be ensured until a large proportion of the population gets vaccinated.
Data availability statement
Data are available upon reasonable request.
Ethics statements
Patient consent for publication
Ethics approval
We obtained written informed consent from all study participants. The study was approved by the Institutional Ethics Committee of Government Medical College Srinagar (reference number: 1004/ETH/GMC). We used anonymised participant data for analysis.
Acknowledgments
We thank Professor Samia Rashid for her support. We acknowledge the help from Divisional COVID-19 Control Room Kashmir, especially from Dr Rauf Hussain Rather. We thank the following coordinating centre team and the laboratory support team for their support and coordination. Coordinating centre team: Dr Sabira Aalia Dkhar, Dr Kouser Sideeq, Dr Uruj Qureshi, Dr Mehraj u Din Sofi, Dr Yasmin Kango, Dr Suhail Manzoor Shah, Dr Bashir Ahmad Khan, Dr Nabeel Ishtiyaq, Dr Tajamul Hussain Khan, Dr Lahoot Hassan Khan, Dr Muzaffer Ahmad, Dr Ramesh Kumar Malla, Dr Ruqaya Rasool Kapta, Dr Mohammad Yousuf Naikoo, Dr Khalid Abbass, Dr Zarar Ahmad Bhat, Dr Sumair Rashid, Dr Zubair Ahmad, Dr Shalender Singh Bali, Dr Abdul Rouf, Dr Abdul Hamid, Dr Khalid Bashir, Dr Qazi Najeeb Ahmad, Dr Syed Irtiza, Dr P Sharik Shaheen Khaki, Dr Sheikh Mohammad Shafi, Dr Mohammad Yousuf Zagoo, Dr Mukhtar Ahmad Shah, Dr Imtiyaz-ur-Rehman Bhat, Dr Showkat Parray, Dr Fazil Ali Kochak, Dr Muzaffar Ahmad Zargar, Dr Abdul Rashid Shah, Dr Shagufta Saleem, Dr Abdul Gani, Dr Nighat Nasreen, Dr Asima Nazeer, Dr Zahoor Ahmad Lone. Laboratory support team: Ishtiyaq Ahmad Handoo, Rahiba Makhdoomi, Iyman Wani, Romana Rasool, Asiya Rehman, Insha Rehman, Zahoor Ahmad, Gulzar Ahmad Wani, Javid Ahmad Bhat, M Saleem Malik, Naveed Manzoor, Mubeena.
References
Supplementary materials
Supplementary Data
This web only file has been produced by the BMJ Publishing Group from an electronic file supplied by the author(s) and has not been edited for content.
Footnotes
Twitter @inaamul_haq
JA, TA, AAB, ABF, AMG, YJ, R-u-RK, ZAK, MAM, BM, FN, MN, MWR and MR contributed equally.
AA, SA, MA, AAB, INC, SI, MFK, MAK, MSK, RK, AAL, SN, MO, TBQ, IS and IAS contributed equally.
Contributors SMSK: conceptualisation, funding acquisition, methodology, writing–review and editing. MAQ, IH, SM: formal analysis, data curation, methodology, project administration, writing–original draft, writing–review and editing. JA, TA, ABF, AAhB, AMG, YJ, R-u-RK, ZAK, MAM, BM, FN, MN, MWR, MR: project administration, supervision, investigation, writing–review and editing. AA, MA, SA, AAkB, INC, SI, MFK, MAK, MSK, RK, AAL, SN, MO, TBQ, IS, IAS: supervision, investigation, witing–review and editing.
Funding The National Health Mission Jammu and Kashmir funded the study.
Disclaimer The funding agency was not involved in study design, implementation, analysis or interpretation of the study findings.
Map disclaimer The inclusion of any map (including the depiction of any boundaries therein), or of any geographic or locational reference, does not imply the expression of any opinion whatsoever on the part of BMJ concerning the legal status of any country, territory, jurisdiction or area or of its authorities. Any such expression remains solely that of the relevant source and is not endorsed by BMJ. Maps are provided without any warranty of any kind, either express or implied.
Competing interests None declared.
Provenance and peer review Not commissioned; externally peer reviewed.
Supplemental material This content has been supplied by the author(s). It has not been vetted by BMJ Publishing Group Limited (BMJ) and may not have been peer-reviewed. Any opinions or recommendations discussed are solely those of the author(s) and are not endorsed by BMJ. BMJ disclaims all liability and responsibility arising from any reliance placed on the content. Where the content includes any translated material, BMJ does not warrant the accuracy and reliability of the translations (including but not limited to local regulations, clinical guidelines, terminology, drug names and drug dosages), and is not responsible for any error and/or omissions arising from translation and adaptation or otherwise.