Article Text

Abstract
Objective Women in different age phases have different metabolism and hormone levels that influence the production and excretion of uric acid. We aimed to investigate the prevalence and related factors of hyperuricaemia among women in various age phases.
Study design Observational, cross-sectional study.
Setting Data were obtained from women at three health check-up centres in Shanghai.
Participants Adult women from three health check-up centres were recruited. Exclusion criteria were individuals with pregnancy, cancer, incomplete information. Finally, 11 601 participants were enrolled.
Results The prevalence rates of hyperuricaemia of total subjects were 11.15% (95% CIs 10.57% to 11.72%). The prevalence of hyperuricaemia in 18–29, 30–39, 40–49, 50–59, 60–69 and ≥70 years old was 6.41% (95% CI 4.97% to 7.86%), 5.63% (4.71% to 6.55%), 6.02% (5.01%% to 7.03%), 11.51% (10.19% to 12.82%), 16.49% (15.03% to 17.95%) and 23.98% (21.56% to 26.40%), respectively. Compared with 18–29 years old, the ORs for hyperuricaemia in other age phases were 0.870 (95% CI 0.647 to 1.170, p=0.357), 0.935 (0.693 to 1.261, p=0.659), 1.898 (1.444 to 2.493, p<0.001), 2.882 (2.216 to 3.748, p<0.001) and 4.602 (3.497 to 6.056, p<0.001), respectively. During the 18–29 years old, the related factors for hyperuricaemia were obesity and dyslipidaemia. During the 30–59 years old, the related factors were obesity, dyslipidaemia, hypertension and chronic kidney disease (CKD). Over the 60 years old, the occurrence of hyperuricaemia was mainly affected by obesity, dyslipidaemia and CKD, while hypertension cannot be an impact factor for hyperuricaemia independently of obesity and dyslipidaemia.
Conclusion After 50 years old, the prevalence of hyperuricaemia in Shanghai women has increased significantly and reaches the peak after 70. Obesity and dyslipidaemia are two main related factors for hyperuricaemia during all ages, while diabetes mellitus and nephrolithiasis have no relationship with hyperuricaemia throughout. CKD is an independent impact factor for hyperuricaemia after 30 years old.
- epidemiology
- general medicine (see internal medicine)
- nephrology
Data availability statement
Data are available upon reasonable request. The data sets generated and analyzed during the current study are available from the corresponding author upon reasonable request.
This is an open access article distributed in accordance with the Creative Commons Attribution Non Commercial (CC BY-NC 4.0) license, which permits others to distribute, remix, adapt, build upon this work non-commercially, and license their derivative works on different terms, provided the original work is properly cited, appropriate credit is given, any changes made indicated, and the use is non-commercial. See: http://creativecommons.org/licenses/by-nc/4.0/.
Statistics from Altmetric.com
Strengths and limitations of this study
We conducted a multicentre study with large sample size, which ensured sufficient power in obtaining the accurate prevalent rate and related factors of hyperuricaemia.
The prevalence of hyperuricaemia, obesity, hypertension, diabetes mellitus, dyslipidaemia, chronic kidney disease, nephrolithiasis as well as related factors of hyperuricaemia was analysed in various age phases.
It was a cross-sectional study and the results could not identify the causative relationship between hyperuricaemia and other metabolic and renal disorders.
The data were from three databases of check-up centres that lacked details in pharmacotherapy, menopausal status, economic, lifestyles and diet, which might affect the deviations of some clinical outcomes.
Introduction
Uric acid is the end product of purine metabolism in human body, which is produced mainly in the liver and intestines while excreted mostly in the kidney.1 Xanthine oxidoreductase catalyses two enzymatic reactions, hypoxanthine to xanthine and xanthine to uric acid.2 Several conditions can increase the concentration of serum uric acid (SUA) and occurrence of hyperuricaemia (HUA), including increased uric acid production, for example purine-rich food intake and cytotoxic drugs, and decreased uric acid excretion, for example chronic kidney disease (CKD).1–3
In patients with HUA, deposition of urate in joints and kidney promotes the development of gouty arthritis and uric acid nephrolithiasis.4 5 Uric acid also causes oxidative stress, inflammation and endothelial dysfunction in a crystal-independent way.1 Besides that, there is a growing body of evidence to show that HUA or elevated SUA level is associated with obesity, hypertension and cardiovascular disease in the group of adult and elderly people.6–9 Some observational studies also confirmed that increased SUA levels promote the development of CKD, especially in children and adolescents.10 11 Although a quite of epidemiological studies have investigated the risk factors of HUA or increased SUA in general people or elderly even children, few studies focuse on these relationship among women under different years old. Affected by menstrual cycle, menopause or taking oestrogen, hormones are fluctuant in women of different ages, while this fluctuating hormone level may influence the body fat distribution and metabolic system.12 13 Thus, it is necessary to know the relationship between SUA and metabolic disorders such as obesity, hypertension, diabetes mellitus and dyslipidaemia, in woman under the different ages.
This study was aimed to investigate the prevalence of HUA in the women of different ages. The data were from subjects in multiple centres of Shanghai. We also focused on the potential effect of ages on the association between SUA and metabolic and renal disorders in women during all age phages.
Methods
Study population
A total of 13 001 women aged between 18 and 98 years from three health check-up centres (Shanghai East Hospital Affiliated to Tongji University School of Medicine, Pudong New District Gongli Hospital and Baoshan Branch of Shanghai First People’s Hospital) were recruited from June 2015 and December 2018. Studies on human subjects were conducted in accordance with the Declaration of Helsinki. They waived the need for participant consent. We excluded subjects with pregnancy, cancer, incomplete information. Finally, 11 601 participants were enrolled in our study. We divided the woman participants into six groups according to ages (group Ⅰ: 18–29 years old, group Ⅱ: 30–39 years old, group Ⅲ: 40–49 years old, group Ⅳ: 50–59 years old, group Ⅴ: 60–69 years old, group Ⅵ: ≥70 years old).
Primary and secondary outcome measures
HUA was defined as SUA ≥6 mg/dL for women.14 The prevalence of HUA as well as its relationships with metabolic, renal disorders were assessed according to different age status (18–29, 30–39, 40–49, 50–59, 60–69, ≥70 years old).
Measurements and definition
Body mass index (BMI) was calculated as weight (kg) divided by height squared (m2). According to WHO guidelines for the Asian Pacific population, normal weight was defined as 18.5 ≤BMI <24.0 kg/m2, underweight was defined as BMI <18.5 kg/m2, overweight and obesity were defined as 24.0 ≤BMI <28.0 kg/m2 and BMI ≥28.0 kg/m2, respectively.15 Blood pressure (BP) measurements were taken according to the Joint National Committee VII criteria.16 Normal BP was defined as an systolic blood pressure (SBP) <120 mm Hg and diastolic blood pressure (DBP) <80 mm Hg. Prehypertension was defined as an SBP of 120–139 mm Hg and/or DBP of 80–89 mm Hg. Grade 1 hypertension was defined as an SBP of 140–159 mm Hg and/or DBP of 90–99 mm Hg. Grade 2 or grade 3 hypertension was defined as an SBP ≥160 mmHg and/or DBP ≥100 mm Hg.16 According to the Chinese adult dyslipidaemia prevention guide (2007 edition), individuals with a fasting total cholesterol (TC) ≥6.22 mmol/L, triglyceride (TG) ≥2.26 mmol/L, high-density lipoprotein cholesterol (HDL-C) <1.04 mmol/L and/or low-density lipoprotein cholesterol (LDL-C) >4.14 mmol/L or currently undergoing pharmacologic treatment were defined as the dyslipidaemia.17 Type 2 diabetes was defined based on WHO 1999 diagnostic criteria as fasting plasma glucose (FPG) ≥7.0 mmol/L or 2-hour plasma glucose ≥11.1 mmol/L, impaired fasting glucose (IFG) was defined as 6.1 mmol/L ≤FPG < 7.0 mmol/L, and normal condition was defined as FPG <6.1 mmol/L.18 The estimated glomerular filtration rate (eGFR) was calculated using Modification of Diet in Renal Disease formula19: 186×(serum creatinine (mg/dL)]−1.154×(age)−0.203×(0.742 (if woman)). According to the Kidney Disease Outcomes Quality Initiative clinical practice guideline, eGFR <60 mL/min/1.73 m2, proteinuria and haematuria were defined as CKD.20 Urine proteinuria were recorded as negative (−), trace, 1+, 2+ and 3+. Albuminuria was defined as ≥1+.
Data collection
The participants attended to the medical centre in the morning after overnight fasting for at least 8 hours. After 5 min resting, sitting blood pressure was measured in right arm by an electronic blood pressure monitor. Mean value of the three records was used in the analysis. Midstream urine specimen was collected for urinary analysis by the dipstick method. Urine pH and proteinuria were recorded as categorical data. Laboratory reagents were purchased from Nanjing Jiancheng Bioengineering Institute (Nanjing, China). Venous Blood samples were drawn from all subjects and quickly centrifuged at room temperature. SUA was determined using the uricase-peroxidase method. Other biochemical indeces were analysed as described previously.21 Basic characteristics were collected by medical staffs. Anthropometric data including height and weight were measured according to a standardised protocol. Renal ultrasonography scanning was performed by an experienced radiologist using GE LOGIQ P5 scanner (GE Healthcare, Milwaukee, USA).
Patient and public involvement
Patients and the public were not involved in any aspects of the study, including the development of study question, study design, conduct of the study and dissemination of results.
Statistical analysis
All the statistical analyses were carried out using IBM SPSS statistics V.22.0. The continuous variables with a normal distribution were described by means±SD and categorical variables were presented in frequency and percentage. In case of non-parametric data distribution, medians with IQR were presented. The univariate analysis of variance was performed to measure the data among the groups or a Kruskal-Wallis test in case of non-parametric data distribution. χ2 test was used to calculate the differences between categorical variables. If the results showed differences between the groups, the post-hoc tests would be done. As for the post-hoc test, we used least significance difference test, if the variance was homogeneous, and we used Tamhane’s T2 test if not. Considering that SUA, age, BMI, SBP, DBP, FPG, TC, TG, HDL-C, LDL-C, eGFR were normally distributed in this study, Pearson’s correlation test was used to assess the correlation between two variables. Multivariable logistic regression analysis was used to calculate the OR for HUA according to different age status. Two-tailed probability values <0.05 were considered statistically significant.
Results
Clinical characteristics of female participants in different age groups
There were a total of 11 601 female participants with a mean age of 50.08±15.29 years old. The prevalence rates of HUA of total subjects were 11.15% (95 % CIs 10.57% to 11.72%). The prevalence of HUA in group Ⅰ (18–29 years old), group Ⅱ (30–39 years old), group Ⅲ (40–49 years old), group Ⅳ (50–59 years old), group Ⅴ (60–69 years old) and group Ⅵ (≥70 years old) were 6.41% (95% CI 4.97% to 7.86%), 5.63% (4.71% to 6.55%), 6.02% (5.01% to 7.03%), 11.51% (10.19% to 12.82%), 16.49% (15.03% to 17.95%) and 23.98% (21.56% to 26.40%), respectively (table 1 and figure 1A). Women over 50 years old had a higher prevalence of HUA than those under 50. With increasing age, female individuals had more metabolic disease (obesity, hypertension, diabetes and dyslipidaemia) and renal diseases (CKD, nephrolithiasis) (figure 1B–G, all p values for trend <0.001) as well as elevated levels of BMI, SBP, DBP, TC, TG, LDL-C, creatinine, blood urea nitrogen (BUN) and decreased levels of HDL-C and eGFR (table 1, all p values for trend <0.001).

The prevalence of metabolic disorders and kidney diseases.
Clinical characteristics of women in different age groups
The correlation between SUA and various clinical parameters in different age groups of women
In this study, SUA, BMI, SBP, DBP, FPG, TC, TG, HDL-C, LDL-C, eGFR were normally distributed. Thus, Pearson’s correlation test was adopted to investigate the relationships between SUA and various parameters in different age groups and the results areshown in table 2. In all age groups of women, the level of SUA was positively correlated with BMI, SBP and TG and negatively correlated with HDL-C (all p values <0.001, except SBP in group Ⅰ, p=0.001 and in group Ⅵ, p=0.012). Among the women over 30, SUA was significantly negatively correlated with eGFR (all p values <0.001).
Correlation coefficients between SUA and various clinical parameters in different age groups of women
Association between HUA and different status of clinical parameters in various age groups of women
Multivariable logistic regression models (full-adjusted) were analysed, and the results are shown in tables 3 and 4, with the OR for HUA according to different status of clinical parameters. We found that after adjustment for confounders, increased levels of BMI and TG and decreased levels of HDL-C and eGFR were positively related to increased OR of HUA. However, there was no significant relationship between HUA and increased FPG, TC, LDL-C and nephrolithiasis. These results suggested that women with overweight/obesity were more susceptible to HUA in all age phases. Moreover, in the population of HUA, women with increased TG and HDL-C were more likely to suffer the HUA than those with increased TC and LDL-C. Renal insufficiency was closely related to the occurrence of HUA among the women over 30.
The OR for hyperuricaemia according to different status of parameters of women in different age groups (Group Ⅰ–Ⅲ)
The OR for hyperuricaemia according to different status of parameters of women in different age groups (Group Ⅳ–Ⅵ)
Relationship between HUA and metabolic, renal disorders in women during all age phages
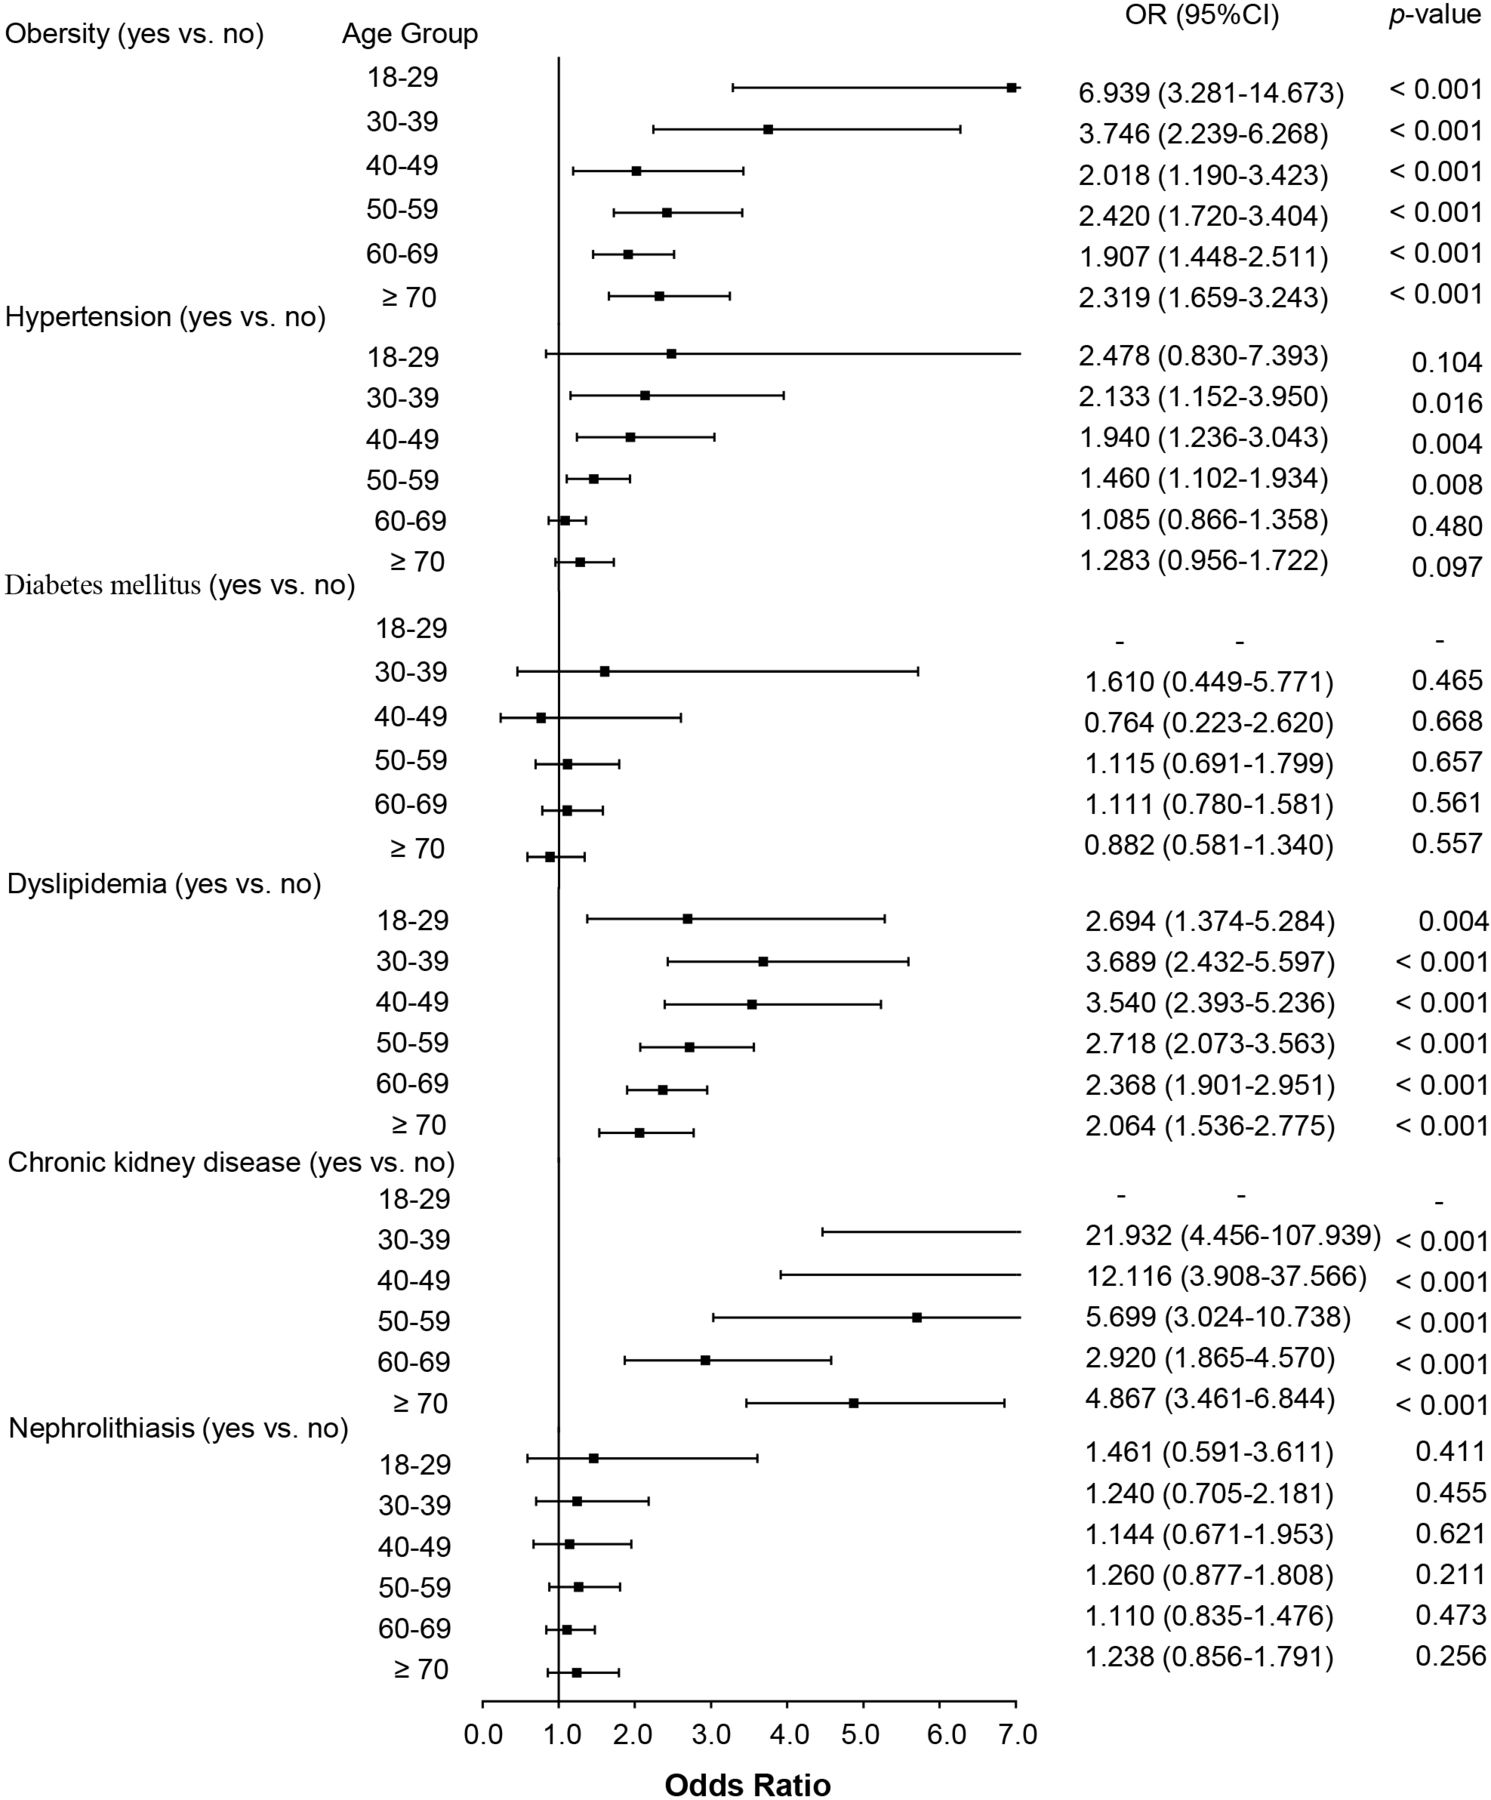
Univariate logistic regression analysis showed that compared with 18–29 years old, the ORs for HUA in other age phases were 0.870 (95% CI 0.647 to 1.170, p=0.357), 0.935 (95% CI 0.693 to 1.261, p=0.659), 1.898 (95% CI 1.444 to 2.493, p<0.001), 2.882 (95% CI 2.216 to 3.748, p<0.001) and 4.602 (95% CI 3.497 to 6.056, p<0.001), respectively (figure 2). Multivariable logistic regression analysis for various group was studied, and the results are shown in table 5 and figure 3. The ORs for HUA in obesity for women during all age phages were 6.939 (95% CI 3.281 to 14.673, p<0.001), 3.746 (95% CI 2.239 to 6.268, p<0.001), 2.018 (95% CI 1.190 to 3.423, p=0.009), 2.420 (95% CI 1.720 to 3.404, p<0.001), 1.907 (95% CI 1.448 to 2.511, p<0.001) and 2.319 (95% CI 1.659 to 3.243, p<0.001), respectively. The OR for HUA in dyslipidaemia for women during all age phages were 2.694 (95% CI 1.374 to 5.284, p=0.004), 3.689 (95% CI 2.432 to 5.597, p<0.001), 3.540 (95% CI 2.393 to 5.236, p<0.001), 2.718 (95% CI 2.073 to 3.563, p<0.001), 2.368 (95% CI 1.901 to 2.951, p<0.001) and 2.064 (95% CI 1.536 to 2.775, p<0.001), respectively. Women over 30 years old, CKD and hypertension became the risk factors for HUA. The OR for HUA in CKD for women who were in over 30 years old groups were 21.932 (95% CI 4.456 to 107.939, p<0.001), 12.116 (95% CI 3.908 to 37.566, p<0.001), 5.699 (95% CI 3.024 to 10.738, p<0.001), 2.920 (95% CI 1.865 to 4.570, p<0.001) and 4.867 (95% CI 3.461 to 6.844, p<0.001), respectively. The OR for HUA in hypertension for females who were in group Ⅱ (30–39 years old), group Ⅲ (40–49 years old), group Ⅳ (50–59 years old) were 2.133 (95% CI 1.152 to 3.950, p=0.016), 1.940 (95% CI 1.236 to 3.043, p=0.004) and 1.460 (95% CI 1.102 to 1.934, p=0.008). However, hypertension in group Ⅴ (60–69 years old), group Ⅵ (over 70 years old) did not relate to the occurrence of HUA. Moreover, diabetes mellitus and nephrolithiasis also had nothing to do with HUA in all age groups of women.

OR of hyperuricaemia to women exposed to different age phases.
The association between hyperuricaemia and obesity, hypertension, diabetes mellitus, dyslipidaemia, chronic kidney disease and nephrolithiasis.
The association between hyperuricaemia and obesity,hypertension,diabetes mellitus,dyslipidaemia,chronic kidney disease and nephrolithiasis
Discussion
Previous studies concentrated more on the prevalence of HUA in the overall population or children or elderly people, rare study was focused on females under the different age phases, who had a fluctuant metabolism and hormone level that might influence the production and excretion of uric acid. Thus, our current study investigated the prevalence of HUA and its related factors in different age phases of women.
Our research showed that the prevalence rates of HUA in Shanghai women were 11.15% (95% CI 10.57% to 11.72%), which was similar to the nationwide survey of HUA in 31 provinces in mainland China, that 8.3%–12.9% in women and 13.7%–18.8% in total.22 As a regional study, the prevalence of our result was close to other regional investigation in China, that 11.3% of HUA in Eastern Chinese general population23 and 13.6% in Northern China.24 Similarly, in Central China, a rural cohort study from Henan Province indicated that the prevalence of HUA was 12.6%.25 In Southern Chia, an epidemiological study from Foshan areas in Guangdong Province showed that the standardised prevalence rate of HUA was 15.27%, in which the prevalence in women was 10.54%.26 However, the prevalence of HUA in our female population was lower than USA 14.6%,27 which might be attributed to economic status and dietary habit. We also found that our data were also higher than Japan 1%–3%,28 which might due to the early antiurate therapy to asymptomatic patients, and their high cut-off of HUA (7.0 mg/dL in both sex).29 Notably, there was a lack of agreement on cut-off value of HUA. Previously, HUA was defined with the classic cut-off (>7.0 mg/dL in men and >6.0 mg/dL in women), but recent evidences suggested that a lower level should be considered as a more appreciate cut-off when addressing its negative impact on cardiovascular system (5.6 mg/dL for both sex).7 11 However, 2020 American College of Rheumatology Guideline for the Management of Gout Guidelines and Japanese Guideline on Management of Hyperuricemia and Gout third edition suggested that the normal upper limit is 6.8 mg/dL, and anything over 7 mg/dL (for both sex) is considered saturated, and symptoms can occur.29 We did the addition analysis for the prevalence and related factors analysis of HUA based on the new cut-off (>7.0 mg/dL) (online supplemental table 1 and online supplemental figure 1). The prevalence rates of HUA (>7.0 mg/dL) of total subjects were 3.65% (95% CI 3.30% to 3.98%). Logistic regression analysis also showed the similar trend of ORs for HUA cut-off 7.0 mg/dL, expect for nephrolithiasis (online supplemental table 2 and online supplemental figure 2). There was no relationship between nephrolithiasis and HUA when HUA was defined as SUA>6.0 mg/dL. Using the higher cut-off (>7.0 mg/dL), HUA tended to be associated with nephrolithiasis in the group Ⅴ (60–69 years old) with p=0.019, group Ⅵ (over 70 years old) although p=0.082. We speculated that the association between HUA (>6 mg/dL) and nephrolithiasis might be covered by the lower cut-off of HUA. Since 7 mg/dL was the saturation point of uric acid, which would increase the deposition of urate crystals in kidney or joint.
Supplemental material
Supplemental material
Supplemental material
In addition, we also calculated the prevalence of HUA in various age groups and found that after 50 years old, the prevalence of HUA in Shanghai women has increased greatly and reached the peak after 70 years old, 23.98%, which was closed the prevalence in adult men, 22.2%.21 Consistently, compared with those under 30 years old, the ORs for HUA in over 50 age phases also increased significantly and reached the highest at the age over 70 (OR=4.602, 95% CI 3.497 to 6.056, p<0.001). Therefore, we identified that 50 years old was an important inflection point for HUA in women, which was earlier than some cohort studies that enrolled postmenopausal women with a mean age closed to 60.30 31 Our result suggested an earlier attention and intervene for HUA in women.
Furthermore, our study investigated the relationship between HUA and metabolic, renal disorders in women during all age phages. We found that obesity and dyslipidaemia were two main risk factors for HUA during all ages (all p<0.05). It was well recognised that estrogens promoted the accumulation of fat in gluteofemoral rather than in abdominal and visceral depots.32 33 While in old women, decreased level of oestrogen tended to form an central distribution of adiposity, making the body shape similar to the men.33 This could in part explain the phenomenon of increased prevalence of obesity and dyslipidaemia in older women, and this change was accompanied by increased SUA. Other main component of metabolic disorders, hypertension, mainly affected the occurrence of HUA during 30–59 years old. Although the prevalence of hypertension had a sustainable growth after 30 years old, it was not associated with HUA after 60-year old. We used backward elimination method to select variables and analyse the reason, the result showed that hypertension could not be a related factor of HUA independent of obesity and dyslipidaemia in the age older than 60.
Although the prevalence of diabetes mellitus increased with age, this cross-sectional study indicated that FPG or diabetes mellitus almost had no significant relationship with HUA during all age phages of women. This was inconsistent with previous studies. A meta-analysis of 12 cohort studies, including a total of 6340 cases and 62 834 participants, revealed a positive non-linear relationship between SUA levels and diabetes and IFG.34 In the development of hyperglycaemic or diabetes, HUA had been reported to be a risk factor. A retrospective cohort study among 1923 patients showed that HUA was associated with a significantly higher risk of developing diabetes. Diabetes rates from Kaplan-Meier analysis were 19% for SUA ≤7 mg/dL, 23% for 7 mg/dL <SUA ≤ 9 mg/dL and 27% for SUA >9 mg/dL at the end of follow-up period (80 months).35 Another prospective cohort study followed up 13 328 women and 41 350 men without diabetes for 4 years, and the results showed that any abnormality in SUA concentrations was associated with an increased risk for the development of IFG in men, while such association was not found in women.36 One the other hand, in the development of HUA, hyperglycaemic might also be an inducer. One hypothesis was that hyperglycaemic exceeded renal glucose threshold and induced hyperfiltration and elevated the rate of renal glomerular filtration increased excretion of uric acid.37 It seemed that hyperglycaemic was more likely relate to hypouricaemia in the early period of diabetes. During the late phase of diabetic nephropathy, fibrotic glomeruli could not compensate the filtration, reduced eGFR and decreased SUA excretion would appear concomitantly.38 However, our cross-section study can not find the relationship between SUA and hyperglycaemic or diabetes. Their uncertain relationship might largely attribute to hyperglycaemia-induced hyperfiltration. And their causal relationship still need more prospective studies to verify.
There were several limitations in our study. First, we lacked the data of pharmacotherapy and menopausal status. Since that oestrogen could promote urate excretion,39 which might affect the results on population who under perimenopause or with hormone replacement therapy. And antihypertension drugs also affected urate metabolism, that diuretic (such as thiazides) increased the urate reabsorption,40 while angiotensin receptor inhibitor (such as losartan) decreased it. There might be some biases on hypertension subjects. Additionally, the data about economics, lifestyles and diet were also absent. Second, this was a local survey, not a national study. And the cross-sectional study can not identify the causative relationship between HUA and metabolic and renal disorders. Nonetheless, the strengths of our study included a multicentre sample with a large size, which ensured a much solider statistics result. And the prevalence of HUA in different age phases was analysed and compared.
Conclusion
In Shanghai female population, the prevalence of HUA increases significantly since 50 years old and reaches the peak after 70. Obesity and dyslipidaemia are close related to HUA during all ages, while diabetes and nephrolithiasis have no relationship with HUA throughout. CKD is an independent impact factor for HUA after 30 years old.
Data availability statement
Data are available upon reasonable request. The data sets generated and analyzed during the current study are available from the corresponding author upon reasonable request.
Ethics statements
Patient consent for publication
Ethics approval
The study was conducted according to the guidelines of the Helsinki Declaration and was approved by the Human Research Ethics Committee of Shanghai East Hospital Affiliated to Tongji University School of Medicine, Human Research Ethics Committee of Pudong New District Gongli Hospital, Human Research Ethics Committee of Baoshan Branch of Shanghai First People's Hospital (ID 2020025).
Acknowledgments
The authors appreciate all the participants. They also thank the health check-up teams from Shanghai East Hospital Affiliated to Tongji University School of Medicine, Pudong New District Gongli Hospital and Baoshan Branch of Shanghai First People’s Hospital for their assistance in completing this project.
References
Supplementary materials
Supplementary Data
This web only file has been produced by the BMJ Publishing Group from an electronic file supplied by the author(s) and has not been edited for content.
Footnotes
MT and XM contributed equally.
Contributors MT, NL, SZ, YS and XM performed the statistical analysis and wrote the manuscript; MT, XM, XP, LT, YH, HC, XZ, LD and YC participated in the data collection; MT, NL, SZ and XM contributed to discussion; MT and NL participated in the design of the study and edited the manuscript. All authors contributed to data interpretation and revisions of the manuscript critically for important intellectual content. All authors approved the final version of the submitted manuscript and agreed to be accountable for all aspects of the work in ensuring that questions related to the accuracy or integrity of any part of work are appropriately investigated and resolved.
Funding This study was supported by the National Nature Science Foundation of China grants (82070791, 81670690, 81470991 and 81200492 to N.L., 81970072 and 81500059 to LT, 82070700, 81830021 and 81670623 to SZ), the Shanghai Scientific Committee of China (20ZR1445800 and 13PJ1406900 to NL), the Key Discipline Construction Project of Pudong Health Bureau of Shanghai (PWZxk2017-05 to NL), the Key Program of Science Foundation of Jiangxi Province (2018ACB 20016 to LT), the leading medical talent project of Shanghai Pudong Heath Bureau (PWRI2019-05 to LT) and the Branch Grant of National Key R&D Program of China (2018YFA0108802 to SZ).
Competing interests None declared.
Provenance and peer review Not commissioned; externally peer reviewed.
Supplemental material This content has been supplied by the author(s). It has not been vetted by BMJ Publishing Group Limited (BMJ) and may not have been peer-reviewed. Any opinions or recommendations discussed are solely those of the author(s) and are not endorsed by BMJ. BMJ disclaims all liability and responsibility arising from any reliance placed on the content. Where the content includes any translated material, BMJ does not warrant the accuracy and reliability of the translations (including but not limited to local regulations, clinical guidelines, terminology, drug names and drug dosages), and is not responsible for any error and/or omissions arising from translation and adaptation or otherwise.