Article Text

Abstract
Objectives To describe the social determinants and development in energy drink consumption among Norwegian adolescents in 2017, 2018 and 2019.
Design Cross-sectional, online, annual, nationwide surveys (Ungdata).
Setting Responses collected online from January 2017 to December 2019.
Participants Lower and upper secondary school students (n=297 102) aged 12–19 years who responded in 2017, 2018 and 2019.
Main outcome measures Frequency of energy drink consumption.
Results Over the 3-year period, 66.4% of the men and 41.8% of the women had consumed energy drink once a week or more. The proportion of female high consumers (consuming energy drink more than four times a week) increased from 3.3% to 4.9% between 2017 and 2019; for male, the increase was from 9.8% to 11.5%. In females, the proportion of high consumers increased with 24% (relative risk; CI) (1.24; 1.09 to 1.41) from 2017 to 2018 and 46% (1.46; 1.31 to 1.62) from 2017 to 2019. The corresponding increases in males were 10% (1.10; 1.01 to 1.20) from 2017 to 2018 and 12% (1.12; 1.05 to 1.19) from 2017 to 2019. Any energy drink consumption as well as high energy drink consumption were independently associated with school level, less central residency, low socioeconomic status, physical inactivity and high leisure screen time.
Conclusion We found an increase in high consumers among both boys and girls between 2017 and 2019. The observed increase in energy drink consumption among adolescents can explain some of the increased sales of energy drink in Norway.
- nutrition & dietetics
- community child health
- public health
Data availability statement
Data may be obtained from a third party and are not publicly available. The data supporting our study are available from the Norwegian Centre for Research Data (NSD) and were used under license for the current study. The Ungdata survey is funded by The Norwegian Directorate of Health. Anonymous data have been made available for the authors by NOVA through NSD—the Norwegian Center for Research Data. Neither NOVA, The Norwegian Directorate of Health nor NSD are responsible for the analyses or interpretation of the presented data.
This is an open access article distributed in accordance with the Creative Commons Attribution Non Commercial (CC BY-NC 4.0) license, which permits others to distribute, remix, adapt, build upon this work non-commercially, and license their derivative works on different terms, provided the original work is properly cited, appropriate credit is given, any changes made indicated, and the use is non-commercial. See: http://creativecommons.org/licenses/by-nc/4.0/.
Statistics from Altmetric.com
Strengths and limitations of this study
This study identifies recent development in the frequency of energy drink consumption among adolescents in Norway.
Data are derived from a large, annual, national survey in Norway, including nearly 300 000 adolescents over 3 years from 2017 to 2019.
The study relies on self-reported energy drink consumption, which can be susceptible to both recall bias and social desirability bias.
Introduction
Marketed as a booster of mental and physical capacity, energy drinks (ED) have gained worldwide popularity. In Norway, ED sales increased by more than 50% from 2017 to 2019.1 ED are defined as non-alcoholic beverages that contain at least 150 mg caffeine per litre, in addition to sugar combined with one or more substances known to have stimulant properties.2–4 Moreover, vitamins, minerals and amino acids are frequently added to ED.4 ED marketing is often targeted towards athletes and the adolescent population, and recent studies have shown that viewers of TV channels with greater ED advertising have increased odds of ED consumption.5–7
ED consumption among children and adolescents has been linked not only to potential negative effects such as increased cardiovascular symptoms with increased cardiac output but also to elevated systolic and diastolic blood pressure.8 Moreover, sleep disturbance, nervousness and headache have been reported.9–12 These potential adverse effects can result in tiredness, inattention, reduced school performance and increased mental distress. The main cause for concern is the high level of caffeine in ED combined with added sugar and sweet flavour, next to the high content of stimulating substances.13 According to Iversen et al,13 this combination of ingredients may cause faster uptake of caffeine into the circulation compared with regular coffee. Moreover, studies have indicated that adding caffeine to sugar-sweetened beverages (SSB) leads to increased use of SSB, which in turn results in increased energy intake.14 15 The high energy intake may contribute to overweight and obesity as well as dental caries due to the high sugar and citric acid content of ED and SSB.16
In 2013, the European Food Safety Authority (EFSA) published a report on ED use, indicating that children and adolescents aged 10–18 years had the highest reported consumption (68%), compared with adults above 18 years (30%) and children below 10 years (18%).3 The potential negative effects of ED in children and adolescents have gained the attention of government authorities in several countries, of which some have issued restrictions on the caffeine content in ED.17 The Norwegian Food Safety Authority has stated that the daily intake of caffeine for children and adolescents should not exceed 2.5 mg/kg. This was decided based on a review of current knowledge by the Norwegian Scientific Committee for Food and Environment (VKM).4
According to the findings of the VKM review, a child or youth would be at risk of sleep disturbance with an intake of 1.4 mg/kg body weight/day of caffeine.4 Furthermore, the risk of negative health effects on the heart and central nervous system would be presented at an intake of 3 mg/kg body weight/day of caffeine. This would mean that a 13–15-year-old adolescent with an average weight of 50 kg would be at risk of sleep disturbance when drinking more than 70 mg/day of caffeine and at risk of adverse cardiac and central neurologic effects at daily consumption of 150 mg/day. These values are in line with recommendations by EFSA and correspond to an intake of one to two large cans (500 mL) of ED for an adolescent described above.4
ED consumption varies according to age and gender. Several studies have found that male adolescents are more likely to consume ED than their female counterparts. Moreover, young (male) adolescents at middle school level have a higher ED consumption compared with older adolescents at high school level.3 18 19 Furthermore, Degirmenci et al20 found that high consumption (≥ 4 times a week) of ED was independently associated with male gender, physical inactivity, high leisure screen time, low socioeconomic status (SES) and rural residency.
Of special concern for potential adverse effects is children and adolescents who have lower body weight and are more sensitive to ED stimulants, including caffeine. According to the American Academy of Pediatrics, ‘Caffeine and other stimulants contained in ED have no place in the diet of children and adolescents’.21 Despite the aforementioned increased sales of ED in Norway, the extent to which the consumption of ED among children and adolescents followed this development remains unclear.17 The objective of the current study is to describe the social determinants and changes in ED consumption among Norwegian adolescents in 2017, 2018 and 2019. Potential social determinants include age, gender, SES, residency, physical activity and leisure screen time.
Methods
Study design and participants
Data for the study were collected through the Ungdata survey, a national, annual, survey, mapping the health and well-being of lower and upper secondary school students in Norway. The study was approved by the Norwegian Centre for Research Data (NSD). Detailed information regarding the survey is found on wwwungdatano22 All data collection is conducted anonymously and web-based during school hours with the teacher present in the classroom. Data from the surveys carried out in 2017, 2018 and 2019 were used for the present study.
All 422 municipalities in Norway (2019) are invited to participate in the Ungdata survey. Participation is free of charge and on a volunteer basis. The municipalities are encouraged to perform the survey every 3 years in the schools of the municipalities. This is to ensure that all adolescents get to participate once both during lower (from 8th to 10th grade) and upper (from 11th to 13th grade) secondary school. The 3-year interval is not a strict rule, which means that some municipalities participated two times and some all 3 years (2017–2019). In the present study, information from all municipalities was included regardless of how many years they participated. It is, therefore, possible that some adolescents responded two or three times. In total, we have data from 422 municipalities, 333 participated only once, 59 two times, and one municipality participated all 3 years. Fewer municipalities participated in the Ungdata survey in 2018, compared with 2017 and 2019 (figure 1).

Overview of the study participants. ED, energy drink.
In Norway, children start school the year they turn 6 years old (grade 1) and stay in school until the age of 15–16 years (grade 10). Attending school is obligatory by law until the completion of grade 10, whereas attending subsequent grades is voluntary. National statistics show that the majority of 16-year-old to 18-year-old (93.4% in 2019) go on to attend upper secondary schools.23
A total of 297 102 adolescents from both lower and upper secondary schools participated in the Ungdata surveys in 2017, 2018 and 2019. Of the participating adolescents, 278 891 answered the questions on ED consumption (response rate of 93.9%) and were included in the analyses (figure 1).
In 2017, missing values for gender were 6.4% compared with less than 1% in 2018 and 2019. This is likely due to the order of questions in the electronic questionnaire, which led to overlooking of the question regarding gender in the 2017 survey. This ordering of questions was changed in 2018 and 2019 (personal correspondence with staff from Ungdata).
The annual Ungdata Survey is approved by the NSD. Participants do not have unique identification numbers as data collection is done anonymously and does not contain sensitive information. Therefore, no ethical approval was needed. The study was funded by Innlandet Hospital Trust (project number: 150377).
Measures
ED consumption was assessed with the question ‘How often do you usually drink ED (Red Bull, Battery, etc.)?’ The participants could respond with one of seven incremental options, ranging from ‘never’ to ‘several times a day’. The response to this question was used to categorise adolescents into the following two groups subsequently used as outcome variables: ED consumers (ED < once a week or more) and high ED consumers (ED ≥ 4 times a week). The definition of high ED consumers was based on previous studies.2 20 The ED consumers were compared with never ED consumers, and the high ED consumers were compared with the rest (all other frequency of ED consumption including non-ED).
Leisure screen time was assessed using the question ‘Outside school, how much time do you normally spend on activities that involve looking at a screen (TV, computer, tablet, mobile phone) each day?’ with options on a seven-point incremental scale ranging from ‘no time’ to ‘≥ 6 hours’. The first three options of the variable leisure screen time were merged into one response of ‘≤ 2 hours’ for the regression analysis due to the relatively low number of respondents in these categories.
Physical activity was assessed by the question ‘How often do you perform physical activity which gets you out of breath or makes you sweaty?’ with options on a six-point incremental scale ranging from ‘never’ to ‘at least five times a week’.
SES was assessed according to a five-point scale which again was based on a compound score from three different dimensions.24 25 These dimensions were parental education, ‘culture capital’ at home based on the question ‘how many books do you think there are in your home?’ and the third dimension used four questions from the Family Affluence Scale (FAS II). FAS II contains questions regarding the number of cars in the family, whether the participant has her/his own bedroom, whether the participant has been on vacation, and the number of computers or tablets in the house. The answers were assigned different points that were subsequently used to calculate a total score distributed into five equally sized groups. Group 1 refers to the lowest SES score and group 5 to the highest.
For this study, we used the official Norwegian centrality index to define residency. According to Statistics Norway, centrality refers to an index of travel time to workplaces and service functions from all populated basic units. Groups 1 contains the most central municipalities (highest index) and group 6 the least central (lowest index).26 Residency for each individual is based on where the adolescent attends school and is not per se the place of living.
Further details on variables and answer options are given in table 1.
Baseline characteristics of adolescents participating in the Ungdata surveys in 2017, 2018 and 2019
Statistical analyses
The association between the outcome variables (any and high ED consumption) and the independent variables was estimated in multivariable Poisson regression models. These models allowed us to estimate the risk ratios (RR) between the categories of the independent variables.27–29 We used the sandwich estimation method to generate robust standard errors.27 We also included interaction terms between year and gender to estimate the extent to which these variables modified each other’s association with the outcomes. In other words, we assessed if the association between gender and ED differed by year and the extent to which the association between year and the consumption of ED differed by gender. The independent variables in the statistical models were decided a priori and consisted of: gender, year, grade, residency, SES, frequency of physical activity and leisure screen time. We adjusted the SEs for clustering within the municipalities.
The interactions terms between gender and year were estimated both on an additive and a multiplicative scale using generalised linear models with identity and log link, respectively.30 In these models, we estimated the significance of the interaction terms using likelihood ratio tests. STATA V.15.1 was used for all statistical analysis.31
Patient and public involvement
There were no patients involved in the study.
Results
In total, 278 891 adolescents who participated in Ungdata answered the question about ED use and were included for further analyses. Most of the adolescents (57.5%) attended lower secondary school (table 1). Grade 13 was the least represented grade in the sample, which is in line with previous findings from the Ungdata survey.24
Most of the participants attended schools in municipalities with the centrality index 2 and 3. The distribution seen in table 1 is comparable to the overall distribution of the centrality index in Norway.32 A lesser percentage in level 6 was expected, as there are fewer schools in these areas.
Between 20% and 30% of the participants reported performing some kind of physical activity where they get sweaty either 1–2, 3–4 or more than 5 times a week, while less than 10% reported 1–2 times a month or less. In addition, more than 10% spent 6 hours or more looking at a screen. Overall, 46% of the participants had never consumed ED and 7.4% had consumed ED more than four times a week.
Over the 3 years, there was a small decrease in the percentage of boys consuming ED from 67.3% (CI: 66.9 to 67.7) in 2017 to 65.7% (CI: 65.3 to 66.1) in 2019. Among girls, a small increase was found from 40.8% (CI 40.4 to 41.3) in 2017 to 43.6% (CI: 43.1 to 44.0) in 2019 (figure 2). However, high ED consumers increased among both boys and girls (figure 3). In 2017, 9.8% (CI: 9.5 to 10.0) of the boys and 3.3% (CI: 3.1 to 3.4) of the girls reported ED consumption in the range of high consumers, while these percentages increased to 11.5% (CI: 11.2 to 11.7) in boys and 4.9% (CI: 4.7 to 5.1) in girls in 2019.
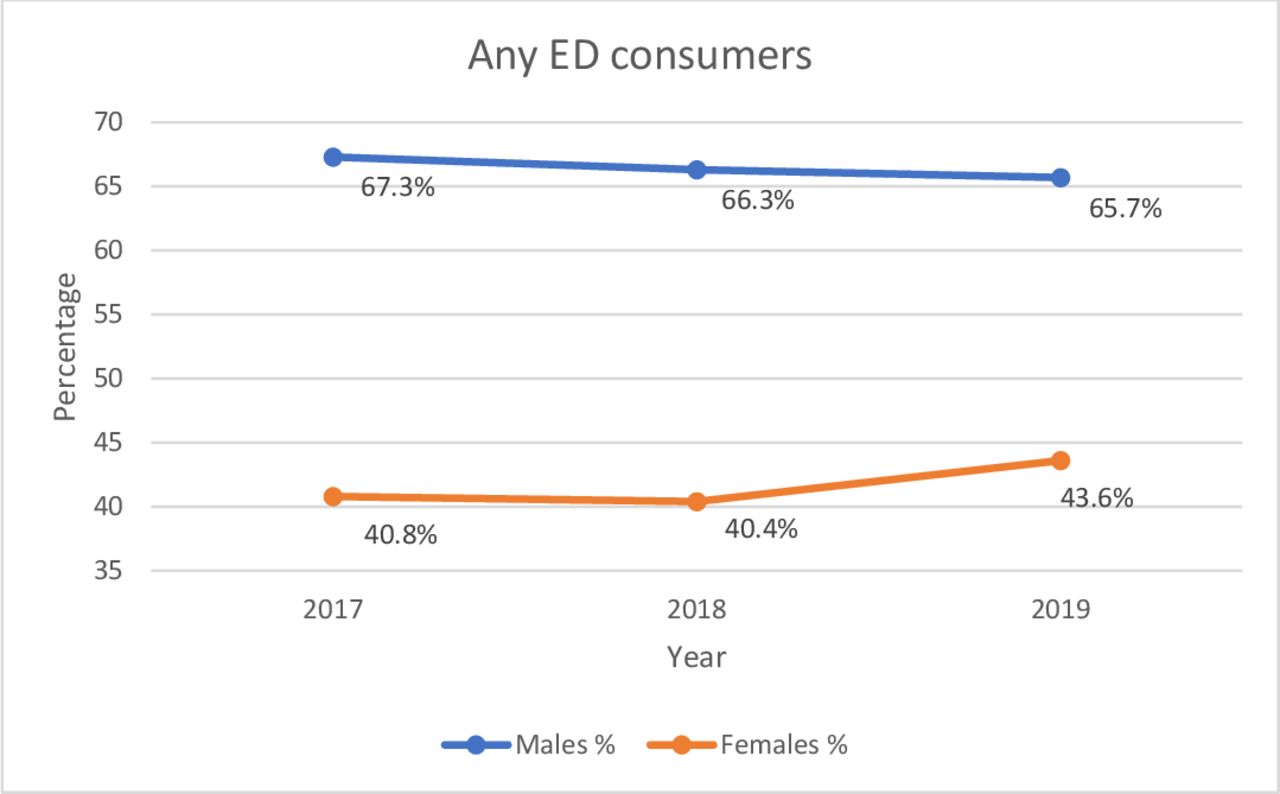
Any ED consumers per year and gender. ED, energy drink.

High ED consumers per year and gender. ED, energy drink.
Table 2 shows the annual increase in high ED consumption among both boys and girls. The proportion of female high ED consumers increased by 46% over the period. That is, the proportion of female high consumers is increased by 24% (RR; CI) (1.24; 1.09 to 1.41) from 2017 to 2018, and by 46% (1.46; 1.31 to 1.62) from 2017 to 2019. There was also an increase in the proportion of high consumers of ED in boys; however, this increase was lower at 12% (1.12; 1.05 to 1.19) from 2017 to 2019. On a multiplicative scale, the interaction terms between gender and year were statistically significant for 2019 (table 2). However, on an additive scale, there was no interaction found according to the generalised linear models as the difference in percentage points was almost identical (1.7 in boys and 1.6 in girls). Table 2 demonstrates the results from the Poisson regression models adjusted for clustering of municipalities. As no substantial differences between the crude and adjusted estimates from the Poisson regression models were found, only adjusted results are shown.
Determinants for being energy drink consumers (any ED or high ED) in Norwegian adolescents
The association between ED consumption and social determinants (table 2) showed that the largest proportion of high ED consumers was found in participants living in centrality index 6 (least central residency). Furthermore, we found a larger proportion of high ED consumers with decreasing SES. The same association was found when looking at the any ED consumption group, although differences were less pronounced. There was a relationship between high ED consumption and physical activity. Here, the lowest proportion was observed for those who were physically active 1–2 times a week compared with those who were never being physically active. However, this was not observed for the any ED consumption group. Regarding both the participants who consumed any ED as well as the high consumers, the proportions increased with increasing leisure screen time. The proportion of high ED consumers that spent more than 6 hours looking at a screen outside school hours was three times higher than the high ED consumers that spent less than 2 hours looking at a screen.
Discussion
We have described social determinants and changes in ED consumption among Norwegian adolescents between 2017 and 2019. We found an increase in the percentage of both boys and girls being high ED consumers and a change in ED consumption according to time. The main finding was an increase in proportion of female high ED consumers, which is of special interest as it highlights the fact that despite male high ED consumers still being the gender consuming most ED, female high ED consumers are catching up.
We found that in total, over the 3 years, 4.2% of the girls and 10.8% of the boys were high ED consumers. There was an annual increase in the proportion of high consumers that was most pronounced for girls, increasing from 3.3% in 2017 to 4.9% in 2019. Moreover, we found that more than half of the adolescents participating in the study had consumed any ED during these 3 years. The increase in high ED consumption was expected as sales in ED in Norway have increased. However, adolescents are most likely not the only group consuming increasing amounts of ED. It is plausible that other groups in the population follow the same trend in ED consumption.
High ED consumption was positively associated with the male gender, lower SES, attending schools located in rural areas, excessive screen watching, but not with physical activity at any level. The combination of either low or high physical activity and high leisure screen time as predictors for ED consumption was found in other studies from Saudi Arabia, Canada and the USA.3 18 33–35 Al-Hazza et al33 proposed that the reason why both low and high physical activity and high leisure screen time was observed is due to how ED are being marketed.
According to the study by Emond et al5 on ED advertisement, ED was primarily advertised on channels with adolescents as their base audience. Based on this, one could imagine that increased screen time and thereby increased exposure to ED advertising would lead to higher ED consumption rates.7 In addition, Hammond and Reid36 found that TV was the main common source of marketing of ED to adolescents next to marketing in grocery stores. Our results also suggest that adolescents who spend much of their spare time watching screens are those who consume most ED. Regarding the gender difference in high ED consumption, one could hypothesise that the marketing of ED appeals more to boys as they are the ones consuming more ED.
Our results show that even though boys still are the highest consumers of ED, the increase in the proportion of female high consumers was larger, on a multiplicative scale but not an additive scale, compared with men over the 3 years. The increase was 1.7 percentage points for boys (9.8%–11.5%) and 1.6 for girls (3.3%–4.9%) from 2017 until 2019. Based on this finding, it could be speculated that girls are becoming more exposed and perhaps more susceptible to ED marketing than before.
Limitations and strengths
A limitation of the study is that we were not able to take the regional differences in participation of schools each year into account. This might have affected the observed development of ED consumption seen over the 3 years. However, the breadth of the municipalities participating in the Ungdata study in 2017, 2018 and 2019 with an even distribution of smaller and larger communities spread out across Norway makes the sample sufficiently large and wide-reaching. Moreover, the participants are not completely selected at random as only municipalities who wanted to participate in the Ungdata survey were included in the study. In addition, the participating schools within these municipalities were not selected completely at random. The lower secondary schools are run by the municipalities while the upper secondary schools are organised according to regional districts; therefore, the schools have different catchment areas when it comes to children attending the schools.
Other limitations common to such surveys are that the study relies on self-reported ED consumption, which can be susceptible to both recall bias and social desirability bias.37 Moreover, only children who attended school on the day of the survey answered the questionnaire. Adolescents who were absent or had dropped out were, therefore, not included in the study, which might have affected the results. Finally, some adolescents might have participated more than once, yet no adjustment for lack of independence between these observations was possible.
The major strength of this study is the large sample included, with close to 300 000 adolescents answering the questionnaire and a response from 74.4% of the total eligible students in this time period.
Conclusion
ED consumption is increasing among female adolescents, especially high ED consumption. This is an important finding to consider in future research, which could focus on possible gender-related differences when studying various aspects of ED consumption. In addition, with rising ED consumption, it is increasingly important to investigate the potential long-term effects of ED use among adolescents.
Data availability statement
Data may be obtained from a third party and are not publicly available. The data supporting our study are available from the Norwegian Centre for Research Data (NSD) and were used under license for the current study. The Ungdata survey is funded by The Norwegian Directorate of Health. Anonymous data have been made available for the authors by NOVA through NSD—the Norwegian Center for Research Data. Neither NOVA, The Norwegian Directorate of Health nor NSD are responsible for the analyses or interpretation of the presented data.
Ethics statements
Ethics approval
The annual Ungdata Survey is approved by the Norwegian Centre for Research Data (NSD). Participants do not have unique identification numbers as data collection is done anonymously and does not contain sensitive information. Therefore, no ethical approval was needed.
Acknowledgments
The authors would like to thank NOVA (The Norwegian Social Research) for granting access to the data from the 'Ungdata, 2010–2019' surveys used in the present study.
References
Footnotes
Contributors SK and MH-A, conceptualised the study, acquired the data and drafted the manuscript; SK, TAS and MH-A analysed the data; all authors (SK, MH-A, TAS and BSS) contributed to writing the manuscript; all authors have read and approved the final manuscript.
Funding The study was funded by Innlandet Hospital Trust (project number: 150377).
Competing interests None declared.
Patient and public involvement Patients and/or the public were not involved in the design, or conduct, or reporting, or dissemination plans of this research.
Provenance and peer review Not commissioned; externally peer reviewed.