Article Text

Abstract
Introduction There is a clear need for improved care quality and quality monitoring in aged care. Aged care providers collect an abundance of data, yet rarely are these data integrated and transformed in real-time into actionable information to support evidence-based care, nor are they shared with older people and informal caregivers. This protocol describes the co-design and testing of a dashboard in residential aged care facilities (nursing or care homes) and community-based aged care settings (formal care provided at home or in the community). The dashboard will comprise integrated data to provide an ‘at-a-glance’ overview of aged care clients, indicators to identify clients at risk of fall-related hospitalisations and poor quality of life, and evidence-based decision support to minimise these risks. Longer term plans for dashboard implementation and evaluation are also outlined.
Methods This mixed-method study will involve (1) co-designing dashboard features with aged care staff, clients, informal caregivers and general practitioners (GPs), (2) integrating aged care data silos and developing risk models, and (3) testing dashboard prototypes with users. The dashboard features will be informed by direct observations of routine work, interviews, focus groups and co-design groups with users, and a community forum. Multivariable discrete time survival models will be used to develop risk indicators, using predictors from linked historical aged care and hospital data. Dashboard prototype testing will comprise interviews, focus groups and walk-through scenarios using a think-aloud approach with staff members, clients and informal caregivers, and a GP workshop.
Ethics and dissemination This study has received ethical approval from the New South Wales (NSW) Population & Health Services Research Ethics Committee and Macquarie University’s Human Research Ethics Committee. The research findings will be presented to the aged care provider who will share results with staff members, clients, residents and informal caregivers. Findings will be disseminated as peer-reviewed journal articles, policy briefs and conference presentations.
- health informatics
- information technology
- health & safety
- quality in health care
- risk management
- geriatric medicine
This is an open access article distributed in accordance with the Creative Commons Attribution Non Commercial (CC BY-NC 4.0) license, which permits others to distribute, remix, adapt, build upon this work non-commercially, and license their derivative works on different terms, provided the original work is properly cited, appropriate credit is given, any changes made indicated, and the use is non-commercial. See: http://creativecommons.org/licenses/by-nc/4.0/.
Statistics from Altmetric.com
- health informatics
- information technology
- health & safety
- quality in health care
- risk management
- geriatric medicine
Strengths and limitations of this study
The linkage of multiple data sources will allow for comprehensive information about aged care clients’ health conditions, psychosocial characteristics, care management, hospitalisations and quality of life.
The dashboard’s use of existing routinely collected data will enable the prediction of risk, and provide evidence-based guidance, in real-time.
To ensure that the dashboard is fit for purpose, the dashboard will be co-designed and tested with intended users (staff, aged care clients and residents, informal caregivers and general practitioners).
The dashboard will be designed to have generic characteristics which will allow it to be embedded into existing aged care information technology to facilitate its transferability and sustainability.
Most aged care services in this study will be located in major cities; therefore, findings may be limited in regional and remote areas, where client profiles and staff workflows could be different.
Introduction
Good quality care relies on the availability of good quality data and real-time analytics to support decision-making. This is particularly the case for older people with complex health needs who are supported by a wide-range of people in different settings. Aged care services have not been well served by information systems that support everyday care provision. Internationally, there is consistent evidence that aged care systems are struggling to provide high quality services for older adults, with shortcomings highlighted by many recent reviews, reports and research.1–5 The delivery of optimal care is hindered by a lack of integration between aged care and other healthcare services, fragmented funding systems, inadequate infrastructure, insufficient workforce training and support, and a widening gap between supply and demand of services.6
In Australia, concerns about suboptimal care and escalating pressure on aged care services has led to more than 40 major inquiries and reviews over the past 40 years,7 the latest being the Royal Commission into Aged Care Quality and Safety (2018–2020). The purpose of the Royal Commission was to examine the current state of the aged care system and determine what is needed to improve it for those receiving care now and into the future.1 8 The Commission’s findings have made it clear that the community is demanding better quality aged care and greater transparency: a system that meets older peoples’ needs, identifies when they are at risk, and responds in effective and compassionate ways.1 9 10
Despite enormous amounts of data collected in the sector, there continues to be considerable problems for informal caregivers, providers and governments to obtain meaningful information to allow the monitoring of care delivery and outcomes, and to guide effective decision-making.1 The increasing use of electronic systems provides an opportunity to address some of these shortcomings. The World Health Organization’s World Report on Ageing and Health identified information and communication technologies (ICT) as a ‘critical tool for transforming health systems and services to deliver person-centred and integrated care that is appropriate to older people’ (p109).6 The report outlined some of the anticipated and demonstrated benefits of using ICT in terms of access to services, quality and safety of care, cost effectiveness of services, accessibility of information and knowledge, social care and connectedness, and the provision of evidence-based care.6
Data rich but information poor
While the last decade has seen substantial uptake of ICT by aged care sectors internationally,11 the potential of these systems to transform care quality by increasing the usability and transparency of aged care information remains largely unrealised.11 Health and aged care systems are often characterised as ‘data rich but information poor’,12 13 meaning that although providers collect vast amounts of clinical and care management data, these data frequently exist within silos that are rarely integrated to create meaningful information to support care staff to coordinate, monitor and enhance care delivery. In Australia, these information silos are often driven by variations in funding and ownership of data (eg, between aged care and healthcare, or between State and Federal governments). Furthermore, these data are not often shared with the people who are the subject of data collection (ie, those receiving services and their informal caregivers) or with the general public who largely fund aged care services through tax contributions.
Data have traditionally been used for reporting purposes rather than quality improvement activities or driving care processes. Several countries have mandated systems for collecting and reporting aged care information,14 for example, the Home Care Reporting System and Continuing Care Reporting System in Canada, the US’ MDS 3.0 and Nursing Home Compare, Sweden’s Open Comparisons national quality monitoring system, and the International Resident Assessment Instrument Long-Term Care Facility Assessment System in New Zealand. Australia’s aged care system lags behind other Organisation for Economic Co-operation and Development (OECD) countries in terms of measuring and reporting on aged care quality.15 For example, Australia’s National Aged Care Mandatory Quality Indicator Program,16 operating since 2019, collects information on three quality indicators (physical restraint use, pressure ulcers and weight loss) in residential aged care settings (also known as assisted living facilities, nursing homes, care homes, long-term care facilities, and skilled nursing facilities). The aggregated data that are publicly reported for this programme allow comparisons to be made between providers. Additional quality indicators for falls and major injury, and medication management are being introduced to the programme in 2021. Currently, there is no system for mandatory reporting of quality indicators in community aged care settings (ie, formal aged care services provided in the home and community, including domestic assistance, social support, gardening, transport). Limited and disparate information on the quality of aged care in Australia reduces the capacity for older adults and their caregivers to make informed decisions about their care. Without this information, providers are limited in their ability to monitor and benchmark key quality indicators across services, initiate improvement activities, and systematically and iteratively assess the effectiveness and cost effectiveness of services and interventions.
Predictive risk models
Very little attention has been placed on the power of new analytic models to exploit the increasing volume of data that are stored in aged care IT systems. Initial research to capitalise on this valuable information source has focused on retrospective and descriptive analyses.17 18 This foundational research has demonstrated the potential value of these data to better understand quality of care issues.19–21 Further, this work has shown that it is possible to create automated risk-adjusted indicators of client care and outcomes by linking existing administrative, clinical and care management datasets routinely collected by providers.22 23 A number of studies in the acute care sector have shown the possibilities of leveraging electronic data systems to implement real-time predictive risk models.24–27 These models have been used to identify clients who are at risk of adverse events earlier and facilitate the uptake of tailored evidence-based strategies by time-poor staff.28–31
Dashboards
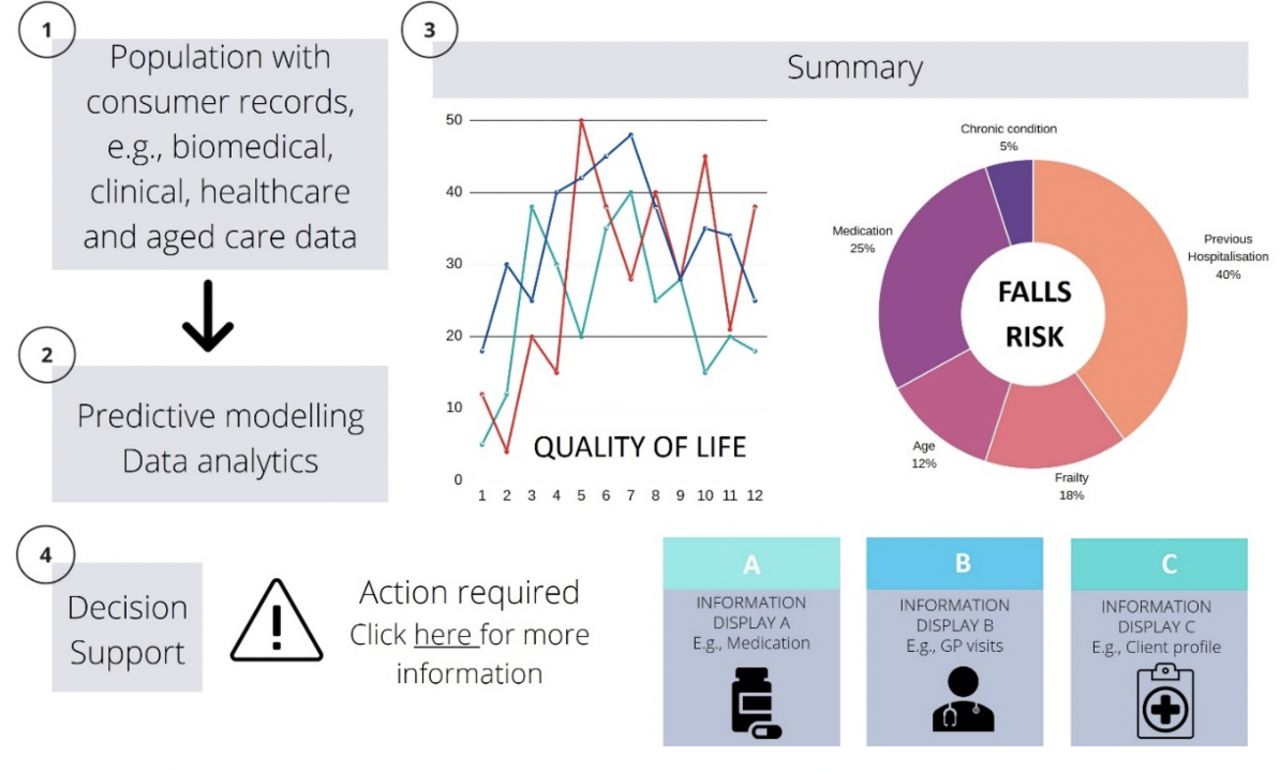
Dashboards offer promise in integrating multiple data sources and supporting the use of predictive analytics to improve client care. They allow for a single-view summary of an individual’s information and can provide decision-related information using text and visual features. These summaries can be dynamic; reflecting changes in clinical environments and a person’s information in real-time. Dashboards typically use graphical information displays and colour, allowing users to easily interact with and explore important information. Dashboards may include features that alert users to areas requiring attention, such as deteriorating patients or those at high risk of injury or harm. They may also provide support tools to guide staff members’ responses to alerts. These features allow for the quick and targeted communication of information, helping reduce the cognitive effort of users and enabling them to make informed decisions effectively and efficiently (figure 1).

Example of a dashboard to predict risk and deliver actionable information. Information in this figure was created for illustrative purposes only and does not reflect real data. GP, general practitioner.
Dashboards have predominantly been implemented and evaluated in primary, acute and mental healthcare.32–34 In these settings, dashboards have been shown to improve clinician situational awareness, decision-making, and guideline adherence, positively affecting outcomes such as mortality.32 35 At an organisational-level, dashboards can improve the detection of overdue tasks, procedural bottlenecks and support better resource allocation.35 At the client level, they have the potential to make meaningful information accessible to clients and their families, placing individuals at the centre of their own information and care. Dashboards are less commonly used in aged care settings, which may encounter specific challenges with uptake and use due to poor ICT infrastructure and support services, and a workforce with lower computer experience and digital literacy skills than found in acute care settings.36 37
Rationale
Anglicare, a large non-profit aged care provider located in New South Wales (NSW), Australia, identified the critical need for leveraging their electronic systems to support evidence-based practice across their services. The Australian Institute of Health Innovation, Macquarie University, is partnering with Anglicare; the Sydney North Health Network; the Northern Sydney Local Health District; the Deeble Institute for Health Policy Research, Australian Healthcare and Hospitals Association (AHHA); and the Australian Aged Care Quality and Safety Commission, to design, develop, implement and evaluate an interactive dashboard comprising integrated client information, risk indicators and decision support. This dashboard is intended to be used by Anglicare staff (eg, registered nurses, care workers, care advisors, managers), clients and residents, informal caregivers, and general practitioners (GPs) providing services to Anglicare clients, collectively referred to as ‘users’. It is expected that the dashboard will be used to identify and support older adults at risk of poor outcomes in residential aged care facilities and community-based aged care. The dashboard will be iteratively co-designed and evaluated with stakeholders to (1) allow care managers to monitor robust real-time indicators of care quality, (2) support staff members and GPs to obtain a client overview ‘at-a-glance’ and make evidence-based decisions about their care, and (3) provide timely, meaningful information to older persons and their families.
Priority aged care challenges
Risk indicators will initially target two priority aged care challenges relevant to both residential-based and community-based care populations: (1) hospital-related falls; and (2) quality of life (QoL).
Falls are a major cause of harm to older Australians, experienced by more than a third of adults aged ≥65 every year.38 In 2014–2015 in Australia, over 1.4 million hospital days were attributable to fall-related injuries among older adults,39 costing >$A500 million.40 Falls are the cause of 92% of injury hospitalisations among aged care residents.41 Identifying those at risk is the starting point to improve falls management. However, falls risk tools currently in use are stand-alone assessments that are rarely integrated with dynamic information about an individual’s risk, such as changes in medications or health following a hospitalisation.42
QoL has been recognised by international peak health and healthcare organisations as an important aspect of active ageing and quality care in long-term care settings.6 43 44 Older Australians report QoL as a central goal for aged care.45 While research on the relationships between QoL and clinical outcomes in aged care settings is sparse, some evidence suggests that lower QoL scores are associated with poorer clinical outcomes in residential aged care clients.46–48 Alongside the increased recognition of the importance of QoL for older adults, valid and reliable QoL tools have recently been developed, including those suitable for use by people with dementia.46 49–54 Currently, reporting on QoL in Australian aged care is not mandatory, and while recent national policy requires community care providers to report on client wellness,55 relatively little is known about modifiable factors contributing to QoL in aged care.
These two exemplar indicators will serve as an initial model to test embedding risk indicators in an electronic dashboard within aged care settings. Other indicators may be added during the study in response to feedback from users.
Study aim
The aim of this study is to describe the co-design and testing of a dashboard in residential and community-based aged care settings, and to outline longer term plans for dashboard implementation and evaluation.
Methods and analysis
Study design
The research comprises three components: (1) (a) co-design of the digital dashboard with users and (b) refinement of prototypes; (2) integration of data sources and development of risk models; and (3) dashboard prototype testing with users. Figure 2 provides an overview of the study design. The study gained ethics approval in December 2019, with data collection commencing April 2020.

Overview of study design. APDC, Admitted Patient Data Collection; EDDC, Emergency Department Data Collection; GPs, General Practitioners; RBDM, Registry of Births, Deaths and Marriages.
Co-design principles
Co-design is a methodology used to design and deliver interventions which take account of contextual factors, facilitate ownership of interventions, and motivate uptake and user satisfaction.32 37 It is an approach that seeks out the meaningful involvement of potential user groups in designing tools and interventions, drawing on their lived experiences to ensure that outputs are tailored to their expressed needs and preferences, and align with workflows and available resources. Our research processes and methodology choices are guided by the following co-design principles outlined by Blomkamp,56 adapted from New South Wales Council of Social Services57: Outcomes-focused, inclusive, participative, respective and adaptive. The overarching goal of our research is to achieve positive change in aged care by improving outcomes for older adults. We plan to involve a range of stakeholders in the design process and will be seeking out their unique knowledge, opinions and experiences. We acknowledge that each user group has equal standing and are experts in their own right. Our study will involve users at different stages throughout the co-design process to ensure that the dashboard is appropriate, useful and relevant. Stakeholders’ input with be sought throughout an iterative process to help refine the dashboard.
Study population
Anglicare provides a variety of support services across the lifespan, including aged care, mental health services, palliative care and family support. This study involves Anglicare’s 23 residential aged care facilities, and their community-based aged care service outlets which provide services to older people in their homes. The risk modelling and data integration component of this study will include data about all of Anglicare’s residential and community care clients over the previous 5 years (1 July 2014 to 31 December 2019, n=~14 800). The co-design and prototype testing components will involve Anglicare staff members (registered nurses, care workers, care managers), clients and residents, informal caregivers and GPs. These groups represent the anticipated users of the dashboard, and are the people most likely to access client information and make decisions about care. Anglicare staff members will be recruited during management meetings and via emails from executive Anglicare staff, where information about the study and participation requirements will be presented. Contact details of interested staff members will be provided to researchers for recruitment. Clients currently receiving Anglicare residential or community care services and informal caregivers who meet the following inclusion criteria will be invited to participate in the study: ability to participate in an English-language interview; and ability to provide informed consent. Clients will be provided with information and consent sheets by members of Anglicare staff. Those who are interested in participating in the study will be asked if they consent to their contact details being shared with the research team, who will then contact them to provide more information about the study, answer any questions and schedule an interview time if appropriate. GPs will be recruited via the Sydney North PHN networks through email or flyers. All participants will be required to provide written or verbal consent before engaging in the study.
Methods and analysis
Component 1a: Co-design of the digital dashboard with users
The design of the dashboard will draw on existing literature in human factors design and evaluation, evidence of features of effective dashboards, and input from users, guided by co-design principles. A multimethod approach will be taken to investigate users’ needs and preferences, design the dashboard and to examine how the dashboard could be integrated into everyday practices. This will include:
Direct observations of staff members’ routine work interactions including type, location and duration of activities. Non-participant observations will be conducted unobtrusively (eg, at a distance of approximately 3 metres) using a validated time and motion tool (eg, Work Observation Method By Activity Timing).58 59
Interviews and focus groups with staff members about the design of the dashboard. Staff members will be asked about their perspectives on information to be included in the dashboard and dashboard features (eg, presentation of information and inclusion of decision support tools). They will also be asked about how decision-making guidance for the target priority areas (hospital-related falls and QoL) could be of value, and work processes or challenges garnered from the direct observations.
Interviews and focus groups with aged care clients and informal caregivers to explore their preferences and experiences relating to access to medical and aged care information, involvement in decision-making, and use of technology. The interviews will also focus on design features of the dashboard including functions (what clients would like the dashboard to do, and how), appearance (eg, colours, fonts, layout), and information to be included in the dashboard.
Interviews with GPs focusing on how the dashboard could support improved communication between aged care and primary care. This will include, for example, discussion of current processes and difficulties experienced in the transfer of information between aged care facilities and GP practice records. Exploration of GP use of decision support tools will also occur.
Co-design groups with users (staff members, GPs, clients, residents and informal caregivers) to design and develop decision support for the risk indicators. The decision support will comprise evidence-based information on actions to be taken when clients are identified as at risk.
Analysis
Interviews, focus groups and co-design groups will be audio recorded and transcribed verbatim. Qualitative data will be analysed using a structured content analysis approach.60 61 This approach allows for major domains and themes from users’ responses to be categorised in order to understand users’ needs and preferences related to dashboard appearance and functionality. Data analysis will be conducted in NVivo V.12, a programme that will support the categorisation of qualitative data into domains and themes.62 Two researchers will perform the initial coding of these data, producing a list of codes which will then be reviewed by the research team. Any discrepancies in coding will be discussed and used to modify the list of codes until the research team agrees on code application. The codes will then be sorted into preliminary domains and themes, which will be repeatedly reviewed and refined to maximise homogeneity prior to developing an analytic narrative. Data from the observation sessions will be descriptively analysed for time spent on different activities, interactions with people, tools and other methods used to complete tasks, as well as the rate of interruptions.
Component 1b: refinement of prototypes
The findings from the co-design activities will be used to create mockups of dashboard prototypes that will be presented to staff members, clients, residents and informal caregivers during focus groups and a community forum, as well as GPs during a workshop. As the dashboard is intended for different users, the presentation of information, dashboard features and evidence-based decision support will be tailored towards each user group and therefore, mockups will be user specific. Users’ feedback will provide insights into their perspectives of the prototype design, functionality and modifications needed, and guide revisions to the dashboard prototype. The qualitative data obtained through prototype feedback sessions will be analysed using the same strategies outlined above.
Component 2: integration of data sources and development of risk models
Building on the feedback from users in component 1a, we will develop a list of information items that will be used to populate the dashboard, based on the data available from Anglicare sources (table 1). Two exemplar risk models, one for each priority area, will be developed through the linkage of available historical Anglicare client records with data from the NSW Emergency Department Data Collection (EDDC), the NSW Admitted Patient Data Collection (APDC) and the NSW Registry of Births, Deaths and Marriages (RBDM) registries (see table 1 for descriptions of data sources). Data will be extracted for all Anglicare’s residential and community care clients over the previous 5 years. Hospital data for these clients will be requested from the data custodians of the NSW EDDC, the NSW APDC and the NSW RBDM death registrations. The Centre for Health Record Linkage (CHeReL) will conduct the data linkage in order to allow preservation of individual confidentiality as data custodians supply only personal identifiers to CHeReL without clinical data. Only clinical data without personal identifiers will be supplied to researchers.
Data sources for project component 2: risk models
Candidate variables to be evaluated as predictors will be based on existing literature and the extracted data from Anglicare client records (see table 1). The variables will be used in the development of the two independent risk models, one for falls and one for QoL. Multivariable discrete time survival (DTS) modelling will be used to develop each model.63 64 A rounded score for each risk factor in the final models will be calculated by dividing the regression coefficient of each covariate by the lowest coefficient in the model. This allows for total risk scores to be calculated for each person by summing the scores for each present risk factor. Risk models will be internally validated using bootstrap resampling. We have presented the approach to DTS modelling; however, other modelling will be explored, for example, joint regression65 and landmark models.66 To inform decision-making about the most appropriate model to use, statistical model performance techniques, such as the concordance index, will be performed. STATA will be used to conduct the statistical analysis.
Component 3: dashboard prototype testing
Informed by the findings from component 1, and the outputs of component 2, user-specific prototypes of the dashboard will be created by a specialist IT programmer and Anglicare IT staff using and adapting modifiable modules within Anglicare’s existing infrastructure. Client health and care information, along with the risk models, will be integrated into the dashboard to (1) provide an overview of clients’ information (eg, current medications) and (2) alert users to changes in clients’ risk levels for the two priority risk indicators in real-time. Each indicator will be accompanied by evidence-based decision guidance to direct actions in response the level of risk identified.
To test the dashboard prototype, staff members will be guided through task-based scenario ‘walk-throughs’ with a think-aloud approach.67 Subsequent follow-up interviews or focus groups will be conducted to explore staff members’ perceptions of the dashboard and alignment with workflow. Clients and informal caregivers will also engage in scenario walk throughs, along with follow-up interviews or focus groups to elicit their views on their use of the dashboard. Qualitative data from the think-aloud activity and interviews will be analysed using the same methods as component 1. The prototype testing phase will inform refinements of the dashboard, driven by users’ feedback.
Longer-term plans for dashboard implementation and evaluation
While the widespread implementation and evaluation of the dashboard are not the focus of this protocol, a broad overview of an anticipated large-scale trial to investigate the scalability and effectiveness is outlined. Once the dashboard has been revised in line with the findings from prototype testing, a hybrid stepped-wedge cluster randomised controlled trial will be carried out. This will involve implementing the dashboard in 12 Anglicare residential facilities and 12 community care units, with two residential aged care facilities and two community care units randomly selected for dashboard implementation each month for 6 months. The remaining facilities and community units will continue with usual care until the end of the trial. Implementation processes will use Anglicare’s staff training mechanisms and provide workshops for staff, clients, residents and informal caregivers on dashboard purpose and use, using practical examples and incorporating behaviour change principles to support both intervention fidelity and effectiveness. As part of the randomised controlled trial, process evaluations will be conducted to identify barriers and facilitators to dashboard use, and economic evaluations to assess resource use and costs associated with the development and implementation of the dashboard will be undertaken.
It is anticipated that the dashboard will serve as a model for both Australian and international aged care organisations wanting to integrate siloed data and use informatics to facilitate real-time quality monitoring and management of client outcomes. Lessons learnt from this project may be applied more broadly to the co-design of interventions with users, as well as the utilisation of data and IT systems in aged care settings.
Patient and public involvement
This research centres on the philosophy that users are co-creators of the research rather than participants in the research.68 69 The project proposal was co-designed from inception with key Anglicare staff in a series of workshops starting in December 2017. In order to ensure that the research will have meaningful and real-world applications, users (staff, aged care clients and residents, informal caregivers, and GPs) will continue to have strong engagement across the various stages of the research.68 We aim to elicit users’ expert knowledge, preferences and experiences through a range of methods, namely, interviews, observations, focus groups, co-design groups, workshops and forums. This information will be used to guide development of the dashboard, facilitate its implementation and inform future evaluations of the intervention. Relevant stakeholders including Anglicare representatives and users will be included in publications arising from this research to ensure appropriate interpretation of findings.68
Ethics and dissemination
This study has received ethical approval from the NSW Population & Health Services Research Ethics Committee (Ref: 2020/ETH00166) and the Macquarie University Human Research Ethics Committee (Ref: 6144). Data will be managed and stored in line with Macquarie University policies. The findings of this research project will be disseminated as peer-reviewed journal articles and as presentations at national and international conferences, seminars and workshops. The Deeble Institute for Health Policy Research, AHHA, will play a valuable role to support policy translation using their extensive advocacy networks across health policy portfolios. Research findings will be disseminated though policy briefs and regular meetings with parliamentary staff and policy-makers. Findings will be relayed back to Anglicare to inform decisions, and their networks will be used to present findings to clients and their informal caregivers.
Ethics statements
Acknowledgments
The authors wish to acknowledge our partners and collaborators; Anglicare, Sydney North Primary Health Network, Northern Sydney Local Health District, the Deeble Institute for Health Policy Research from the Australian Healthcare and Hospitals Association, and the Aged Care Quality and Safety Commission.
References
Footnotes
Contributors This protocol was based on a successful funding application prepared by the chief investigators JWe, MTB, LCG, ROD, JRa, SRL, AG and JB with input from the associate investigators (MZR, JC, EB, WYZ, DD, JRo, DR), staff from the aged care partner organisation (MC, AT, JSh, JWo), research partners (LO, CS, RH) and members of the project team working on the research (KL, MJ, KEL, AN, JSi, KS, MM). KL drafted the protocol and all authors contributed to reviewing and approving the final version.
Funding This project was funded by an Australian National Health and Medical Research Council (NHMRC) Partnership Project Grant in partnership with Anglicare (1170898). The NHMRC did not have any influence on the design of the study and collection, analysis, and interpretation of data. MZR is supported by an NHMRC Early Career Fellowship (1143941). JWe is supported by a NHMRC Elizabeth Blackburn Leadership Investigator Grant (1174021). JB is supported by an NHMRC Leadership Investigator Grant (1176620), the NHMRC Partnership Centre in Health System Sustainability (Grant ID 9100002) and APP1135058.
Competing interests None declared.
Patient and public involvement Patients and/or the public were involved in the design, or conduct, or reporting, or dissemination plans of this research. Refer to the Methods section for further details.
Provenance and peer review Not commissioned; externally peer reviewed.