Article Text

Abstract
Objective To explore factors that potentially impact external validation performance while developing and validating a prognostic model for hospital admissions (HAs) in complex older general practice patients.
Study design and setting Using individual participant data from four cluster-randomised trials conducted in the Netherlands and Germany, we used logistic regression to develop a prognostic model to predict all-cause HAs within a 6-month follow-up period. A stratified intercept was used to account for heterogeneity in baseline risk between the studies. The model was validated both internally and by using internal-external cross-validation (IECV).
Results Prior HAs, physical components of the health-related quality of life comorbidity index, and medication-related variables were used in the final model. While achieving moderate discriminatory performance, internal bootstrap validation revealed a pronounced risk of overfitting. The results of the IECV, in which calibration was highly variable even after accounting for between-study heterogeneity, agreed with this finding. Heterogeneity was equally reflected in differing baseline risk, predictor effects and absolute risk predictions.
Conclusions Predictor effect heterogeneity and differing baseline risk can explain the limited external performance of HA prediction models. With such drivers known, model adjustments in external validation settings (eg, intercept recalibration, complete updating) can be applied more purposefully.
Trial registration number PROSPERO id: CRD42018088129.
- general medicine (see internal medicine)
- geriatric medicine
- risk management
Data availability statement
All data relevant to the study are included in the article or uploaded as online supplemental information. Source data originate from separate primary studies and can potentially be requested for anonymous use from the PROPERmed IPD-MA database.
This is an open access article distributed in accordance with the Creative Commons Attribution Non Commercial (CC BY-NC 4.0) license, which permits others to distribute, remix, adapt, build upon this work non-commercially, and license their derivative works on different terms, provided the original work is properly cited, appropriate credit is given, any changes made indicated, and the use is non-commercial. See: http://creativecommons.org/licenses/by-nc/4.0/.
Statistics from Altmetric.com
Strengths and limitations of this study
Development of a prognostic model for all-cause hospital admissions using individual participant data yielded clinically plausible predictors.
A significant risk of overfitting in internal validation, and the heterogeneous estimates resulting from internal-external cross-validation as a particular strength, indicated that challenging calibration may have limited external validation performance.
While potential reasons for between-study heterogeneity could be explored, small samples from only four original studies not differentiating between admission causes were obvious limitations.
Introduction
Growth in the older population raises the frequency of hospital admissions (HAs).1 2 The increase in HAs reflects not only the ageing population, but also the increased incidence of multiple (chronic) conditions.3 Moreover, the rising demand for healthcare services also leads to unplanned and potentially preventable HAs, which are an important concern for the healthcare system. These unplanned and potentially preventable HAs can be classified as ‘triple fail’ events,4 as they risk being an unpleasant experience for patients, challenging public health and raising health spending.5 For individual patients, such distressing events make them vulnerable to further adverse events, including falls, increased disabilities and deterioration in health-related quality of life (HRQoL).6 7 In the context of public health and primary care in particular, physicians have to deal with complex patient needs that entail a higher risk of mismanagement in terms of misdiagnosis and/or mistreatment (ie, medication overuse, misuse or underuse).8–10 Primary care thus faces the challenge of avoiding such ‘triple fail’ HA events and instead improving patients’ healthcare experiences.4
One solution would be to offer timely and appropriate primary care interventions to patients at high risk of HAs. However, in order to be effective, such preventive interventions should be targeted at those at genuine risk.11 Numerous prediction models to identify patients at risk of (unplanned) hospitalisations have been developed in various populations.5 11–16 Several obstacles to good model performance have been identified,17 but promising methodological advances have neither been able to provide a breakthrough in parametric modelling,18 19 nor machine learning.20 External validation in particular has proved to be a major challenge with regard to predictive performance.21 The model must be able to provide accurate predictions in a new but related situation based on independent data.22 Generally, model development should balance the number of (meaningful) predictor variables at a reasonably large sample size, while model evaluation also requires enough events when applying the model to a new situation. Even if some of these prerequisites are not fully met, prognostic modelling using individual participant data (IPD) from a meta-analytic (MA) summary of several studies can help to investigate the factors driving external performance.23 By using IPD-MA, model development can profit from the enlarged casemix variability offered by patients from different healthcare settings, as well as, and more importantly, benefit from the opportunity to simultaneously perform external validation in an approach called internal-external cross-validation (IECV).24 25 By repeatedly fitting a model to all but one of the IPD trials (ie, training set), IECV mimics the model’s application in a new population, while checking predictive performance in the omitted study (ie, test set).
The recently introduced PROPERmed database provides such an IPD framework.26 Basically, if we want our prediction model to perform well in new, independent patients, between-study heterogeneity with respect to missing values, covariate and endpoint distribution, baseline risks and predictor effects (ie, the associations between predictors and outcome) must be adequately accounted for during model development.27 While exploring how these key elements drive (external) predictive performance, we are especially concerned with model calibration, the ‘Achilles heel’ of predictive analytics.28 29 This is of particular importance because a well-calibrated model is more useful from a clinical perspective than a competing model with better discriminatory performance (by means of the c-statistic or area under the receiver operator characteristics curve, ROC), but worse calibration performance.30 For example, this can be detrimental in case of systematic overerestimation or underestimation of risks in a new population. Thus, a calibration curve is central to assess calibration: the calibration intercept exposes heterogeneity in baseline risk, and the coefficient of the logistic calibration analysis (‘calibration slope’) reveals heterogeneous predictor effects.31 Using an IPD-based model of all-cause HA risk in a way that has previously proved successful,24 we aim to demonstrate how external validation might be affected by between-study heterogeneity in baseline risk, predictor effects and absolute risk predictions.27 As an applied clinical example of numerous methods introduced by Steyerberg et al,27 among others, we used IPD methods to predict HA and thus pursued two goals: (1) we expect the findings in our example to help explain the poor external performance of previous prediction models and, looking beyond our particular example, (2) we aim to show that such an approach can guide model developers concerned about poor external performance to choose appropriate methods of model adjustment (eg, intercept recalibration, model updating), if indicated.
Methods
Source of data and participants
We used harmonised IPD from the PROPERmed database32 that stem from four trials that qualified for inclusion because they recorded the precise times of study outcomes, namely ISCOPE (Integrated Systematic Care for Older PEople),33 Opti-Med (Optimised clinical medication reviews in older people with ‘geriatric giants’ in general practice),34 35 PRIMUM (PRIoritising MUltimedication in Multimorbidity in general practices) 36 37 and RIME (Reduction of potentially Inappropriate Medication in the Elderly; Deutsches Register Klinischer Studien-ID, DRKS00003610). Details of the origin and preparation of the source data for the PROPERmed database are described elsewhere.32 In brief, they were conducted in the Netherlands and Germany between 2009 and 2012 to optimise pharmacological treatment in older chronically ill patients. Three trials (Opti-Med, PRIMUM and RIME) compared a structured medication review consisting of several intervention components with usual care, whereas ISCOPE used a functional geriatric approach to compare usual care with a proactive and integrated plan.
Inclusion criteria for the study participants were identical to our previous work,38 with patients from general practices being eligible if they were aged 60 years or older, had been diagnosed with at least one chronic condition defined using the O'Halloran list,39 and had at least one chronic prescription at study baseline (≤2 weeks duration in PRIMUM, ≤2 months in ISCOPE and ≤3 months in Opti-Med and RIME).
Outcome and candidate prognostic variables
As our outcome definition could not distinguish emergency from planned admissions and the source data did not provide information on day and overnight admissions, we defined HAs as a binary outcome for all-cause HAs between baseline and 6-month follow-up. It is worth noting that ISCOPE used a longer follow-up period of 12 months. However, as time-based interactions with predictors did not reveal any statistically significant effect modulation during model development, the resulting potential for confounding can simply be reflected in a different baseline risk.
We had the opportunity to use all PROPERmed variables as candidate predictors, ranging from sociodemographics, lifestyle variables, patient (co)morbidity, medication, functional status and well-being (eg, HRQoL). The main candidate predictors for this prognostic model were age, sex, living situation, educational level, comorbidities according to the Diederichs list,40 potentially inappropriate prescriptions according to the European Union (EU) Potentially Inappropriate Medications list,41 STOPP-START (STOPP: screening tool of older persons' potentially inappropriate prescriptions; START: screening tool to alert doctors to the right treatment) criteria,42 the Dreischulte list,43 three indices for anticholinergic drug burden,44–49 harmonised scales indicating depressive symptoms50–55 or functional decline,56–58 and two independent subscales from the HRQoL Comorbidity Index.59–61 In addition to these, we also considered the number of HAs at baseline (ie, during the 12 months before inclusion) as a known strong predictor of future HAs62 (online supplemental table 1).
Supplemental material
Sample size and missing data
Outcome information on HA was complete, while there were sporadically missing values in predictor variables and most importantly, the number of prior HA at baseline was completely missing in the Opti-Med data source. As we expected the number of prior HAs at baseline to be one of the most predictive variable, we chose multilevel multiple imputation63 to ensure this variable was completely available and, vice versa, to retain all Opti-Med data when this information was systematically missing. We thus considered five iterations of each of six multiple-imputed (MI) datasets,64 and pooled them according to Rubin’s Rules.65 This procedure was extensively investigated in the PROPERmed database in a previous project38 with no impact on predictive performance with higher numbers of iterations and imputations. All results were compared with complete-case (CC) analyses, whenever applicable. Missing data and imputation patterns showed reasonable results, whereby this imputation procedure was specifically developed to adjust for within-study and between-study variability (online supplemental figure 1).66 67 Furthermore, when values were missing systematically, we did not consider the associated candidate prognostic variables in any of original studies (eg, smoking status). Given our final estimate of the c-statistic, sample size, event frequency and number of candidate predictors, we were well aware that this setting would not allow us to obtain an acceptable heuristic shrinkage factor or vice versa, adequate likelihood of a well-performing model.68
Supplemental material
Methods used in the statistical analysis
Aiming to explore key drivers of external validation performance, we applied a simplified statistical modelling process with a single-imputation dataset (we provided multiple-imputation metrics where applicable), and fitting only one structural model in IECV, and studying heterogeneity using this once defined set of predictor variables.
For model development, we used a fixed-effects logistic regression model with a stratified intercept27 to conduct IPD analyses and account for between-study heterogeneity24 in our four eligible studies. The model was thus developed using logistic regression and by adding study indicator variables through the application of effect coding to estimate relative effects with a global average.69 While these study indicators, along with the basic variables of age and sex, were considered mandatory in model development, all the other 88 prognostic variables were evaluated in a variable selection process that used the so-called Least Absolute Shrinkage and Selection Operator (LASSO)70 with the ‘minCV +1 SE rule’71 to obtain the sparser models that result from a larger penalty.72 The final model was derived by using maximum likelihood to refit the model formula,71 whereby an estimate of overfitting was obtained using internal bootstrap validation.
For model evaluation, we considered the performance metrics of the c-statistic to indicate the discriminatory ability in separating events from non-events by predicted probabilities,73 calibration intercept to indicated baseline risk specification, calibration slope to indicate predictor effect, calibration-in-the-large (CITL) for a global assessment of the former two,74 and MA measures for between-study heterogeneity to indicate differences between the four original studies.75 Internal model validation relied on bootstrap sampling, whereby a model was developed for each of 250 bootstrap samples. The number of samples drawn from each study depended on its sample size thus maintaining the ratio between study participants in bootstrap samples.76 The c-statistic for the original IPD was derived from these bootstrap models, and arithmetic means were calculated across all bootstrap samples to yield the optimism-corrected c-statistic. To quantify potential optimism, the uniform shrinkage factor was obtained by applying the mean difference in the calibration slopes for each bootstrap model to both the original IPD and in-sample bootstrap performance.38
In addition, estimates of generalisability were obtained using IECV, with each study just the once serving as a validation sample for a model developed in the remaining studies.25 The c-statistic73 and CITL74 were the numerical metrics of choice, while calibration plots were visually explored.30 We thus followed a defined calibration hierarchy77 that considered CITL to be an important metric for external validation, as well as the calibration slope; the calibration slope was defined as the coefficient of a logistic calibration analysis with cumulated outcomes as the dependent variable and the logit of all predicted risks as the independent variable.31 Among available options for setting baseline risks (intercept) in validation (test) data,24 our choice of the average intercept of the IECV training set is considered a conservative option. After extracting c-statistics and CITL estimates at every stage of the IECV loop and obtaining their within-study correlation using a non-parametric bootstrap,23 the respective estimates were pooled in a random-effects multivariate meta-analysis.75
Metrics to explore between-study heterogeneity included the I2 measure of heterogeneity.75 In order to quantify the membership strength of a specific study, we built a multinomial logistic regression model with study indicators as the dependent variables and all selected prognostic variables and the outcome HAs as predictors.27 74 The c-statistic of this membership model was derived by comparing the predicted probabilities for patients in one specific study with those of patients that were not. Separately, we used pairwise comparisons of the original studies to calculate Pearson correlations between the predictions of study-specific models.27 74
All analyses were conducted using the R software environment in V.3.6.1 (R Foundation for Statistical Computing, Vienna, Austria) with the key packages of caret,78 glmnet (70)(61), metaphor, mice,64 VIM,67 pROC73 and ROCR.79
This research study was reported in accordance with the TRIPOD (Transparent reporting of a multivariable prediction model for individual prognosis or diagnosis) statement (online supplemental table 2).80
Supplemental material
Patient and public involvement
Patients or members of the public were not involved in the design, or conduct, or reporting, or dissemination plans of the research.
Results
We included 3804 patients from the available PROPERmed IPD (PRIMUM n=499, Opti-Med n=514, ISCOPE n=1598 and RIME n=1193) (figure 1). Overall, this population had a mean age of 78 years, and 60.3% were female. Based on the chronic conditions defining eligibility and in accordance with the O’Halloran list,39 17.9% had been diagnosed with heart failure, 16.4% with chronic obstructive pulmonary disease, 35.7% with non-insulin/dependent diabetes and 12.5% had experienced acute myocardial infarction. In this subset of CC, 598 (21.2 %) patients had been admitted to hospital at least once (table 1).

Flow chart and schematic course of action. CC, complete cases; dHRQoL, deterioration of health-related quality of life; HA, hospital admission; IPD, Individual Participant Data; LASSO, Least Absolute Shrinkage and Selection Operator; MI, multiply imputed.
Candidate prognostic variables and statistically significant univariable associations with HAs
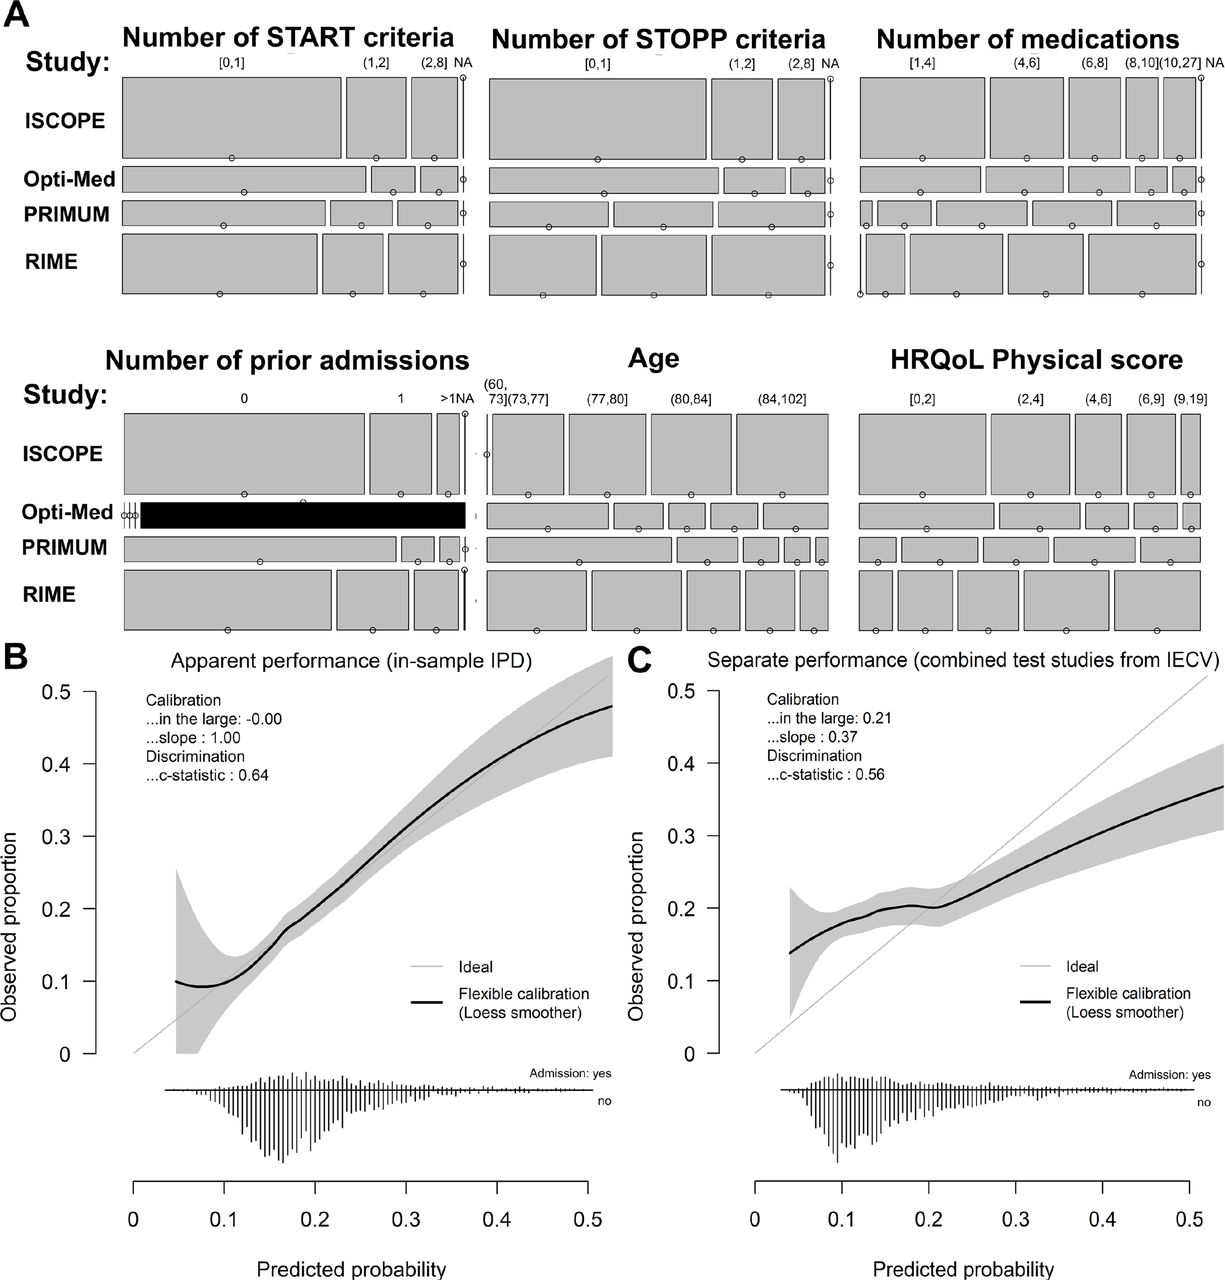
Model development yielded a structural model with seven prognostic variables and study-specific intercepts (table 2). Of the prognostic variables, the number of previous HAs at baseline had the highest effect and partly reflected pronounced casemix variability between the original studies (figure 2A). Similar estimates between CC and MI scenarios supported the use of the imputation procedure to deal with systematically missing numbers of previous HAs at baseline (online supplemental table 3). In internal bootstrap validation, the model achieved an optimism-corrected c-statistic of 0.64 (95% CI 0.62 to 0.67) with a calibration slope of 0.7 (0.6 to 0.83) diverging from one and thus indicating substantial potential for over-fitting. Compared with in-sample metrics for apparent performance, we obtained poor performance, especially in terms of model calibration, when pooling the test study data from each IECV loop (figure 2B,C).
Supplemental material

Model development and internal validation. Casemix variability in distributions of prognostic variables is visualised in mosaic plots stratified for the included original studies (area height according to study size; PROPERmed study numbering according to 1: ISCOPE; 2: Opti-med; 4: primum; 5: RIME). The size of the segments represent the number of patients and black areas indicate missing values (A). In calibration plots, predicted probabilities are presented against cumulated observed event proportions for the complete IPD on in-sample application of the HA prediction model (B) and for the combined original study data when used for validation in the IECV (hold-out) (C). HA, hospital admission; IECV, internal-external cross-validation; IPD, individual participant data.
Final multivariable analysis for HAs after 6 months of follow-up
Random-effects meta-analysis of particular studies’ test data in the IECV yielded a c-statistic of 0.60 (0.56 to 0.64) and CITL of −0.03 (-0.21 to 0.15). Between-study heterogeneity was striking with I2 estimates of 50.9% and 61.5 %, respectively. A highly variable performance resulted when the model was applied to each original study separately (figure 3). Among potential drivers of external validation performance, outcome frequencies and thus baseline risks differed strongly, while predicted risks appeared to show a consistent pattern (table 3). Membership c-statistics revealed that the membership model had generally high discriminative ability with respect to identifying the membership of a specific study. This indicates that the predictors and outcome distributions of the studies varied considerably, with patients from the ISCOPE study differing the most. When study-specific models were fitted and applied to the complete IPD, pairwise comparisons revealed moderate to high correlations between the linear predictors of study-specific models (online supplemental figure 2). This suggests that mean estimates involving the entire IPD may enable differences to be balanced out. Similarly, a meta-analysis of single predictor effects from these study-specific models revealed heterogeneity (I2 measure exceeding 30 %) in age and the number of previous HAs at baseline (online supplemental figure 3).
Supplemental material
Supplemental material

Assessment of between-study heterogeneity. Calibration plots are obtained from each data subset when a particular original study served as the validation sample in the IECV. IECV, internal-external cross-validation.
Between-study heterogeneity
Discussion
Our applied example takes a pioneering approach to use IPD-based modelling of HAs in general practice in order to expose the challenges of achieving good external validity in such a model. Heterogeneous baseline risks, absolute risk predictions and predictor effects were obvious drivers of the poor external (calibration) performance and should be explored before a particular model is applied to a certain target population. As IPD-based modelling enables this information to be accessed directly, it may be exploited in the modelling process by adapting predictor effects, and ensuring intercepts reflect baseline risks. While pooled average effects may compensate for such differences, separate analysis has revealed how important it is to ‘know’ as much as possible about the target population to which a model is applied. In the end, a deeper understanding of critical elements can help the developer to choose appropriate methods for model adjustment in the target population, among others intercept re-calibration or (complete) model updating.
IPD modelling with several small data sets for model development and/or model evaluation is promising because larger amounts of data can be used. Regarding our model performance, the small samples from only four studies may not have been large enough, although our performance was similar to previously developed all-cause admission models19 in its ability to identify well-known prognostic variables (eg, potentially inappropriate prescribing),81 82 and make corresponding parameter estimates of reasonable magnitude. For example, our model concurs with current research that found prior admissions to be the most relevant prognostic variable, followed by variables related to morbidity and functional disability.62 In our particular case, morbidity-related measures may also be reflected in the variables used to describe drug utilisation. While well-known diagnoses such as heart failure demonstrated the database’s validity by being significantly associated with HAs in univariate analysis (table 1), they did not contribute enough predictive strength to be used in the prognostic model of all-cause HA. This may simply be due to our outcome definition, which did not distinguish between preventable and all-cause HAs. All-cause HAs also included planned visits (which usually exceed 50% of all admissions83), which, apart from not having to be predicted, are presumably less dependent on specific factors and thus render such prognostic models less sensitive.81 Above, missing but potentially useful predictor variables that were unavailable for us or predictor misclassifications could also have had a negative impact on our observed performance. Nevertheless, it can be considered as highly favourable that medication-related risk factors are included in our model, as they will facilitate the identification of important issues in interventions targeting medication appropriateness.8 10 For example, while the number of medications (together with the number of previous HAs) may help in risk stratification, the START and STOPP criteria are conditions that can be directly acted on by changing medication. It thus appears feasible that individual risks can be reduced and the ‘Triple Aim’ of improving patients’ experience of healthcare, advancing public health and lowering per capita costs achieved.4 As an immediate next step beyond our model, however, we strongly advocate first refining the model’s outcome definition to predict preventable HAs.
Using established methods of accounting for between-study heterogeneity,24 IECV performance was only modest and also expected from the large uniform shrinkage factor of 30% (one minus the optimism-corrected calibration slope). Between-study heterogeneity was moderate to high, and high variation in the results of distinct IECV validation studies clearly emphasised this point. The fact that the global intercept also indicated pronounced heterogeneity in the original studies suggests that the current set of predictors did not explain variability to the extent necessary for the design of a better performing prediction model (online supplemental figure 3). The study indicators alone clearly did not adequately reflect the baseline risks of populations from different healthcare systems, which may also mean that the ‘right’ prognostic variables for predicting all-cause HAs were not available, or not to the necessary degree informative.
Further limitations first relate to the sample sizes needed in model development68 and validation,84 as a larger sample size would certainly have been desirable. For instance, in the IECV loop, for which validation data came from original individual studies, we could not meet the requirement of the suggested 100 events for a reliable assessment of predictive performance,85 86 or the required minimum of 200 patients with and 200 patients without a condition, which would be needed to generate precise calibration curves.77 The ability to predict unplanned and preventable HAs would have strengthened the potential clinical usefulness of the model. Nevertheless, currently available IPD from PROPERmed do not prevent us from drawing conclusions for future research, which was our primary goal and also the reason for several simplifications to enhance interpretability.
Conclusion
Based on PROPERmed IPD-MA, we have illustrated how predictor effect heterogeneity and varying baseline risks can limit the external performance of HA prediction models. Likewise, this approach proved that IPD-based modelling can project external performance and thus help developers addressing the potentially challenging performance after exploring its key drivers. If indicated by IPD, a model might be more purposefully improved when transferred to a new setting by adjusting baseline risks (ie, intercept recalibration) or additionally its predictor effects (ie, model updating).
Data availability statement
All data relevant to the study are included in the article or uploaded as online supplemental information. Source data originate from separate primary studies and can potentially be requested for anonymous use from the PROPERmed IPD-MA database.
Ethics statements
Ethics approval
The ethics commission of the medical faculty of the Johann Wolfgang Goethe University, Frankfurt / Main confirmed that no extra vote was necessary for the anonymous use of data from the PROPERmed IPD-MA (13/07/2017). All included studies were separately approved by the relevant ethics commissions as follows: ISCOPE: The Medical Ethical Committee of Leiden University Medical Center approved the study (date: 30.06.2009, reference: P09.096). Opti-Med: The Medical Ethics Committee of the VU University Medical Centre Amsterdam approved the study (date: 12.01.2012, reference: 2011/408). PIL: The Medical Ethics Review Board Atrium-Orbis-Zuyd approved the study (date: 15.12.2009, reference: 09-T-72 NL3037.096.09). PRIMUM: The Ethics Commission of the Medical Faculty of the Johann Wolfgang Goethe University, Frankfurt / Main approved the study (date: 20/05/2010, reference: E 46/10). RIME: The Ethics Commission of the University Witten / Herdecke approved the study (date: 28.02.2012, reference: 147/2011).
Acknowledgments
The authors would like to thank all participating local data managers (Sandra Rauck, Mascha Twellaar, Karin Aretz, Antonio Fenoy, and Kiran Chapidi). We would also like to thank Phillip Elliott for editing the manuscript.
References
Supplementary materials
Supplementary Data
This web only file has been produced by the BMJ Publishing Group from an electronic file supplied by the author(s) and has not been edited for content.
Footnotes
Twitter @meerpohl
ADM and AIG-G contributed equally.
Contributors JB, MvdA, UT, WEH, HJT, DB-L, PE, GK, JJM, DKdG, RP, PG, FMG, ADM and CM contributed to the design of the PROPERmed study. CM is the guarantor. ADM and AIG-G wrote the first draft of the manuscript. AIG-G and TSD developed the harmonised PROPERmed database; KMAS, HR and BF provided support. ADM performed the statistical analysis; RP, KIES and HR provided support. All authors contributed to the manuscript and agreed on its publication. All authors are members of the PROPERmed project being involved from the very beginning with significant contributions to conceptualisation, data harmonisation, design of analysis and interpretation of results. The corresponding author attests that all listed authors meet authorship criteria and that no others meeting the criteria have been omitted.
Funding This work was supported by the German Innovation Fund in accordance with § 92a (2) Volume V of the Social Insurance Code (§ 92a Abs. 2, SGB V - Fünftes Buch Sozialgesetzbuch), grant number: 01VSF16018. ADM is sponsored by the Physician-Scientist Programme of Heidelberg University, Faculty of Medicine. Rafael Perera receives funding from the NIHR Oxford Biomedical Research Council (BRC), the NIHR Oxford Medtech and In-Vitro Diagnostics Co-operative (MIC), the NIHR Applied Research Collaboration (ARC) Oxford and Thames Valley, and the Oxford Martin School. KIES is sponsored by the National Institute for Health Research School for Primary Care Research (NIHR SPCR Launching Fellowship).
Disclaimer The funding body did not play any role in the design of the study and collection, analysis, and interpretation of data and in writing the manuscript. The views expressed are those of the authors and not necessarily those of the NHS, the NIHR, or the Department of Health.
Competing interests None declared.
Provenance and peer review Not commissioned; externally peer reviewed.
Supplemental material This content has been supplied by the author(s). It has not been vetted by BMJ Publishing Group Limited (BMJ) and may not have been peer-reviewed. Any opinions or recommendations discussed are solely those of the author(s) and are not endorsed by BMJ. BMJ disclaims all liability and responsibility arising from any reliance placed on the content. Where the content includes any translated material, BMJ does not warrant the accuracy and reliability of the translations (including but not limited to local regulations, clinical guidelines, terminology, drug names and drug dosages), and is not responsible for any error and/or omissions arising from translation and adaptation or otherwise.