Article Text

Abstract
Objectives To investigate the extent to which temperature and influenza explained seasonality of mortality in Japan and to examine the association of the seasonality with prefecture-specific characteristics.
Design We conducted time-series analysis to estimate the seasonal amplitude before and after adjusting for temperature and/or influenza-like illness (ILI). Next, we applied linear mixed effect models to investigate the association of seasonal amplitudes with each indicator on prefecture-specific characteristics on climate, demographic and socioeconomic factors and adaptations.
Setting 47 prefectures in Japan
Participants Deaths for all-cause, circulatory, and respiratory disease between 1999 and 2015.
Outcome measures Peak-to-trough ratio (PTR, a measure of seasonal amplitude).
Results The nationwide unadjusted-PTRs for all-cause, circulatory and respiratory mortality were 1.29 (95% CIs: 1.28 to 1.31), 1.55 (95% CI: 1.52 to 1.57) and 1.45 (95% CI: 1.43 to 1.48), respectively. These PTRs reduced substantially after adjusting for temperature but very little after a separate adjustment for ILI. Furthermore, seasonal amplitudes varied between prefectures. However, there was no strong evidence for the associations of PTR with the indicators on prefecture-specific characteristics.
Conclusions Seasonality of mortality is primarily driven by temperature in Japan. The spatial variation in seasonal amplitudes was not associated with prefecture-specific characteristics. Although further investigations are required to confirm our findings, this study can help us gain a better understanding of the mechanisms underlying seasonality of mortality.
- epidemiology
- public health
- preventive medicine
Data availability statement
Data are available upon reasonable request. Data and code are available upon request by email to the first author.
This is an open access article distributed in accordance with the Creative Commons Attribution Non Commercial (CC BY-NC 4.0) license, which permits others to distribute, remix, adapt, build upon this work non-commercially, and license their derivative works on different terms, provided the original work is properly cited, appropriate credit is given, any changes made indicated, and the use is non-commercial. See: http://creativecommons.org/licenses/by-nc/4.0/.
Statistics from Altmetric.com
Strengths and limitations of this study
We investigated the contributions of temperature versus influenza to seasonal variation of different types of mortality by a common study design and statistical framework.
We used indicators on a range of location-specific characteristics to investigate their modifying effect on seasonal variations in mortality.
The study was conducted in Japan characterised by distinct seasonal weather conditions, so our results may not be generalised to locations with different climate (eg, tropical countries).
The deviance of residuals showed some autocorrelations, but it had limited impacts on our seasonality estimates.
Introduction
Seasonality of mortality is among the oldest observation across a broad range of population and geographical locations, typically entailing higher mortality in cold seasons than in warm seasons.1–6 This epidemiological phenomenon reflects a complex interaction between environment and human.2 The understanding of its underlying drivers is yet to be elucidated.
Some of the postulated contributors to seasonality of mortality include temperature, infectious disease, air pollution, physiological responses and human behaviours.1 2 7–9 Temperature is of most profound interest, with overwhelming evidence on its cold and hot effect on mortality.10 Another well recognised contributor to seasonality is influenza, due to its strong seasonal cycle and association with inflammatory process.11 A number of studies demonstrated an association between influenza and mortality in cold seasons.11–15 Some of them focused on its role in temperature-mortality associations.11 12 Other publications assessed its contribution to winter-season increase in mortality.13–15 Although consensus exists that both temperature and influenza contribute to winter-season increase in mortality,11–14 16 their relative importance has not been completely elucidated. Most research11–14 16 has focused on either temperature or influenza only, and few studies have comparatively assessed their contribution to seasonality of mortality. We are aware of only one study that has compared their contributions to seasonality of all-cause mortality among people aged ≥75 years in Britain and suggested more seasonality was explained by temperature than influenza.14
The strength of seasonality in mortality varies geographically.8 For example, a larger seasonal amplitude was observed in areas with milder climates, suggesting that individuals living in warm areas might be more vulnerable to seasonal variations in mortality.2 Several local characteristics on climate, demographic and socioeconomic factors, and adaptations have been linked with such spatial variation. However, only a few studies have evaluated their impact on effect on seasonality of mortality.1 17 Another question remains unclear is if their impact effect will remain when we remove the effect of temperature and influenza from seasonal variations in mortality, given that the same local characteristics can also modify associations between influenza, temperature and mortality.18–23
In the current study, we collected daily mortality data between 1999 and 2015 from 47 prefectures in Japan to investigate the contribution of temperature and influenza to seasonality of mortality as well as to study the associations between prefecture-specific indicators and seasonality of mortality. This study will strengthen our understanding of seasonality of mortality and provide important evidence to associate managements of seasonal risk factors to local conditions.
Method
Data collection
Hourly mean temperature (°C) and relative humidity (%) measured at a single monitoring site in the capital city of each prefecture were obtained from 1999 to 2015 from the Japan Meteorological Agency. We computed daily mean value of temperature and relative humidity for our analysis.
Daily mortality (counts) from all-cause, circulatory, respiratory disease and influenza were obtained from the Ministry of Health, Labor and Welfare of Japan between 1999 and 2015 for each prefecture in Japan. The principal cause of death statistics is coded using the International Statistical Classification of Diseases and Related Health Problems, 10th version (ICD-10). Cause-specific mortality was defined according to the ICD system: circulatory mortality (ICD-10 codes I00-I99), and respiratory mortality (ICD-10 codes J00-J99). Weekly number of influenza-like illness (ILI) were obtained for each prefecture from April 1999 to 2015 from National Institute of Infectious Diseases, Japan.
Yearly data on prefecture-specific indicators were collected over the study period for each prefecture, including annual mean temperature, relative humidity, population density, the proportion of population aged ≥65 years, saving, income, Gini index (a measure of income inequality), consumer price index, economic power index (EPI, a measure of the wealth of a prefecture), the prevalence of air conditioning for households and the number of registered physicians, nurses and hospital beds per 10 000 population. For each indicator, we computed the averaged value across the years 1999–2015 for each prefecture. The details for data collection were described in previous studies24 25 and summarised in online supplemental material.
Supplemental material
Data analysis
We conducted our data analysis in three steps. First, we assessed seasonality of mortality without adjustments for temperature or ILI. Then, we examined the changes in the seasonality after adjusting for temperature and ILI separately, as well as both at the same time. Lastly, we evaluated the associations between each indicator and seasonality estimates before and after adjustments.
We applied a generalised linear model with a quasi-Poisson family to assess seasonality of mortality in each prefecture without any adjustment for temperature and ILI. Day-of-year was treated as an indicator for seasonality, taking values from 1 to 366 corresponding to 1 January through 31 December for both common and leap years (from 60th day to 365th day in common years, values were taken from 61 to 366). We used a cyclic cubic spline with 4 df for day of year to estimate seasonality. The days-of-year with maximum and minimum mortality estimates from generalised linear models were identified as the peak and trough days, respectively, and were subsequently used to calculate the peak-to-trough ratio (PTR) to provide a measure of seasonality. When constructing CIs for PTR, previous studies enforced the boundary constraint by truncating the lower confidence limit at one for PTR.26 27 However, doing that may introduce a positive bias into the PTR.28 In order to show the statistical variability in PTR, therefore, we did not truncate the lower confidence limit at one for PTR. Indicators for year, day-of-week and their interaction were used to control for the long-term trend and the effect of day-of-week. We excluded the data on 11 March 2011, the day of the Great East Japan Earthquake.
To assess the contribution of temperature and ILI to seasonality of mortality, we attempted three types of adjustment. First, we added temperature to our main model using a bi-dimensional cross-basis function to account for its non-linear and delayed effect on mortality. We modelled the exposure-response curve with a natural cubic B-spline with three internal knots at 25th, 50th, and 75th percentiles of temperature distribution, and the lag-response association with another natural cubic spline basis with 3 df with extended lags up to 21 days.10 25
Second, we removed temperature and adjusted for ILI in main model. We assumed ILI cases distributed evenly across day of week and computed daily average ILI cases. A natural cubic spline with 3 df was then used to control for daily ILI cases in the model. Third, adjustment was made using both temperature and influenza.
The prefecture-specific PTR was pooled for the whole of Japan for all-cause, circulatory and respiratory mortality, respectively, by meta-analysis with prefecture as a random factor. To explore if patterns of interest varied over time, we conducted yearly analyses for the entire country using separate quasi-Poisson regression model for each year with prefecture as a random factor.
To evaluate the modification of seasonal variation in mortality by prefecture-specific indicators, we applied linear mixed effects models (LMEMs) to investigate associations of PTR with each prefecture-specific indicator separately. We fitted LMEMs with random intercepts for prefectures and the inverse of squared SE as weight. The longitude and latitude for the capital city of each prefecture were included to reduce spatial correlation, except for when we investigated annual mean temperature as the indicator, due to their high correlation. We conducted the analysis for all-cause, circulatory and respiratory mortality in separate LMEMs. Results are expressed as the log(PTR) variation for a SD increase of the indicator.
We performed a series of sensitivity analysis to confirm our findings. We tested the cyclic spline function for day of year with different df of 5 and 6 and adjusted temperature by changing the spline function, internal knots for temperature distribution, df and lag days for the lag-response associations. For influenza adjustment, we varied the number of lag days using the moving averages of the previous 7, 14, 21 and 28 days, and tested the natural cubic spline function with 2 df. For ILI adjustment, we tested moving average of previous 7, 14, 21 and 28 days for ILI cases, and 2 df for the natural cubic spline function. Overall, we did not observe substantial changes in our estimates.
The models were summarised in online supplemental material including diagnostic plots. We conducted the analysis with R software, V.3.6.0 (R Development Core Team) using the dlnm and mixmeta packages.
Patient and public involvement
There was no patient or public involvement.
Results
This study included 18 985 036 deaths from all causes, 5 541 277 deaths from circulatory diseases and 2 894 314 deaths from respiratory diseases. The nationwide time series of daily mortality showed a significant seasonal pattern (online supplemental figure S1). Daily mean temperature for the whole country between 1999 and 2015 ranged from −1.0℃ to 30.7℃, with a mean value at 15.6℃ (table 1). ILI cases showed a large variation, ranging from 7 cases to 1 652 147 cases with a median value at 7626 (table 1). Prefecture-specific summary was provided in online supplemental table S1.
Nationwide summary of daily mean temperature (℃), daily death (numbers of cases) and weekly influenza-like illness (ILI) between 1999 and 2015
We observed a high variability for healthcare capacity (online supplemental tables S2 and S3), while a low variability for socioeconomic indicators. Most of the indicators are correlated (online supplemental figure S2). In particular, EPI was highly correlated with population density, proportion of individuals aged over than 65 years old, and numbers of physicians, nurses and hospital beds (correlation >0.70). In addition, saving is highly correlated with income (correlation >0.70).
Figure 1 and table 2 show the pooled results for the whole of Japan for seasonality of all-cause, circulatory and respiratory mortality before and after adjustments for temperature and/or influenza. We observed a clear seasonal pattern with higher numbers of deaths in cold seasons than in warm seasons. Before any adjustments, the nationwide pooled PTR for all-cause, circulatory and respiratory mortality were 1.29 (95% CIs: 1.27 to 1.30), 1.55 (95% CI: 1.52 to 1.57) and 1.45 (95% CI: 1.43 to 1.48), respectively. After adjustments for temperature and ILI, the shape of seasonality remained (figure 1), but its amplitude reduced to different extents. Adjusting for just temperature reduced PTRs substantially in particular for all-cause and circulatory mortality to 1.06 (95% CI: 1.05 to 1.07) and 1.07 (95% CI: 1.05 to 1.09). Adjusting for just ILI reduced PTRs only very slightly to 1.27 (95% CI: 1.26 to1.29), 1.52 (95% CI: 1.49 to 1.55) and 1.40 (95% CI: 1.38 to 1.43) for all-cause, circulatory and respiratory mortality, respectively. Notably, adjusting for temperature and ILI did not flatten the seasonal pattern or reduce the PTR to 1.

Pooled seasonality of all-cause, circulatory and respiratory mortality between 1999 and 2015 before and after adjustments (black: without any adjustment; blue: adjusted for influenza-like illness (ILI) only; green: adjusted for temperature only; red: adjusted for both temperature and ILI). PTR, peak-to-trough ratio.
Nationwide pooled peak-to-trough ratio (PTR) with 95% CI with/without adjustment for temperature and/or influenza-like illness (ILI)
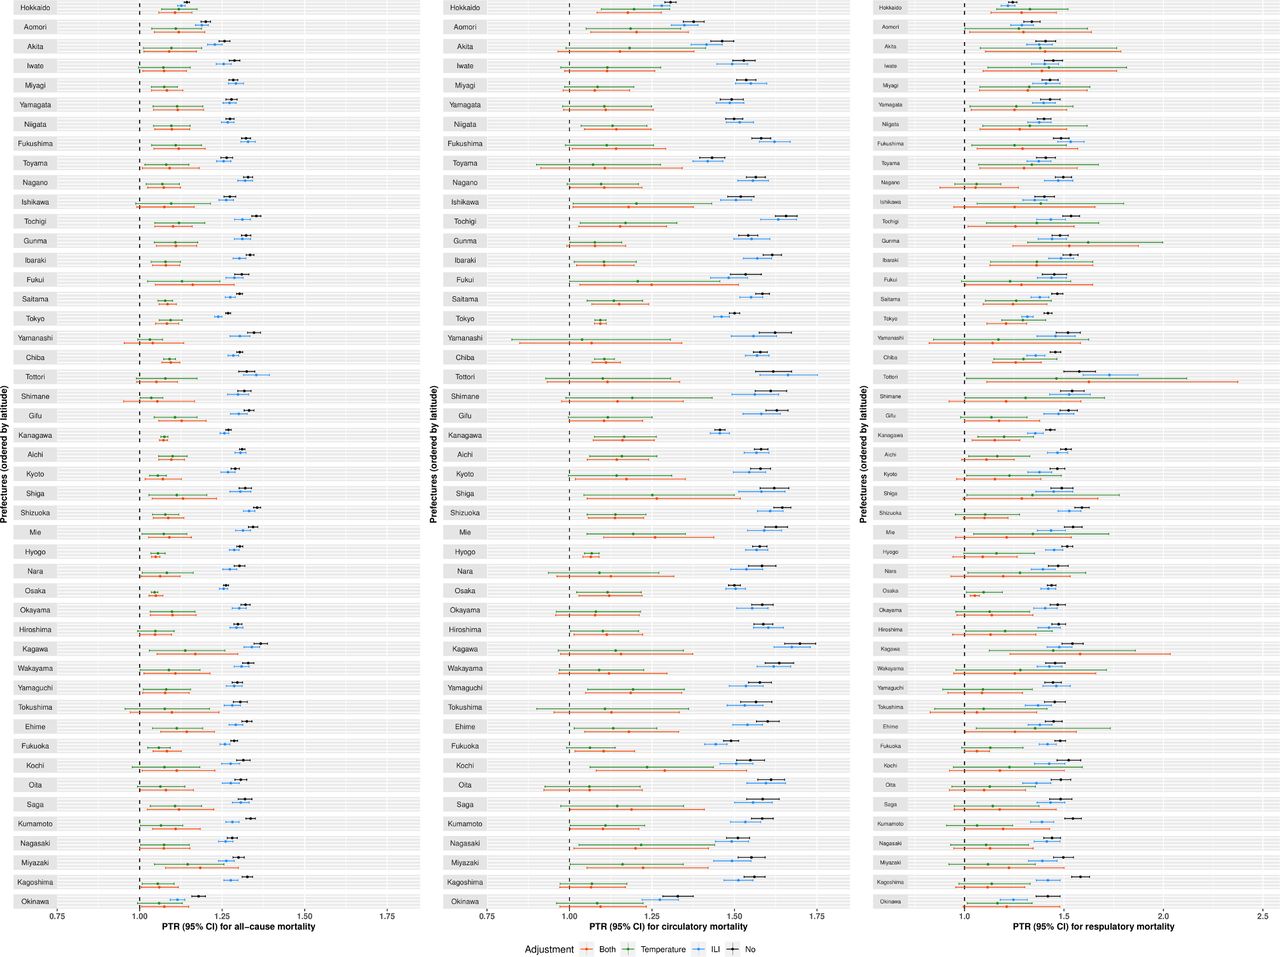
Similarly, prefecture-specific PTRs also showed a substantial reduction with temperature adjustment while a slight reduction when ILI was adjusted only, although an apparent reduction was observed in ILI-adjusted PTR for respiratory mortality (figure 2). Furthermore, PTR for all mortality types varied across prefectures, and the spatial variation after adjustments was less apparent in particular for all-cause and circulatory mortality. Prefectures with higher latitude (northern areas), including Hokkaido, Aomori and Akita, as well as the southernmost prefecture—Okinawa, showed a lower unadjusted-PTR and a smaller reduction after adjustments for temperature.
Prefecture-specific peak-to-trough ratio (PTR) with 95% CIs for all-cause (left), circulatory (middle), and respiratory (right) mortality before (black) and after adjustments for influenza-like illness (ILI) only (blue), temperature only (green) and both (red).
Our yearly analyses for the entire country showed a large reduction after adjusting for temperature while a small reduction after adjusting for ILI for most of the years (online supplemental figure S3). For the year of 2020, however, a higher PTR for all-cause and respiratory mortality was observed when temperature was included in the adjustment. We further checked the sensitivity of our estimates to temperature adjustment. Changing the lag period of 21 days in cross-basis function to 14 days reduced temperature-adjusted PTR, although it remained slightly higher than unadjusted PTR with a largely overlapped CIs. The results for the other years did not change much (results not shown).
Online supplemental figure S4 shows associations between the indicators and PTR. There was no strong evidence for the association between prefecture-specific characteristics and seasonality estimates. Diagnostic plots for models were included in supplementary material (online supplemental figures S5–S7).
Discussion
In this study, we investigated the contribution of temperature and influenza to seasonal variation of mortality in 47 prefectures of Japan and evaluated the modifications of seasonality by a range of prefecture-specific indicators. Our findings show that seasonal variation in mortality was substantially contributed by temperature and to a lesser extent, by influenza. In addition, seasonal amplitudes varied between prefectures. There was no strong evidence for the association between prefecture-specific characteristics and seasonal amplitudes.
Temperature and influenza have been among the most studied drivers of seasonality of mortality.13–16 However, most of the investigations focused on either temperature or influenza. How much of seasonality of mortality is dependent on temperature versus influenza remain unsolved. Our finding showed that most of seasonality of mortality in Japan was attributable to temperature while little was driven by influenza. Consistent with our findings, a population-based cohort study in elderly British people examined month-to-month variation in mortality and its relationship with temperature and influenza A, and discovered that most of seasonal fluctuation was associated with cold temperature and a small component related with influenza A. Despite the smaller contribution of influenza to seasonal variation of mortality than temperature, our analysis suggested that influenza was accountable for seasonal variation, especially, for respiratory mortality. The transmission of influenza virus is most efficient under cold and dry conditions, which may lead to considerable increase in mortality during winter. For example, a study11 in 48 US cities observed a link between influenza epidemic and the irregularly high winter mortality in some certain years. Evidence thus far implies that temperature contributes substantially to seasonality of mortality in general, while influenza is related with seasonal variations of mortality to a less extent.
Notably, removing the effect of temperature and influenza from seasonal variation in mortality did not completely flatten the seasonal pattern of mortality, in particular, respiratory mortality. Seasonality of mortality is resulted from complex interaction between human behaviour and environment. In addition to temperature and influenza, other infectious diseases (eg, respiratory syncytial virus), air pollutants, behavioural changes based on a seasonal basis (eg, dietary pattern and physical activities) have been linked with seasonal variation of diseases and mortality. However, there is no direct evidence assessing their contribution to seasonality of mortality.
Despite of a similar seasonal shape across prefectures, seasonal amplitudes varied across 47 prefectures. Previous studies have suggested that individuals living in cold locations show less seasonal variation in mortality, partially due to a better cold acclimatisation from the combination of habituation, metabolic adjustment and insulative acclimatisation.8 29–31 In addition, less developed locations is likely to exhibit a larger seasonal variation in mortality,1 which can be related with high vulnerabilities to cold and heat effect of temperature because of poorer housing conditions, lower prevalence of air conditioning and limited access to healthcare.18 23 In our study, we did not observe strong evidence for any associations between prefecture-specific characteristics and seasonal variations in mortality. This could be partially explained by the limited range of variations in the indicators and possible confounding effect between them. Furthermore, our data on the indictors are population-level, and future investigations with individual-level data are recommended to examine these issues.
This study has several limitations. First, our study was conducted in Japan that has distinct seasonal weather conditions, hence our results may not be applicable to other areas with different climate (eg, tropical countries). Second, we assumed the association of mortality with influenza and temperature did not change between 1999 and 2015, and our findings for 2000 were sensitive to temperature adjustment. Furthermore, we observed some autocorrelation in the model residuals despite our attempts to model it (online supplemental figure S6). However, sensitivity testing showed that it had limited impacts on the estimate of seasonality (online supplemental table S4). It is possible that temperature and influenza adjusted PTR may be overestimated due to the measurement error in temperature and influenza.32 However, any such overestimation would be believed to be slight, as the main error here would be of Berkson type, which does not cause bias and hence not compromise confounder control.33 Finally, future investigations should be conducted by extending current data sets to those areas with different climate, and also by including more details for influenza (eg, influenza subtype and vaccination coverage). Results from these investigations would complement our findings in current analysis.
This study presents findings from an epidemiological analysis investigating the role of temperature, influenza and other local characteristics on seasonality of mortality across multiple locations. A strength of current study was the investigation of contributions of temperature versus influenza to seasonal variation of different types of mortality by a common study design and statistical framework, while previous studies mostly focused on either temperature or influenza only.
This study suggests that seasonality of mortality is primarily driven by temperature. Furthermore, seasonal amplitudes varied between prefectures. However, this spatial variation was not explained by the differences in prefecture-specific characteristics on climate, demographic and socioeconomic factors and adaptations. Further investigations are required to confirm our findings. In sum, this study can help us to gain a better understanding of seasonality of mortality.
Data availability statement
Data are available upon reasonable request. Data and code are available upon request by email to the first author.
Ethics statements
Ethics approval
This study used secondary data, with no possibility of personal identification, and an informed consent or an approval by a medical ethics board is not required.
References
Supplementary materials
Supplementary Data
This web only file has been produced by the BMJ Publishing Group from an electronic file supplied by the author(s) and has not been edited for content.
Footnotes
Contributors LM conducted the study, analysed the data and wrote the manuscript. CFSN and XS helped with the statistical analysis and the discussion of the text. MT, LMY and YH contributed to the final version of the manuscript. BA helped with the data analysis and the interpretation of the results. MH contributed to the study design and the discussion of the results.
Funding This work was primarily supported by the Japanese Society for the Promotion of Science (JSPS) KAKENHI, grant number 19K19461.
Disclaimer The funders had no role in study design, data collection and analysis, decision to publish or preparation of the manuscript.
Competing interests None declared.
Provenance and peer review Not commissioned; externally peer reviewed.
Supplemental material This content has been supplied by the author(s). It has not been vetted by BMJ Publishing Group Limited (BMJ) and may not have been peer-reviewed. Any opinions or recommendations discussed are solely those of the author(s) and are not endorsed by BMJ. BMJ disclaims all liability and responsibility arising from any reliance placed on the content. Where the content includes any translated material, BMJ does not warrant the accuracy and reliability of the translations (including but not limited to local regulations, clinical guidelines, terminology, drug names and drug dosages), and is not responsible for any error and/or omissions arising from translation and adaptation or otherwise.