Article Text

Abstract
Objectives This study sought to assess the association between long working hours, psychosocial safety climate (PSC), work engagement (WE) and new major depression symptoms emerging over the next 12 months. PSC is the work climate supporting workplace psychological health.
Setting Australian prospective cohort population data from the states of New South Wales, Western Australia and South Australia.
Participants At Time 1, there were 3921 respondents in the sample. Self-employed, casual temporary, unclassified, those with working hours <35 (37% of 2850) and participants with major depression symptoms at Time 1 (6.7% of 1782) were removed. The final sample was a population-based cohort of 1084 full-time Australian employees.
Primary and secondary outcome measures The planned and measured outcomes were new cases of major depression symptoms.
Results Long working hours were not significantly related to new cases of major depression symptoms; however, when mild cases were removed, the 41–48 and ≥55 long working hour categories were positively related to major depression symptoms. Low PSC was associated with a threefold increase in risk for new major depression symptoms. PSC was not related to long working hours, and long working hours did not mediate the relationship between PSC and new cases of major depression symptoms. The inverse relationship between PSC and major depression symptoms was stronger for males than females. Additional analyses identified that WE was positively related to long working hours. Long working hours (41–48 and ≥55 hours) mediated a positive relationship between WE and major depression symptoms when mild cases of major depression were removed.
Conclusion The results suggest that low workplace PSC and potentially long working hours (41–48; ≥55 hours/week) increase the risk of new major depression symptoms. Furthermore, high WE may increase long working hours and subsequent major depression symptoms.
- mental health
- occupational & industrial medicine
- depression & mood disorders
Data availability statement
Data are available in a public, open-access repository. The data are stored in the Australian Data Archive (ADA) at the Australian National University. The website for this resource is ada.edu.au and the email address is ada@anu.edu.au.
This is an open access article distributed in accordance with the Creative Commons Attribution Non Commercial (CC BY-NC 4.0) license, which permits others to distribute, remix, adapt, build upon this work non-commercially, and license their derivative works on different terms, provided the original work is properly cited, appropriate credit is given, any changes made indicated, and the use is non-commercial. See: http://creativecommons.org/licenses/by-nc/4.0/.
Statistics from Altmetric.com
Strengths and limitations of this study
Unlike previous cross-sectional studies, this study uses prospective cohort data across a 12-month period removing employees with major depression symptoms at Time 1 to examine the relationship between psychosocial safety climate, work engagement, long working hours (LWH) and new cases of major depression symptoms.
In contrast to studies of depression aetiology in clinical populations or occupational groups, this article uses data randomly selected from three Australian states to identify lead indicators at a population level to inform policy and intervention.
We use the WHO/International Labour Organization burden of disease recommendations for predefined standardised exposure categories of LWHs to compare risk factor levels.
The sample is possibly characterised by relatively healthy employees with the ability to work ≥35 hours/week leading to a potential underestimation of relationships between working hours and major depression symptoms.
A longer time series of measurement may identify more major depression symptoms as 12 months may be insufficient time to expect LWHs to lead to major depression symptoms.
Introduction
The problem
Depression and other mood disorders are the most common mental illness worldwide with a global lifetime prevalence estimate of 12%.1 Meta-analytic research shows that psychosocial risk factors in the work environment such as job strain, low decision latitude and bullying have a significant impact on the development of depressive symptoms,2 but evidence to support the prospective association of long working hours (LWH) with the risk of major depressive symptoms,2 3 and major depressive disorder clinically diagnosed or assessed by a structured interview,4 is mixed. International Labour Organization (ILO) statistics estimate that 22% of the global working population, or 614.2 million workers, are working long hours of more than 48 hours/week.5 LWHs across the world, currently increasing in response to the COVID-19 pandemic,6 7 present serious implications for mental health. Understanding the role of LWHs in the development of major depression symptoms, and how psychosocial safety climate (PSC) and work engagement (WE) may influence this relationship, will improve the prioritisation of preventive measures for clinicians and policymakers to promote mental health, including workplace redesign, legislation and guidelines for minimum risk exposure.
Depression
Major depression affects an estimated 300 million people across the world and has become a pervasive global burden across cultures.8 Major depression has a high risk of recurrence and leads to functional impairment, elevated morbidity and mortality, and destructive social and economic consequences.9 Despite increases in treatment provision there has been no strong evidence of a decreased prevalence of major depression symptoms in the population suggesting the importance of the investigation of broader risk factors to develop strategic prevention approaches.10 Evidence suggests that major depression symptoms can be an outcome of poorly functioning work environments.2 11–16 Risk factors in the work environment have been identified using theoretical models of work stress including the job-demand-control model,17 effort-reward imbalance (ERI) model18 and models of organisational injustice.19 20 Systematic reviews and meta-analyses have linked these workplace psychosocial risk factors to depression. Specific psychosocial risk factors with a high or moderate level of evidence include job strain (high psychological demands and low decision latitude),2 14 21 high job demands,12 14 low social support,12 low decision latitude,2 14 organisational injustice,14 ERI14 22 and bullying.2 14 Yet evidence for the relationship between LWHs and depression is currently limited.2 3 22
Long working hours
Prospective studies of the relationship between LWHs and depression are preferred as cross-sectional designs risk inflating associations when self-reported descriptions of both explanatory and dependent factors are used.2 Four systematic reviews and/or meta-analyses have examined the prospective relationship between LWHs and depression. The first, citing three prospective cohort studies and one cross-sectional study, identified an association between LWHs and depressive state.23 The second, using six cohort studies, found limited evidence for women and very limited evidence for men for the association between LWHs and depressive symptoms.2 The third, reviewing seven cohort studies, did not find a statistically significant association between working ≥50 hours/week and risk of depressive disorders clinically diagnosed or assessed by a structured interview.4 Finally, a meta-analysis of 10 published and 18 unpublished prospective cohort studies did not identify gender differences, but found an association between LWHs and depressive symptoms which was higher in Asian studies, weaker in Europe and not present in North America and Australia.3
Hypothesis 1 (H1). There is a positive relationship between LWHs and the development of new cases of major depression symptoms.
Although the literature is mixed, we explore sex differences in the relationship between LWHs and depression. Historically, women have been more adversely affected by overtime work,24 25 yet recent systematic reviews and meta-analyses of gender differences are divided with some finding no differences3 23 and others finding some limited evidence that there is a stronger association between LWHs and depressive disorder for women.2 4 Type of work has also been explored with one systematic review and meta-analysis finding no differences in the relationship between LWHs and depression between occupational groups,4 despite other longitudinal studies suggesting that groups working in jobs involving heavy manual labour are more likely to work longer hours, and hence develop depression.26
The PSC context
In the current literature there are no prospective population-based cohort studies of how the work climate influences LWHs and subsequent depression. It is important to understand this relationship because the climate, specifically PSC, as a leading indicator of workplace psychosocial risks,27–29 may be an effective target for intervention by clinicians and policymakers to prevent new major depression symptoms. PSC theory proposes that the origin of poor workplace mental health, such as depression, begins at the organisational level via management practices, priorities and values, before the development of the specific job-level characteristics, such as high job demands and low resources emphasised in dominant work stress theories.29–34
Hypothesis 2 (H2). PSC is inversely associated with the development of new cases of major depression symptoms.
Since PSC relates to management values and is a precursor to working conditions, it is likely that when PSC is high, workers will not be encouraged or forced to work long hours, and when PSC is low, there is a likelihood that workers are pressed to work long hours.
Hypothesis 3 (H3). PSC is inversely associated with LWHs.
Bringing these propositions together, we propose that:
Hypothesis 4 (H4). LWHs mediate the relationship between PSC and new cases of major depression symptoms.
Work engagement
Studies define WE as a positive, motivational state of work-related well-being characterised by high levels of vigour, dedication and absorption.35 36
Hypothesis 5 (H5). WE is inversely related to new cases of major depression symptoms.
Given the focus on the promotion of workplace WE in organisations it is important to investigate the relationship between WE, LWHs and new major depression symptoms. Some employees may work long hours because of feelings of dedication to the job.
Hypothesis 6 (H6). WE is positively related to LWHs.
Although WE is prized by organisations seeking high levels of productivity and completion of activities beyond core responsibilities, previous research suggests a relationship with aspects of workaholism and working excessively.37–39 How WE relates to depression is not clear. We explore the open question about whether people who spend vigorous, absorbed and dedicated LWHs, characterised by high levels of WE, are less likely or more likely to develop major depression.
Given that previous findings have been inconsistent, we also explored differences between males and females; as a potential moderator of the relationship between working hours and depression, and as a moderator of the potential relationship between PSC and depression, and WE and depression. In sum, the aim of this study was to examine how PSC, LWHs and WE influence the development of new cases of major depression. Our study extends the current research by assessing how PSC and WE influence LWHs and subsequent new cases of major depression symptoms. The conceptual model is outlined in figure 1.

Proposed mediated model.
Method
Sample
Participants were employees randomly drawn from the Australian population. A computer-assisted telephone interviewing system was used to contact participants who were identified via the Electronic White Pages. Participants were sent an introductory letter providing details of the study and were advised that they would be contacted via telephone. Data were collected from workers over the age of 18. At Time 1 (T1), there were 3921 respondents. Participants were from New South Wales (NSW) (nT1=1321), Western Australia (WA) (nT1=1462) and South Australia (SA) (nT1=1138). The data were representative of the wider Australian population. Response rates (RR) are shown in figure 2 (average for T1 36.7%). Since we are interested in employed workers we removed the self-employed, casual temporary and unclassified since PSC is unlikely to develop in those cases (see figure 2table 1). Next, we removed those with working hours <35 (37% of 2850) (or missing); and then we removed those with major depression symptoms at T1 (6.7% of 1782) (or missing). The final sample was 1084. There were 966 (89%) in permanent full-time employment, 84 (8%) in permanent part-time employment and 34 (3%) in fixed-term contracts. Participants were from a wide range of occupations and industries. There were 661 males (61%) and 423 females (39%) (table 2). Note that the data used in this study are similar to Bailey and colleagues’s28 study but include additional data from another Australian state (SA) and provide data on LWHs. Figure 2 reports the RR at Time 2 (T2) prior to matching.

Selection criteria for logistic regression. *RRs at Time 2 are prior to matching to Time 1 data. RR, response rate.
Sample attrition, employees randomly selected from the populations of New South Wales, Western Australia 2009–2010 and South Australia 2010–2011
Descriptives of study variables, employees randomly selected from the populations of New South Wales, Western Australia 2009–2010 and South Australia 2010–2011
Comparisons of the current data were made with employee population data collected by the Australian Bureau of Statistics (ABS) and suggest that the Australian Workplace Barometer (AWB) data set is a good reflection of working adults in terms of gender, working hours and income. When the sample was restricted to employees working ≥35 hours/week, women were only slightly over-represented in the ≥35 hours sample compared with national population data (by 1.4%). The study sample comprised 61% male and 39% female participants compared with ABS data which are 62.4% male and 37.6% female participants.40 ABS data report that 8.6 million Australians are working full-time while 4.1 million (32%) are working part-time hours (<35).41 The study removed 37% of the original sample working <35 hours/week.
Patient and public involvement
Public involvement included representation on a project steering group; and broader consultation with public bodies including SafeWork Australia, SafeWork SA, the ILO and Eurofound. Public feedback on the survey tool informed the question interpretation. The initial survey was pilot tested using a public sample.42
Measures
Age was assessed in years. Gender (male=1, female=2) and income were categorised as shown in table 2.
Long working hours
To assess relevant levels of occupational exposure to LWHs, we used the categories of 35–40, 41–48, 49–54 and ≥55 hours/week, and used the theoretical minimum risk exposure of 35–40 hours/week as the reference category. Recently, there has been a debate on how to define LWHs. Conceptualisations of LWHs vary across studies ranging from 40 to 55 hours or more.3 4 23 43–46 This study uses the levels of occupational exposure used in the recent WHO protocol for the systematic review of exposure to LWHs and prospective risk of depression with a theoretical minimum risk exposure level of 41 hours/week and four exposure-level categories of 35–40, 41–48, 49–54 and ≥55.46
Psychosocial safety climate
We used the PSC 12-item scale.47 Each of the four subscales contains three items as follows: (1) Management commitment assesses senior management commitment to psychological health. An example item is ‘Senior management acts decisively when a concern of an employee’s psychological status is raised’. (2) Management priority measures the organisational and senior management priority for psychological health with an example item, ‘Senior management considers employee psychological health to be as important as productivity’. (3) Organisational communication measures opportunities for communication in the organisation about psychological health issues, and an example is ‘There is good communication here about psychological safety issues which affect me’. (4) Organisational participation measures the degree of involvement and participation, such as ‘Employees are encouraged to become involved in psychological safety matters’. All items were measured on a 5-point Likert scale, ranging from 1 (strongly disagree) to 5 (strongly agree). Alpha for the continuous measure was αT1=0.94. We coded 0 to 37=0 as low PSC, high risk; and 37.01 to highest=1 as high PSC, low risk, based on benchmarking work by Bailey et al using this data set (and variations of it) that identified PSC of 37 or less for high risk of moderate to severe depression.28
Work engagement
WE was included for additional analyses and was measured with the nine-item Utrecht Work Engagement Scale with example items ‘At my work, I feel bursting with energy’ and ‘I am enthusiastic about my work’.48 All items were measured on a 7-point Likert scale, ranging from 1=never to 7=every day. When used dichotomously, 0=scores less than the mean, 1=scores greater than the mean (αT1=0.84).
Major depression symptoms
The nine-item Patient Health Questionnaire (PHQ-9)49 was used to measure major depression symptoms. The PHQ-9 is the most commonly used tool for screening major depression in primary care with combined sensitivity and specificity maximised at a cut-off score of 10 or above.50 The time reference of the scale was adjusted to the last 4 weeks for reasons of consistency with other measures in the omnibus tool (Australian Workplace Barometer). The items were measured on a 4-point Likert scale: 0 (not at all), 1 (several days), 2 (more than half the days), 3 (nearly every day), and an example item is ‘During the last month, how often were you bothered by feeling down, depressed, or hopeless?’ Depression levels are indicated by scores 0–4 (no depression), 5–9 (mild, subclinical), 10–14 (moderate, clinical), 15–19 (moderately severe, clinical) and 20–27 (severe, clinical).51 For this study, we designated major depression symptoms as scores ≥10; these have a sensitivity of 88% and a specificity of 88% for a clinical diagnosis of major depression symptoms.46 Major depression symptoms were scored 0=no major depression symptom (0–9) and 1=major depression symptoms (≥10). Alpha for the continuous measure was αT1=0.80; αT2=0.80.
Statistical analysis
Bivariate correlations were completed for the study variables (see table 3). Multiple logistic regression analysis was completed with the study variables to predict new major depression symptoms 12 months after baseline (table 4, models 1–8) and LWHs with PSC (table 5, models 1–3) and WE (table 6, models 1–3). Additional mediation analysis was completed examining the relationship between WE and major depression symptoms mediated by LWHs (table 7). Further supplementary analyses were also conducted predicting a continuous measure of LWHs (online supplemental table 1a, models 1–2). Sensitivity analyses were also conducted removing mild depression symptoms (online supplemental table 2a, model 1; online supplemental table 3a, models 1–3).
Supplemental material
Pearson correlations between study variables
Predicting new major depression symptoms 12 months after baseline; multiple logistic regression analysis
Predicting long working hours with PSC; multiple logistic regression analysis
Predicting long working hours with WE; multiple logistic regression analysis
Relationship between work engagement (WE) and major depression symptoms mediated by long working hours (LWH) (sensitivity analysis)
H1 and H2 were tested using multiple logistic regression with major depression symptoms at T2 (yes=1, no=0) as the dependent variable (see table 4). Age, gender and income were entered as controls on the first step of the regressions (table 4, model 1); LWHs were entered on the second step of the regression (H1) (table 4, model 2); PSC was entered at the third step (H2) (table 4, model 3).
H3 was assessed using logistic regression to identify whether LWHs as a continuous measure regressed on PSC (see table 5, models 1–3). We also used multinominal regression to estimate the odds of working in the long hour categories due to PSC (also measured as a continuous variable) after controlling for age, sex and income (see online supplemental table 1a, model 1).
Mediation H4 is potentially supported if H1, H2 and H3 hold, and H1 holds with PSC as an independent predictor in the model (table 4, model 4). A formal test of H4 was conducted using a Monte Carlo bootstrapping procedure52 which provides more accurate confidence limits and statistical power than other methods53 54 of the indirect effect of PSC on depressive symptoms via LWHs.
Next, we tested hypotheses with WE48 as the predictor and tested H5 (table 4, model 5) and H6 (table 4, model 6; table 6, models 1–3; online supplemental table 2a, model 1) using procedures outlined for H1–H4.
We also conducted a range of additional analyses to assess whether sex was a modifier of expected relationships. We added interaction terms after main effects. Interactions between PSC and sex (table 4, model 7) and WE and sex (table 4, model 8) were also conducted. Finally, we conducted sensitivity analysis where we excluded those with mild symptoms of depression (PHQ-9 scores between 7 and 9) and used multinominal regression to estimate the odds of developing new major depressive symptoms due to PSC and WE measured as continuous variables and LWHs after controlling for age, gender and income (see online supplemental tables 2a and 3a). IBM SPSS V.25 was used for all the statistical analyses.
Results
Analysis of participation data, as shown in table 1, shows no significant difference in the sample that participated at T1 only (n=844) compared with the repeated measures sample (T1 and T2, n=2023) (see figure 2) in terms of hours worked in the past week or levels of depression. However, participants in the matched sample reported significantly less PSC than those who participated at T1 only. In the final sample, 35.3% reported low PSC levels (≤37). Of the LWHs, 16.5% worked very long hours (>55 hours/week) (table 2).
At T1, there were 119 cases (6.6% of 1795) of major depression symptoms (scores ≥10) among employees working ≥35 hours/week. After removing T1 cases of major depression symptoms there were 37 new cases of major depression symptoms at T2 (3.4% of 1084).
As shown in table 3, the older the participants, the lower the level of major depression symptoms; women were more likely to be depressed, report less income and work less hours than men. Income levels were not related to major depression symptoms. Income was positively related to hours worked, that is, those with more income were working longer hours. PSC was not associated with the demographic measures but was inversely related to major depression symptoms. Likewise, long hours worked were positively related to major depression symptoms at both time points but the effects were much smaller.
Table 4 shows the results of the multiple logistic regression predicting new cases of major depression symptoms. In model 1, we entered the demographics and none were significant. H1 proposed that LWHs would positively relate to new cases of major depressive symptoms. None of the LWH categories were related to major depression symptoms (table 4, model 2). H1 was not supported.
H2 proposed that PSC would be inversely related to new cases of major depression symptoms. As shown in model 3 (table 4), PSC was inversely associated with depression (B=−1.15, SE=0.35, p<0.001, OR=0.32, 95% CI 0.16 to 0.63). Low PSC was associated with a threefold increase in risk for new major depression symptoms.
H3 proposed that PSC is inversely related to LWHs. We ran a logistic regression model (table 5), regressing LWHs on PSC accounting for age, gender and income for three separate categories of LWHs including 41–48 hours (table 5, model 1), 49–54 hours (table 5, model 2) and ≥55 hours (table 5, model 3). The effects were not significant for each of these categories. H3 was not supported. Notably, higher age increased the odds of being in the 41–48 hour (table 5, model 1) and ≥55 hour categories (table 5, model 3), larger income increased the odds of working in all of the LWH categories (table 5, models 1–3) and being male increased the odds of working in the 49–54 hour (table 5, model 2) and ≥55 hour (table 5, model 3) categories. We also tested H3 using multinomial regression to estimate the odds of working in the long hour categories due to PSC (also measured as a continuous variable). After controlling for age, gender and income there were no significant associations with PSC, indicating that low PSC did not increase the chances of being in the LWH categories (see online supplemental table 1a, model 1). H3 was again not supported.
H4 proposed that the relationship between PSC and depression would be mediated by LWHs; since H1 and H3 were not supported, this hypothesis was not supported.
H5 proposed that WE is negatively associated with depressive symptoms and was not supported (table 4, model 5). As shown, WE is not significantly related to major depression symptoms. H6, that engagement is related to LWHs, was supported. WE (dichotomous) was significantly positively related to working 49–54 hours (table 6, model 2) and ≥55 hours (table 6, model 3) compared with the reference group (35–40 hours). Since LWHs were not related to depression with WE in the model (table 4, model 6) this implied that WE was not related to depression via LWHs.
We conducted sensitivity analysis excluding those with mild symptoms of depression (PHQ-9 scores between 7 and 9) controlling for age, gender and income, and with PSC and WE as continuous measures (see online supplemental table 2a, model 1). Being in the 41–48 LWH category (B=0.96, SE=0.46, p=0.04, lower bound (LB)=0.16, upper bound (UB)=0.96) and in the ≥55 hour category (B=1.06, SE=0.50, p=0.03, LB=0.13, UB=0.92) increased the odds of developing major depression symptoms. H1 was partly supported for the first time. There were still significant effects for PSC, indicating that low PSC increased the chance of developing major depression symptoms (B=−0.05, SE=0.02, p=0.04, LB=0.92, UB=0.99). H2 was supported (again). WE was not related to major depression (H5 was not supported again) indicating that WE does not mediate the relationship between PSC and major depression symptoms.
With LWHs as outcomes (see online supplemental table 3a, models 1–3), PSC was not related to long hours (H3 was not supported again). WE was significantly associated with all LWH categories. The odds of being in all three categories of LWHs was increased with higher levels of WE including 41–48 hours (B=0.03, SE=0.01, p=0.01, LB=1.01, UB=1.05) (online supplemental table 3a, model 1), 49–54 hours (B=0.07, SE=0.02, p=0.0001, LB=1.07, UB=1.11) (online supplemental table 3a, model 2) and ≥55 hours (B=0.06, SE=0.01, p=0.0001, LB=1.04, UB=1.10) (online supplemental table 3a, model 3). H6 was supported again.
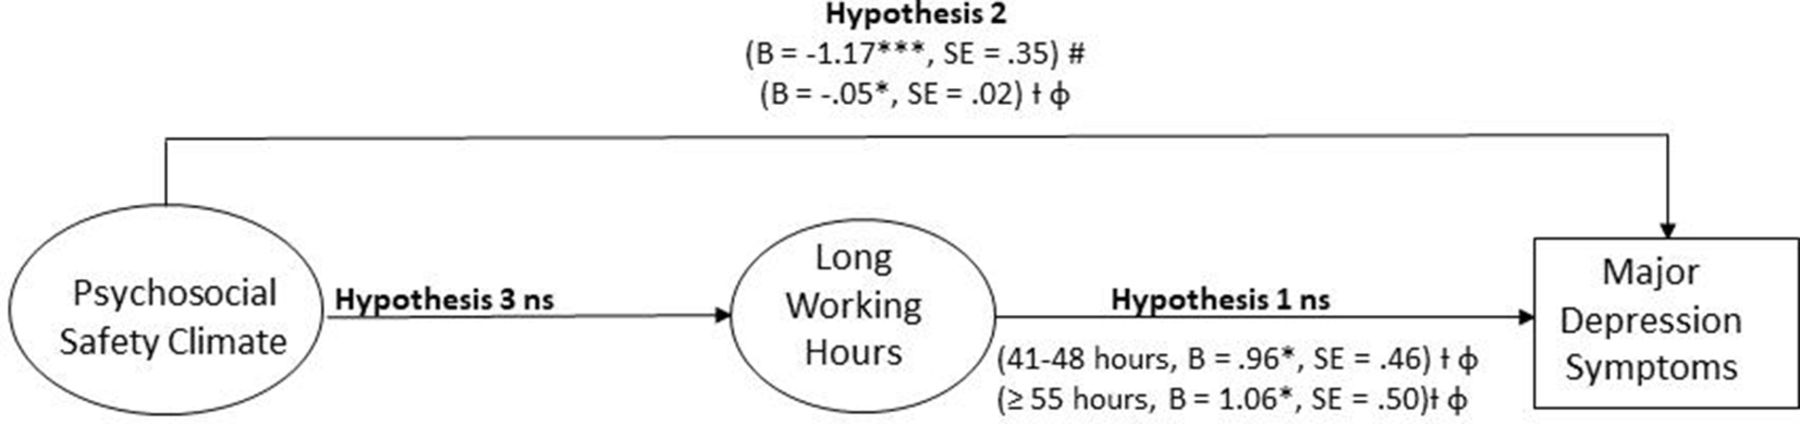
The findings for H1, H2 and H3 are depicted in figure 3 while the findings for H5 and H6 are shown in figure 4 .

Psychosocial safety climate (PSC), long working hours and major depression symptoms. The reference category is 35–40 hours. B, beta coefficient; ns, not significant. #PSC dichotomous. †PSC continuous. φExcluded mild symptoms of major depression (nine-item Patient Health Questionnaire (PHQ-9) scores 7–9), controls for engagement. *p<0.05; **p<0.01; ***p<0.001.

Work engagement, long working hours and major depression symptoms. Reference category is 35–40 hours. B, beta coefficient; ns, not significant. #Engagement dichotomous. †Engagement continuous. φThis model excluded mild symptoms of major depression (nine-item Patient Health Questionnaire (PHQ-9) scores 7–9), controls for psychosocial safety climate (PSC). *p<0.05; **p<0.01; ***p<0.001.
On an exploratory basis, we found support for the first time of a significant mediation effect, engagement linked to depression via 41–48 LWH and the ≥55 hour categories, using a Monte Carlo bootstrapping procedure52 (see table 7).
We explored further sex effects. There was no interaction between PSC and sex on working hours; nor between WE and sex on working hours. There was no significant LWH × sex interaction on depressive symptoms (not tabled). The interaction of PSC × sex on depressive symptoms was calculated and the effect was significant (see table 4, model 7). As shown in figure 5, the negative relationship between PSC and depression was stronger for males (B=−1.77, SE=0.48, p<0.001) than females (B=−0.23, SE=0.55, p=0.68) (see figure 5). We also investigated an WE × sex effect which was also significant (see table 4, model 8). For males, WE was associated with reduced depression, B=−1.14, SE=0.46, p=0.01. For females, the relationship was not significant, B=1.15, SE=0.77, p=0.14 (see figure 6).

Interaction between psychosocial safety climate (PSC) and sex predicting major depression symptoms.

Interaction between WE and sex predicting major depression symptoms.
Discussion
We set out to assess the effect of PSC and LWHs on major depression symptoms. We proposed that LWHs could result from having a poor organisational PSC, and that LWHs would lead to major depression symptoms. Notably, low PSC was associated with a threefold increase in risk for new major depression symptoms. Although LWHs were correlated with major depression symptoms, our results showed that after accounting for confounds LWHs were not related to new cases of major depression symptoms. However, when further sensitivity analyses were conducted, removing mild cases of depression, LWHs (41–48 and ≥55 hours/week) were related to future major depression symptoms. Although we hypothesised a mediated process, PSC negatively predicting LWHs which in turn relates to new major depression symptoms, this was not the case; PSC was not significantly inversely related to excessive working hours.
Additional analyses showed that the odds of being in all three categories of LWHs was increased with higher levels of WE. When mild cases of depression were removed, LWHs mediated the relationship between WE and major depression symptoms for the 41–48 LWH group and the ≥55 hour category. Ultimately, the findings suggest that employees working in high WE environments are more likely to develop major depression symptoms through LWHs. As such, WE, despite being promoted in organisations, may be a risk factor for higher working hours and major depression symptoms. Overly engaged workers might tend to become workaholics ignoring early signals of depressed mood, continue working and develop major depressive disorders. These findings are important because they suggest that policymakers and clinicians should focus the efforts on improving the climate for psychological health, PSC, and consider the potential implications of prioritising and rewarding WE, to prevent new cases of major depression.
Differences between males and females were evident. The negative relationship between PSC and major depression symptoms was stronger for males than females. WE was also negatively related to major depression symptoms for males but not for females. There was no interaction between PSC and sex on working hours; nor between WE and sex on working hours.
Limitations
The use of a standardised self-rating scale (PHQ-9) with different cut-offs to measure degrees of major depression is a potential limitation; however, analysis of the tool across 6000 patients provides strong evidence for sensitivity and specificity of this approach with the proportion of participants (PHQ-9 ≥10) correctly classified with major depression symptoms being 88% and the proportion of participants without major depression symptoms (PHQ-9 <10) also accurately classified as 88% when compared with structured psychiatric interviews completed by a mental health professional.51
Another criticism is that the cut-off of 37 for PSC may have been optimised leading to an overestimation of the true association as some of the sample (WA, NSW and T1 SA) was used for the previous PSC benchmark analysis.28 However, the PSC construct has been used widely across a range of different samples demonstrating similar relationships.55–58 In this study, PSC was also used as a continuous measure and showed similar results.
The participation rate was low (although similar in other countries) and high PSC workplaces had greater attrition (see table 1) which could be problematic if participants with major depression symptoms in high PSC workplaces had lower representation. Despite table 2 demonstrating a much higher sample representation of participants in the high PSC group (n=701) compared with the low PSC group (n=383), attrition of participants in the high PSC group may influence the results.
Our study may have underestimated the relationship between working hours and depression for several reasons. Although people with major depression symptoms at T1 were excluded from the logistic regression analyses, people at T1 with major depression symptoms close to the level of major depression symptoms were included in the analyses. They may cross the critical depression level (PHQ-9 ≥10) in the subsequent time period and be classified as a case, yet they are also those who are probably least able to work long hours because of their symptoms.59 Thus, there is likely to be a ‘healthy worker effect’,60 where healthy workers are more likely to have worked long hours. Such a healthy worker effect is confirmed by Evans-Lacko and Knapp,61 who reported people with previous experience of depression to work 71% full time and 23.4% part-time, compared with 77.2% and 17.6% of people with no depression, respectively.
A second reason for a possible underestimation of the effect of LWHs on depression is that people were only asked to report the number of hours worked during the recent week. The number of working hours in the previous week is unlikely to be a highly valid proxy for the average workload across the entire period. However, longitudinal studies are lacking which assess the consistency of working long hours over an extended period of time and how this impacts major depression symptoms.62
A third reason that our study may have underestimated the relationship between working hours and depression is a possible (negative) confounding effect of PSC. Low PSC may reduce working hours and also may increase reports of depression. Individuals in low PSC environments may be reluctant to report depressive symptoms leading to an underestimation of the relationship between LWHs and depression. This possibility is supported by Evans-Lacko and Knapp,61 who analysed the Impact of Depression in the Workplace in Europe Audit survey data, which comprise approximately 7000 people from seven European countries. They found that ‘living in a country with a greater prevalence of managers saying that they offered help to an employee [ie, high PSC] was associated with a greater likelihood of disclosing depression to an employer’. Whether this argument applies to the Australian population, the population aggregate PSC giving rise to better identification of symptoms is not known.
Several large-scale prospective epidemiological studies reported statistically significant associations between LWHs and depression, but the effect sizes were generally very small.62 For example, one study63 showed that the ORs of working hours as a predictor of depressive symptomatology were not very large (OR=1.19) for those working 52–59 hours/week and for those working ≥60 hours/week (OR=1.62). Similarly, the analysis of data from the Swedish Longitudinal Occupational Survey of Health (n=2791) revealed that cross-lagged effects of workers’ control over working hours had small standardised coefficients between −0.023 and −0.048 only.64 Moreover, their study revealed that workers’ control over time off predicted depression better than control over working hours, suggesting that being able to stop working, for example, when feeling exhausted, is more important than just working less. Australian data reported by Virtanen and colleagues3 based on the Household, Income and Labour Dynamics in Australia65 also did not identify a relationship between LWHs and depressive symptoms. The advantage of the current prospective study is that LWHs were measured first, with major depression symptoms measured in the following 12 months. This removes the potential for existing major depression symptoms to lead to higher (perceived) workload or influence people to work longer hours because their work strategies become less efficacious.66 67
Implications for future research
Evidence suggests that high workplace PSC may prevent future cases of major depression symptoms. The likely reason that PSC showed stronger effects than working hours is that it is mediated by a range of stressful aspects of work. Previous research indicates that low PSC predicts stressful workplace psychosocial factors, such as work pressure,29 32 workload,30 emotional demands,29 30 workplace bullying and harassment,27 28 and job strain (in the form of high demands and low control).28 Future research should investigate the possible moderating effect of PSC and LWHs on the relationship between poor working conditions and depression; particularly within different occupational groupings (eg, white collar compared with blue collar) as high PSC may weaken the relationship while LWHs may strengthen it.62 66
We examined the influence of WE to identify whether people who thrive at work and choose to spend long hours at work are less likely to develop major depression symptoms. Our additional analyses, removing mild cases of depression and controlling for age, gender, income and PSC, indicate that people who have high levels of WE are more likely to work longer hours leading to major depression symptoms. These findings present important implications for organisations seeking to improve WE. It may be more effective to develop organisational systems and climate to protect psychological health (PSC). Further research examining the role of WE and LWHs is recommended.
Change in working life with increasing levels of work from home for some groups may make it difficult to clearly define hours of work. For example, employees answering emails from home in the evenings or weekends may not count these hours as part of their number of hours worked. Disentangling these relationships and the boundaries between work and home life, and the role of unpaid work68 would elucidate these complex relationships and impact on major depression. The burden of LWHs for women may interact with or add to the demands they face at home.25 68 In this regard, gender would be a proxy for additional demands people face outside their work context. Thus, conceptually, home–work interference and work–home interference might be good candidates for possible moderating effects that should be investigated in future research. Also, different time lags could be used; 12 months may be a too short time frame within which to expect LWHs to lead to major depression symptoms.
Data availability statement
Data are available in a public, open-access repository. The data are stored in the Australian Data Archive (ADA) at the Australian National University. The website for this resource is ada.edu.au and the email address is ada@anu.edu.au.
Ethics statements
Ethics approval
Ethics approval was provided by the University of South Australia Ethics Committee (ID: P083-08 and 0000020420) and participants gave informed consent before taking part. All participants gave written informed consent before enrolment in the study, which was conducted in accordance with the principles of the Australian National Statement on Ethical Conduct in Human Research.
References
Supplementary materials
Supplementary Data
This web only file has been produced by the BMJ Publishing Group from an electronic file supplied by the author(s) and has not been edited for content.
Footnotes
Twitter @zadow_i
Contributors AJZ conceived and designed the study, assisted with the statistical analysis and drafted the manuscript. MFD completed the statistical analysis and substantially assisted with the manuscript draft. CD and PL advised on statistical aspects, data interpretation, and contributed to the manuscript draft. All authors reviewed the manuscript and approved the final version to be published. All authors had full access to all the data in the study and take responsibility for the integrity of the data and the accuracy of the data analysis.
Funding This study was supported by three Australian Research Council grants: (1) DP087900 Australian Research Council Discovery Grant. Dollard MF, Winefield AH, LaMontagne AD, Taylor AW, Bakker AB, Mustard C. Working wounded or engaged? Australian work conditions and consequences through the lens of the job demands-resources model. (2) LP100100449 Australian Research Council Linkage Grant. Dollard MF, Winefield AH, Taylor AW, Smith PM, Nafalski A, Bakker A, Dormann C. State, organisational, and team interventions to build psychosocial safety climate using the Australian Workplace Barometer and the StressCafé.(3) FL200100025 Australian Research Council Laureate Fellowship. Dollard MF.
Disclaimer The research was designed, conducted, analysed and interpreted entirely by the authors independent of the funding sources.
Competing interests None declared.
Provenance and peer review Not commissioned; externally peer reviewed.
Supplemental material This content has been supplied by the author(s). It has not been vetted by BMJ Publishing Group Limited (BMJ) and may not have been peer-reviewed. Any opinions or recommendations discussed are solely those of the author(s) and are not endorsed by BMJ. BMJ disclaims all liability and responsibility arising from any reliance placed on the content. Where the content includes any translated material, BMJ does not warrant the accuracy and reliability of the translations (including but not limited to local regulations, clinical guidelines, terminology, drug names and drug dosages), and is not responsible for any error and/or omissions arising from translation and adaptation or otherwise.