Article Text

Abstract
Objectives Diabetes is increasing rapidly in low-income and middle-income countries. We aimed to estimate the prevalence of diabetes, describe its correlates and its associated dietary intake in urban adults from Colombia.
Setting The Colombian Study of Nutritional Profiles was a population-based, cross-sectional, multi-stage probabilistic sampling survey designed to represent the five main Colombian cities.
Participants Between June and November 2018, we studied 736 non-pregnant participants aged 18 or older. Diabetes was defined as a random plasma glucose ≥200 mg/dL, self-reported prior diagnosis of diabetes or use of any oral or injectable antidiabetic medication(s). Participants also fulfilled a detailed 157-item food-frequency questionnaire.
Primary and secondary outcome measures Prevalence of diabetes, dietary intake of key nutrients, achievement of dietary goals among individuals with diabetes.
Results The overall estimated prevalence of diabetes was 10.1%, with no difference by sex (9.6% in women, 10.8% in men, p=0.43). The association between diabetes and education level depended on sex, diabetes was more prevalent among more educated men and less educated women. Abdominal obesity was associated with a 65% increase in diabetes prevalence among men, and a 163% increase in women. Individuals with diabetes reported lower mean consumption of all nutrients, but after adjustment by sex, age, socioeconomic level (SEL) and body mass index, only their lower sodium consumption remained significant (p=0.013). The proportion of non-achievement of dietary intake goals among participants with diabetes was 94.4% for saturated fats, 86.7% for sodium, 84.4% for fibre and 80% for trans fats. In multivariate logistic regression models, age was the strongest independent correlate of diabetes.
Conclusions Diabetes by self-report, random plasma glucose or medication use was highly prevalent among Colombian adults. There were large differences by abdominal obesity status, region of residence, SEL and educational level. The proportion of individuals with diabetes meeting dietary recommendations was alarmingly low.
- general diabetes
- preventive medicine
- epidemiology
- nutrition & dietetics
Data availability statement
Data are available in a public, open access repository. The study dataset and its associated variable definitions file have been publicly deposited in the dryad repository, they can be consulted under the following link: https://doi.org/10.5061/dryad.sqv9s4n2n.
This is an open access article distributed in accordance with the Creative Commons Attribution Non Commercial (CC BY-NC 4.0) license, which permits others to distribute, remix, adapt, build upon this work non-commercially, and license their derivative works on different terms, provided the original work is properly cited, appropriate credit is given, any changes made indicated, and the use is non-commercial. See: http://creativecommons.org/licenses/by-nc/4.0/.
Statistics from Altmetric.com
Strengths and limitations of this study
The study explored the prevalence of diabetes and its associated dietary nutrient intake, as well as their relationship to key demographic factors.
The study had a population-based, probabilistic sample from five cities in Colombia.
Dietary intake was assessed with a food frequency questionnaire adapted to national and regional dietary habits, and inquiring about usual behaviour, rather than recent intake.
Random plasma glucose and self-reported diabetes may underestimate the real diabetes prevalence compared with oral glucose tolerance tests or glycated haemoglobin measurement.
Our study did not include any participants from rural areas, whose diabetes prevalence and associated diet may differ significantly from those of urban populations.
Introduction
The number of deaths attributed to diabetes in the year 2010 was 3.96 million, on average every eight seconds one person died from diabetes somewhere in the world.1 It is estimated that, if current trends persist, 700 million adults will live with diabetes by 2045.2 As life expectancy increases, the number of older adults with diabetes will rise from 136 million to 276 million.2
In South and Central America, the age-adjusted prevalence of diabetes has been estimated at 8.5% in 2019 and is expected to advance to 9.9% by 2045.2 3 Brazil and Mexico, the most populated countries in the region, occupy, respectively the fifth and sixth position in the ranking of countries with the most people with diabetes worldwide.2 The prevalence of diabetes varies widely across Latin American countries. Current data show that Puerto Rico and Mexico are the countries with the highest prevalence in the region (13.7% and 13.5%, respectively), while Ecuador (5.5%) and Argentina (5.9%) have the lowest.1 4–8 Latin America is the region where diabetes represents the largest proportion of total health expenditure (around 20% of total).2 The cost of diabetes in Latin America and the Caribbean in 2015 was estimated at 103–142 billion dollars, a sixfold to sevenfold increase relative to 2000.9 Rapid urbanisation and ageing are the two main drivers of the diabetes epidemic in Latin America.10
It is expected that, over the coming decades, the largest increase in people with diabetes will occur in countries experimenting the low-income to middle-income transition.1 11 12 The Prospective Urban and Rural Epidemiology (PURE) study found that lower-income countries had the highest age and sex-adjusted prevalence of diabetes (average 12.3%), followed by upper-middle (average 11.1%), lower-middle (average 8.7%) and high-income countries (average 6.6%).13
Colombia is a South American country of about 48 million inhabitants, in which no recent population-based studies exploring the prevalence of diabetes or the comparative characteristics of dietary intake among individuals with diabetes are available. In Colombia, the urbanisation phenomenon has been further complicated by the internal displacement of hundreds of thousands of citizens as a result a protracted internal conflict that only came to an end in the recent years.14 The estimated cost of diabetes in Colombia is the fourth largest in the region below Brazil, Mexico and Venezuela.9 The official sources of information about the burden of diabetes in Colombia are not population-based studies, but claim databases like the High-Cost Account (Cuenta de Alto Costo—CAC),15 a registry kept by an association of Colombian health insurance companies. Another frequently cited source is Integrated Social Protection Information System (Sistema Integrado de Información de Protección Social) (www.sispro.gov.co), a database that compiles all health services and procedures provided by the Colombian health system.16 These sources are useful for planning the provision of health services, but they cannot provide estimations of diabetes and its associated factors at the population level. For instance, the CAC reported a diabetes prevalence of 2.2% between July 2016 and June 2017, a figure far removed from all worldwide data in similar countries and from International Diabetes Federation (IDF) projections.2 5 17 18 Similarly, these official sources based on care provision do not register relevant lifestyle variables, so they do not allow the exploration of dietary habits of people with diabetes in the general population. There are, however, some sources of estimates for the population prevalence of diabetes, but they are confined to a specific population group. Thus, the SABE (from the Spanish SAlud, Bienestar y Envejecimiento—health, well-being and ageing) Colombia study found a rate of self-reported diabetes of 18.5% among adults aged over the age of 60 in 2015.19 A similar prevalence (17.5%) was found in the SABE Bogotá survey of older adults in the country’s capital.20
In Colombia, population-based surveys have demonstrated a notorious increase in both child and adult obesity over the last two decades.21 Such increases parallel those observed in Mexico and other Latin American countries, suggesting that the recent phenomena of mass urbanisation, westernisation of dietary habits and adoption of sedentary behaviours are translating into a demographic and nutrition transition in the whole region.22 These changes have disproportionately affected more economically vulnerable segments of the population.23
In addition to the recent rise in obesity, Colombia has also experienced a slow but sustained increase in life expectancy that started in the second half of the 20th century, especially among women.24 The combination of these factors greatly favours the development of diabetes and other chronic diseases, hence, the exploration of the current of diabetes and its associated dietary behaviours is of great importance.
Dietary behaviour is a crucial determinant of the degree of control and the development of chronic complications among individuals with diabetes. Dietary habits have a large impact on various parameters directly related to the risk of chronic complications, among them blood glucose levels, plasma lipids and blood pressure.25 Hence, the adequate documentation and exploration of the dietary habits of this population is of the utmost importance to guide clinical strategies and public health policies aimed at persons with diabetes. Despite the multiple combinations of macronutrients that may be adjusted to each person’s requirements and cultural preferences, most guidelines agree on a few universal goals whose attainment predicts a larger probability of diabetes control, and prevention of chronic complications.26 These goals usually comprise the distribution of calories among the different macronutrients, the restriction of dietary trans fats, sodium and cholesterol, and the provision of an adequate amount of dietary fibre. We expected that most persons with diabetes would attain these dietary goals in Colombian cities. Also, given the known association of diabetes with excess body weight and hence a net positive caloric balance, we expected caloric and nutrient intake to be higher among individuals with diabetes.
Among the Latin American nations, Colombia is characterised by a high degree of geographical, racial and cultural diversity, with five clearly defined regions: (i) the urban central plateau, where the capital city of Bogota is located, (ii) the northern Caribbean region, very similar to countries like Cuba or the Dominican Republic, (iii) the Pacific coast, with major agricultural and industrial development but also with widespread poverty and a high proportion of Afro-Colombian population, (iv) the northwestern or ‘paisa’ region, with a higher Caucasian ancestry and a generally traditionalist population and (v) the northeastern/Andean region, very mountainous and with extensive native Colombian ancestry. Given that 81% of the Colombian population lives currently in urban centres, we undertook a study in five cities, one from each region, in order to answer the following research question: what is the prevalence of diabetes by random plasma glucose, self-report or medication use in the main urban centres of Colombia, and how does the nutrient intake of these individuals compare to that of people without diabetes? An ancillary goal of the study was to explore to what extent do people with diabetes achieve the internationally recommended dietary goals for individuals with diabetes.
Given the recent rise in obesity rates, rapid urbanisation and increased life expectancy, we expected to find a diabetes prevalence greater than that estimated from prior national surveys, but still lower than that of the largest Latin American countries Brazil and Mexico.
Methods
COPEN (Estudio Colombiano de Perfiles Nutricionales—Colombian Study of Nutritional Profiles) was a population-based, cross-sectional, multi-stage sampling survey designed to represent five cities, one from each of Colombia’s major regions: Bogotá (Central plateau), Barranquilla (Caribbean region), Cali (Pacific region), Medellin (Northwest or ‘paisa’ region) and Bucaramanga (northeast/Andean region). The sampling frame was obtained from the last census of the Colombian population, cartography was obtained from the national geostatistical frame developed by the Colombian National Department of Statistics (Departamento Administrativo Nacional de Estadística—DANE) and data on socioeconomic level (SEL) came from the National Superintendence of Public Services. In the first stage of sampling we selected cartographic sectors, within sectors we selected blocks (on average eight per cartographic sector), within blocks we selected households, and within households we selected individual participants. Within each household, individuals were randomly selected employing a Kish grid. The sample was stratified by city, sex, age group and SEL. With this design and including the design effect, the complete study sample yielded an overall sampling error of 2.2%. The sampling errors for each city were, respectively: Bogotá 4.0%, Medellin 5.0%, Cali 5.0%, Barranquilla 5.6% and Bucaramanga 6.8%. We excluded foreigners living in Colombia, individuals in haemodialysis or peritoneal dialysis therapy and persons with disabilities that precluded a reliable fulfilment of the study questionnaire. The complete study sample for COPEN was 1942 individuals, from which a random subsample of 736 non-pregnant participants aged 18 or older (representing 47.8% of all non-pregnant adults in COPEN) participated in the analyses reported in this paper. This was mainly due to cost constraints that did not allow us to perform blood tests in all 1942 COPEN participants. We selected individuals living in the household, regardless of whether they were family members or working at the household. We performed at least two attempts to interview the selected adult. If the individual selected was still not present or declined to participate, he/she was replaced by someone from the same sampling stratum in a different household.
Information was captured using a tablet device containing digital forms with proper validation rules, developed for the study. All staff in charge of data collection was extensively trained by the study principal investigator. A random 10% of participants were recontacted by phone in order to double-check the accuracy of the information provided on date of birth, sex, city of residence, marital status, job status, educational level and date of initial contact. We confirmed data on date of birth, sex, city of residence, SES, marital status job status, educational level and date of initial contact. In all variables, we had over 95% concordance with the values originally reported. All data were collected between June and November 2018. Online supplemental figure 1 summarises the scheme of participant recruitment for the study.
Supplemental material
Patients and public involvement
Respondents and the public were not involved in the design of the study, but aggregated results will be presented to local and national authorities to inform public health policies concerning nutrition and primary prevention of diabetes.
Measurements
We collected information on sex, date of birth, SEL, marital status, educational level and employment status using a standardised questionnaire. Since diabetes incidence rises sharply at age 40 and peaks approximately at age 60,27 age was operationalised for most analyses in three groups: 18–39, 40–59 and 60–75 years. The SEL that we employed for analyses was the one registered in DANE for that particular block. After a brief introduction about the importance of the accuracy of the measurements to be performed, we measured height and weight in all participants, and waist circumference in participants aged 18 and older. Height was measured using a portable stadiometer supported on a firm surface, taking care that the participant was barefoot, standing right and with heels and calves touching the stadiometer. Weight was measured in a solar digital scale with 100 g sensitivity and 200 kg capacity, all study scales were calibrated simultaneously the day before the study start, and every week afterwards. Waist circumference was measured by a sitting observer, directly over the participant’s skin, at the midpoint between the last rib and the anterosuperior iliac crest, using a flexible metallic measuring tape. All measurements were performed in duplicate, and if there was a between-measures discrepancy greater than 1 cm for height, 100 g for weight or 1 cm for waist circumference, a third measurement was collected. For analyses we used the average of each anthropometric measure.
SEL is classified in Colombia by the Statistics Department DANE in 6 strata according to characteristics of the residence (with stratum 1 being the lowest and stratum 6 being the highest).28 Residential dwellings are classified according to their physical characteristics and environment. The methodology for this classification creates homogeneous strata taking as input information about land use, public utilities, access routes, topography, land valuation and property characteristics. The stratification unit is the subzone, corresponding generally to a block. Residential dwellings are classified in the predominant stratum of the subzone, as long as their characteristics do not differ ostensibly from the predominant conditions in the group. Otherwise, they are considered outliers and their stratum is assessed based on their particular characteristics. This information is very well established, updated and freely accessible for all the country. Given that sociodemographic, income and human development indicators are more similar for individuals living in strata 4–6 than among the other strata,28 we analysed SEL in three groups, corresponding to strata 1–2 (low SEL), 3 (medium SEL) and 4–6 (high SEL). Marital status was classified in three categories: (i) single, (ii) married or in cohabitation and (iii) widowed or divorced. Educational level was analysed as the highest completed level in three categories: (i) elementary or lower, (ii) secondary or technical and (iii) professional or higher. We interpreted body mass index (BMI) according to the cut points proposed by the WHO: underweight (BMI<18.5 kg/m2), normal weight (BMI≥18.5 and <25 kg/m2), overweight (BMI≥25 and <30 kg/m2) and obesity (BMI≥30 kg/m2). We defined abdominal obesity as a waist circumference ≥90 cm for women, and ≥94 cm for men, according to the proposed cut-offs for Latin American adults.29
Capillary blood specimens were collected by trained staff following standardised procedures, blood glucose levels were promptly measured and registered using an Accu-Check meter. Since fasting could not be guaranteed, we considered that an individual had diabetes if he/she met one of these three conditions: (i) a capillary blood glucose level ≥200 mg/dL, (ii) a self-reported prior diagnosis of diabetes or (iii) self-reported use of an oral or injectable antidiabetic medication.30
Usual dietary intake was assessed employing a 157-item semi-quantitative food-frequency questionnaire (FFQ). The FFQ was an enhanced and adapted version of an earlier FFQ specifically designed for the Colombian population.31 In a prior validation against four independent 24-hour dietary recalls, a shorter version of the FFQ showed a per cent of classification in the same quartile of nutrient intake between 61% and 83%, and Pearson correlation coefficients between 0.51 for protein and 0.77 for carbohydrate.32 Portion sizes were established according to the reference unit most frequently consumed for each food. There were nine possible ingestion frequencies: (i) never, (ii) one to three times/month, (iii) at least once/week, (iv) two to four times/week, (v) five to six times/week; (vi) once a day, (vii) two to three times a day, (viii) four to five times a day and (ix) six or more times a day. Participants were asked to make their selections based on their usual intake over the last year. FFQs were individually administered by study staff. The nutrient contribution of each food was calculated according to composition tables by the Colombian Institute for Family Welfare (Instituto Colombiano de Bienestar Familiar), the US Department of Agriculture and manufacturer’s information. We only had very general data on physical activity from the International Physical Activity Questionnaire, short form. This instrument has seven questions on the frequency and duration of light, moderate or intense physical activity and approximate number of sitting hours (sedentary behaviour), but we considered that the degree of detail in the variable did not allow for its use as a covariate for adjustment in our analyses. The COPEN protocol and COPEN field materials (in Spanish) are provided as online supplemental materials 1 and 2, respectively.
Supplemental material
Supplemental material
Data analysis
Prevalence of diabetes was estimated using sampling weights reflecting city, sex, age group and SEL-specific expansion factors according to the study multi-stage sampling design. We did not have any missing data points for sociodemographic factors, diabetes status or dietary intake variables. The overall diabetes prevalence, as well as the prevalence for men and women were age-adjusted using the WHO standard population as reference population.33 The univariate associations between nominal predictors and diabetes status were examined using χ2 independence tests. To test for a linear trend in the association between ordinal predictors and diabetes status, we report the p value associated with a rank-correlation (Spearman) test between predictor and outcome. We also ran multivariable logistic models in which sex, age group, SEL and educational level were the independent variables and diabetes status was the outcome. We initially compared mean consumption of macronutrients and micronutrients of interest between individuals with or without diabetes using a one-way analysis of variance (ANOVA), with diabetes as fixed factor. Since a higher BMI is associated with diabetes risk and also with a higher dietary nutrient intake, linear regressions were used to estimate nutrient intakes in participants with or without diabetes adjusted for age, sex, BMI and SEL (one model per nutrient). We explored the achievement of dietary recommendations among individuals with diabetes, expressed as the percent of individuals with diabetes who met the protein (≥15% of total caloric intake (TCI)), saturated fat (SFA) (<7% of TCI), monounsaturated fat (MUFA) (≥12% of TCI) and trans fat (<1 g/day) recommendations set by the by the Latin American Diabetes Association30 and the fibre (14 g per each 1000 calories) and sodium (<2300 mg/day) goals set by the American Diabetes Association.34 In order to explore factors associated with achievement of dietary goals, we also built a series of nested multivariable logistic models, in which achievement of each dietary goal was the outcome. Model 1 had as predictors only sex and age, model 2 had all variables in model 1 plus SEL, model 3 had all variables in model 2 plus city, model 4 had all variables in model 3 plus BMI and model 5 had all variables in model 4 plus diabetes status. All analyses were performed in SPSS for Windows, V.21.
Results
We studied 736 adults (45% men): 132 from Barranquilla, 250 from Bogotá, 86 from Bucaramanga, 126 from Cali and 142 from Medellin. Mean age was 46.1±17.6 years, about a third of participants were older than 60. Mean BMI was higher in women than men. There were similar proportions of single and married participants, while widowed or divorced individuals were the minority. There was approximately one-third of the sample in each of the low, medium and high SEL categories. Only a fifth of study participants had a college or higher degree, and about a fifth had only elementary or lower education (table 1).
Characteristics of the study sample
Compared with the official population data from Colombia reported to the UN,35 the sex and marital status distribution of urban adults aged 20–75 in Colombia was similar to that of our sample. We had a mild over-representation of adults aged 60–75 (28.9 vs 14.5% in the general population). Since we only included the five major cities, we believe this may be due to better living conditions and healthcare in large metropolitan areas that cause a greater longevity in large urban centres.
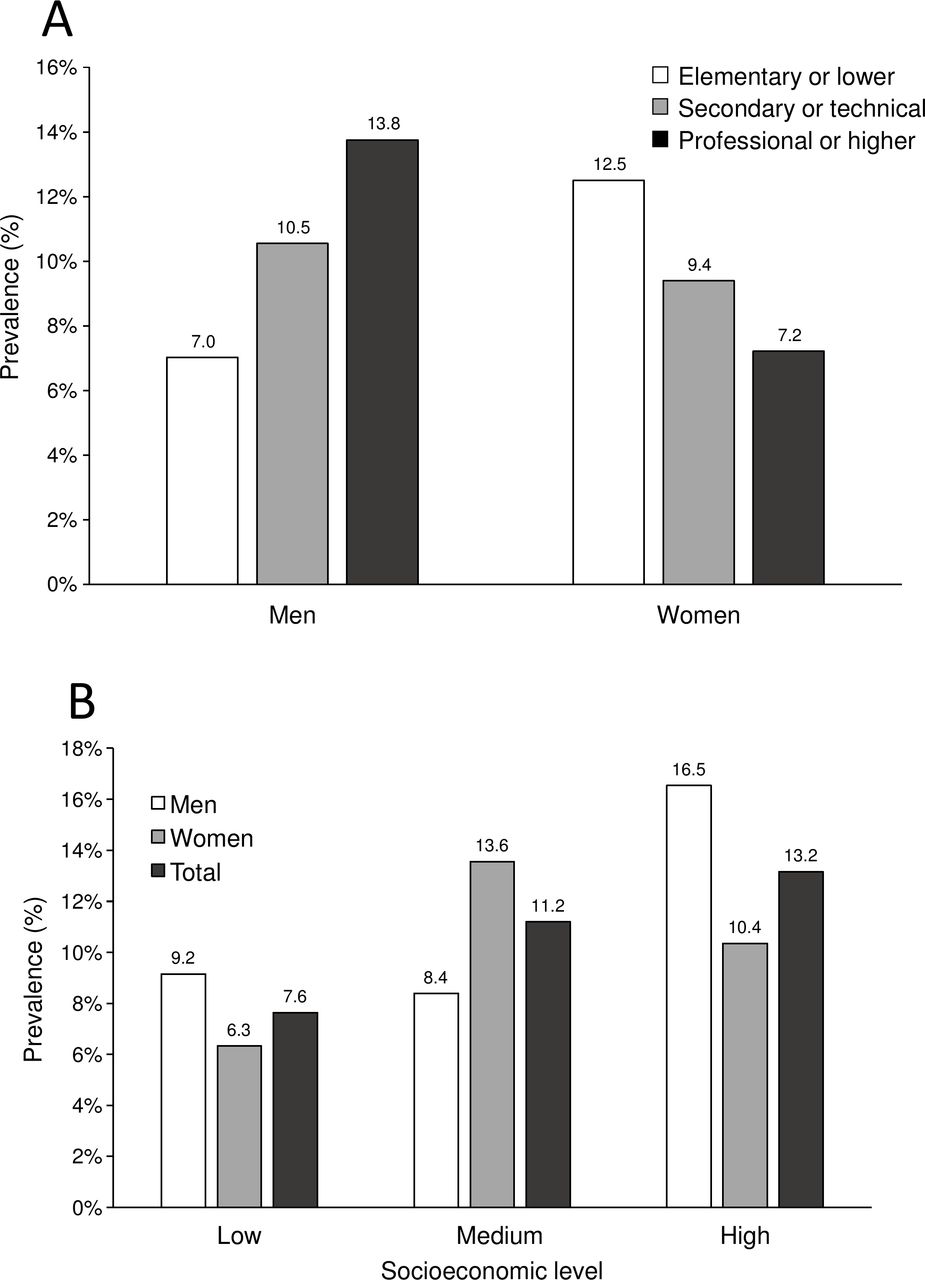
The overall estimated prevalence of diabetes was 10.1%±3.2% (age-adjusted 9.44±3.0%), with no significant difference between sexes (9.6%±4.3% in women, 10.8%±4.7% in men; p=0.43, age-adjusted 9.5%±4.1% in women, 9.2%±4.0% in men) (figure 1). The prevalence was highest in Medellin (20.5%±7.2%), followed by Cali (9.2%±7.5%), Bogotá (8.1%±5.3%), Barranquilla (8.0%±7.9%) and Bucaramanga (7.4%±9.9%). As expected, the prevalence of diabetes increased monotonically with age in both men and women (p for the difference among age groups and p trend both <0.001). For age groups 18–39 and 40–59, men had a numerically higher prevalence of diabetes than women, while in the 60–75 age group the opposite was true (figure 1). The association between educational level and diabetes prevalence was dependent on sex. Among men, prevalence went from 7.0% for those with elementary education or lower, to 13.8% for those with a professional or higher degree. On the other hand, diabetes prevalence among women decreased steadily with higher education, going from 12.5% in the elementary or lower education group, to 7.2% in the professional or higher educational level group (figure 2A). Conversely, diabetes prevalence increased with SEL, so that prevalence in the highest SEL almost doubled that of the lowest SEL (figure 2B) (p value for the trend in diabetes prevalence with increasing SEL=0.04).

Prevalence of diabetes, by age and sex. Data are prevalences using sampling weights. P value for the overall difference in prevalence among age groups <0.001. P value for the trend in diabetes prevalence with increasing age group <0.001.

Prevalence of diabetes, by educational level (A) and socioeconomic level (SEL) (B), and sex. Educational level refers to the highest level completed. SEL was classified according to Colombia’s official Statistics Department-DANE stratification scheme. Low SEL includes strata 1 and 2, medium SEL includes only stratum 3 and high SEL includes strata 4, 5 and 6. Data are prevalences using sampling weights. P value for the overall difference in diabetes prevalence among SELs=0.11. P value for the trend in diabetes prevalence with increasing SEL=0.04.
Diabetes was more common as BMI increased, going from 8.0% in the normal/underweight category to 12.4% for obesity (p trend <0.001). While diabetes was almost equally prevalent among normal weight men and women, it was far more common in the male sex in the overweight and obesity categories (online supplemental figure 2A). Abdominal obesity was strongly associated with diabetes. The relative increase in diabetes prevalence for individuals with abdominal obesity versus without it was 65% in men and 163% (2.63-fold) in women (online supplemental figure 2B).
Unexpectedly, in analyses of dietary nutrient intake, people with diabetes reported a lower consumption of virtually all the nutrients. Consequently, the mean reported daily caloric intake was significantly lower for people with diabetes. This trend was observed for carbohydrates, total lipids, protein, SFA, MUFA and polyunsaturated fats (PUFA), trans fats, cholesterol, sodium and fibre (table 2). The mean daily consumption of trans fats by individuals with diabetes (2.0±1.2 g/day) was significantly lower than in individuals without diabetes (2.4±1.8 g/day, p=0.005), but still much higher than the recommended limit of maximum 1 g/day. Similarly, persons with diabetes reported a significantly lower intake of sodium (3840±1913 mg/day vs 5330±2767 mg/day, p<0.001). People with diabetes showed a trend towards lower consumption of fibre, that did not reach statistical significance (33.2±14.1 g/day vs 37.9±16.9 g/day, p=0.077).
Daily intake of macronutrients, cholesterol, sodium and fibre, by diabetes diagnosis
The macronutrient composition of the diet showed only small variations by diabetes status. For individuals with and without diabetes, the proportions of TCI from each macronutrient were, respectively: carbohydrates 46.8% versus 48.3%, proteins 15.8% versus 14.2% and lipids 36.5% versus 36.1%. Only the slightly higher proportion of TCI from protein was statistically significant (p<0.001) (online supplemental figure 3A). In terms of fat types, there were also very slight differences according to diabetes status. The proportions of TCI coming from each type of fat in individuals with versus without diabetes were, respectively: 11.7% versus 11.1% for SFA, 15.9% versus 14.7% for MUFA and 8.1% versus 8.4% for PUFA (online supplemental figure 3B). The 1.8% higher TCI from MUFA in the diabetes group was statistically significant (p=0.031).
When assessing the compliance of self-reported nutrient intake with current guidelines, the proportion of people with diabetes not meeting the dietary goal for SFA was an alarming 94.4%. Goal non-achievement was similarly high for sodium (86.7%), dietary fibre (84.4%) and trans fats (80%). For protein and MUFA goals, these proportions were lower (45.6% and 16.7%, respectively).
The achievement of dietary goals was associated with demographic factors and with the presence of diabetes (online supplemental table 1). Men were much less likely to achieve the sodium (5.4% vs 11.4% in women) and fibre (8.5% vs 13.1% in women) recommendations. Participants aged 18–39 were less likely to meet the trans fats and sodium recommendations than their older counterparts. Achievement of the trans fats goal was lowest in Bogotá, while for sodium intake the lowest degree of achievement was found in Barranquilla (only 3.8%). Consumption of the recommended amount of dietary fibre was particularly low in Medellin (4.2%). The proportion of people from a high SEL meeting the SFA recommendation was also very low (2.3%). Despite the observed differences in mean nutrient intake between persons with or without diabetes, the degree of goal achievement was only markedly different for sodium (13.3% in diabetes vs 8.0 in no diabetes) and protein (54.4% in diabetes vs 36.4% in no diabetes).
In a mutually adjusted logistical model that included sex, age, city of residence, BMI, SEL and educational level as covariates, only age group (p<0.001) and city of residence (p=0.019) were significant predictors of diabetes status. The ORs relative to age group 18–39 were 2.12 (95% CI 1.09 to 4.01) for age group 40–59 and 4.28 (95% CI 2.24 to 8.19) for age group 60–75 (details of model available on request). Despite the notorious difference in diabetes prevalence between men and women depending on SEL and educational level, the respective interaction terms were not statistically significant (p=0.074 for the sex×SEL interaction, p=0.24 for the sex×educational level interaction term). In this model, the adjusted prevalence of diabetes was significantly higher among men than women in the low SEL (p=0.035).
After adjusting for sex, age, SEL and BMI, the relative difference in nutrient intake between persons with versus without diabetes ranged between −2.7% for cholesterol and −24.7% for PUFA (figure 3). After adjustment by sex, age, SEL and BMI, however, only the lower consumption of sodium among individuals with diabetes retained statistical significance (p=0.013).

Per cent difference in adjusted nutrient intake, between individuals with diabetes and individuals without diabetes. Dots represent medians and lines represent Q1–Q4. Differences were estimated using linear regressions including diabetes status, age, sex, body mass index and socioeconomic level as predictors. *P=0.013 for the adjusted comparison of individuals with versus without diabetes.
In nested logistic models, the variables significantly associated with attainment of dietary recommendations were different for each goal in the fully adjusted model (table 3). Despite the reported lower intake of most nutrients by participants with diabetes, diabetes status only had a significant independent association with meeting the goal for dietary protein (OR 2.03, 95% CI 1.26 to 3.26). Male sex showed a negative association with meeting the dietary recommendations for sodium (OR 0.45, 95% CI 0.25 to 0.82), MUFA (OR 0.60, 95% CI 0.41 to 0.87) and fibre (OR 0.58, 95% CI 0.35 to 0.96). On the other hand, age was positively associated with meeting the recommendations for TFA (OR 1.019 per year, 95% CI 1.007 to 1.031), sodium (OR 1.026 per year, 95% CI 1.008 to 1.044) and fibre (OR 1.036 per year, 95% CI 1.019 to 1.053). Participants from high SEL were more likely to meet the goals for protein (OR 2.01, 95% CI 1.38 to 2.93), but less likely to meet the goal for SFA (OR 0.16, 95% CI 0.06 to 0.42). Individuals with obesity were more likely to reach the dietary protein recommendation (OR 2.02, 95% CI 1.33 to 3.07). Participants from Cali or Bucaramanga were more likely to attain the TFA goal (compared with Bogota), while those from Medellin were less likely to meet the dietary fibre goal.
Predictors of achievement of different dietary recommendations (goals) in multivariate, mutually adjusted logistic regression models
Discussion
We performed a population-based study to describe diabetes prevalence and associated dietary nutrient ingestion patterns in five Colombian cities representing the main regions of the country. We found an overall prevalence of 10.1% based on random plasma glucose, self-reported diabetes or medication use. Diabetes was more common with older age, higher SEL, excess body weight, abdominal obesity and among residents of Medellin. The association between diabetes prevalence and education was dependent on sex: a higher educational level was associated with a lower prevalence of diabetes among women and with a higher prevalence of diabetes among men. People with diabetes reported significantly less caloric intake than those without diabetes, a difference that was also present for most macronutrients, but retained statistical significance after adjustment only in the case of dietary sodium. When compared with current guidelines, the proportion of individuals with diabetes not achieving dietary recommendations for SFA, MUFA, trans fats, fibre and sodium was remarkably high. We also found that the odds of achieving dietary recommendations were largely influenced by sex, age group, city of residence and in the case of dietary protein, diabetes status.
The reported prevalence of diabetes in Colombia varies widely across studies and official documents, reflecting a lack of accurate population-level data, a problem common to many low-income and middle-income countries. The International Diabetes Federation Diabetes Atlas 2019 estimated an adjusted diabetes prevalence of 7.4% for the Colombian population,36 and the WHO in its 2016 Diabetes Country Profiles reported a total prevalence of 8.0%.12 Meanwhile, the above-mentioned PURE study reported a prevalence of 11.1% for the population aged 35–70 from upper-middle-income countries,13 much higher than the national survey done by the Colombian government in 2007,37 which found a 3.5% prevalence of self-reported diabetes in adults aged 18–69.38 Results from regional studies are similarly heterogeneous. The CARMELA study, a population-based study in large Latin American cities, found a diabetes prevalence of 8.1% in Bogotá in 2006,39 similar to the 8.9% found in the Colombian Caribbean city of Cartagena in 2005.40 A comparison of our findings with prior studies reveals that the diabetes epidemic seems to be progressing faster in smaller cities in Latin America. For example, diabetes prevalence in a 2006 study of adults in Bucaramanga was only 4%, while we found 7.4% in the same city.41 We found a comparable diabetes prevalence for most of the cities except for Medellin, where we found a much larger figure. A population study undertaken in Medellin and its suburbs in 2008–201042 found a prevalence of high plasma glucose (fasting plasma glucose >100 mg/dL or taking antidiabetic medication) of 19.8%, quite comparable to our 20.1% by random plasma glucose >200 mg/dL or diabetes self-report, despite the different definition. By comparison with results from both IDF and WHO estimates and from national studies, our results seem to confirm a sizeable increase in the prevalence of diabetes in Colombian cities. Further studies are needed in order to identify potential genetic, demographic or cultural reasons for the high prevalence of hyperglycaemic disorders in this region of the country.
Worldwide, the prevalence and societal burden of diabetes have been increasing steadily in recent years. Diabetes has moved from being the 10th most relevant cause of disability-adjusted life years lost in 1990, to being the 4th in 2005 and the 3rd in 2015.43 The rapid expansion of the diabetes epidemic is being driven mostly by small prevalence increases in largely populated Asian countries (China and India),17 but also by sustained prevalence increases in developed countries in Europe and North America. According to the IDF Diabetes Atlas 2019, diabetes prevalence among adults in the North America and Caribbean region was estimated at 13.3%, while in Europe it was 8.9%.36 The most recent estimate of the US Centers for Disease Control places diabetes prevalence in the USA at 13.0%.44 Thus, our estimations worryingly place the prevalence of diabetes among urban adults from Colombia at a level close to that of developed countries, and to that of Latin American countries traditionally leading diabetes prevalence statistics like Brazil (11.4%) and Mexico (15.1%).36 Overall, our study led to an estimate of diabetes prevalence much more plausible and coherent with international projections than data from existing national health surveys.
The most important independent correlate of diabetes in our study was increasing age, as has been described for most populations worldwide.43 Our study found an estimated prevalence of diabetes among older adults remarkably close to that encountered in recent surveys from the SABE study (17.5% in SABE Bogotá, executed in 201220; 18.5% in SABE Colombia, executed in 201519 and 20.6% in COPEN, executed in 2018). Thus, recent data support the idea of an accelerated increase in the prevalence of diabetes among older adults in Colombia. For the most part, the relationship between socioeconomic status and diabetes is consistent in high-income countries: a lower position increases risk.45–48 Meanwhile, the magnitude and direction of this association in middle-income and low-income countries is conflicting across studies, perhaps due to imperfect data, to the use of different proxies for SEL, or to the rapid development of demographic and nutritional transitions that affect them in ways different from what takes place in the developed world.49–51 In Colombia, the higher prevalence of diagnosed diabetes with higher SEL may be explained at least partially by increased access to medical care and diabetes screening with higher income.52
Prior studies had found an interaction between sex and educational level, so that more educated women had a lower prevalence of diabetes. A large multi-national study reported increasing odds of diabetes as education increased among men from middle-income countries. For women, the association was flat or slightly negative.53 Other studies of the associations between socioeconomic variables and diabetes have also found a different pattern according to sex.54 55 Studies from Mexico,56 Argentina57 and Brazil58 have also documented higher rates of obesity and diabetes among more educated men and less educated women. Many factors could explain these results, but one that may apply to our context is a larger degree of body dissatisfaction among women, that increases with higher education. A study in Bogotá showed that women with higher education were more likely to identify thinner body silhouettes as their preferred ones.59 Our results complement a body of evidence suggesting that education of women may be a tool in the fight against the diabetes epidemic in low-income and middle-income countries.
We were surprised to find a lower self-reported weight-adjusted intake of calories and all macronutrients among persons with diabetes. An optimistic interpretation of this finding would be that it shows good adherence to dietary recommendations. However, such interpretation should be made with caution, as it is known that people with diabetes and obesity frequently under-report their caloric intake.60
The fact that the lower mean intake of all nutrients but sodium in people with diabetes lost significance after multivariate adjustment, suggests that major sociodemographic factors (older age) and a higher BMI are the main factors explaining a lower reported dietary intake in persons with diabetes. In any event, these differences did not result in increased odds of achieving dietary recommended intakes of key nutrients, as only reaching the %TCI from protein was independently associated with diabetes status.
Despite reporting quantitatively less intake of most nutrients, the relative proportion of macronutrients from each source in participants with diabetes was remarkably similar to that of people without diabetes. This finding also applied to fat subtypes: SFA, MUFA and PUFA represented a comparable share of TCI regardless of diabetes status. This points out that individuals with diabetes (many of whom know already know about their diabetes status), are not modifying their diets enough to intentionally increase the per cent of calories from MUFA, as well as reducing their intake of SFA and TFA. A survey of patients with type 2 diabetes from general practices in the Netherlands found a 15% mean TCI from SFA at the moment of diagnosis, which had descended to 11.9% by 4 years after diagnosis.61 This is still far from the recommendation of <7% TCI from SFA. Thus, excessive consumption of SFA by people with diabetes seems to be a ubiquitous problem.
The intake of dietary fibre was equally concerning, in this case because of too little consumption, a problem that was more evident in participants who were younger, male or lived in Medellin. A meta-analysis of randomised controlled trials concluded that diets with foods rich in fibre up to 42.5 g/day reduced glycated haemoglobin by a mean 0.55% and fasting plasma glucose by 9.9 mg/dL in persons with diabetes.62 Hence, a low consumption of dietary fibre constitutes a lost opportunity for improving the health of persons with diabetes. Dietary TFA are a powerful cardiovascular risk factor, even at intakes as low as 2% of TCI. For this reason, their intake is restricted by most dietary guidelines to less than 1 g/day, with special emphasis on populations at high baseline risk for cardiovascular disease, like people with diabetes or older people.63 We found that only one in every five individuals with diabetes was achieving this goal, and the odds of achieving it were significantly lower with younger age or higher SEL, probably in relation with a higher consumption of processed, industrialised foods.63 TFA intake is an independent predictor of total and cardiovascular mortality,64 so extreme efforts should be put in place in order to limit their consumption both in the general population and among persons with diabetes.
Our results bring out many areas of potential intervention for nutritional prevention, which are particularly relevant in our context. Nutritional education of people with diabetes in low-income and middle-income countries is an urgent measure with large potential benefits and minimal risks.
Limitations of our study include the entirely urban sample, given the recent increase in obesity in rural areas in the continent65 and Colombia.66 It is important, however, that the proportion of total population living in urban centres is in Colombia is 77.1%,67 a result of accelerated urbanisation induced by years of internal conflict that has impacted the epidemiological profile of the country.14 Another relevant limitation was the unavailability of oral glucose tolerance test (OGTT) data, so our ascertainment of diabetes status relied on random plasma glucose measurement and diabetes self-report, which may lead to underestimation of the true disease prevalence. OGTT is the most sensitive test for diabetes diagnosis but performing it would have imposed great complexities on the logistics of the study. We acknowledge that the prevalences we report, high as they seem, are most likely an underestimation. Concerning the instrument to measure dietary intake, FFQs have the advantage of inquiring about usual (rather than recent) intake, to be more comprehensive than 24-hour dietary recalls, and not as susceptible to modification by recent diet as food diaries. They do have the limitations of tending to overestimate TCI, and of having to be adjusted for different populations. However, the problems inherent to recall bias exist for all dietary assessment tools, except for food diaries, which are seldom used in epidemiology. FFQs have been shown to successfully assess average dietary intake up to 4 years prior to their application.68 Finally, our study did not collect detailed information on lifestyle variables like smoking or physical activity, which may explain or correlate with the described dietary intakes.
In summary, our results confirm a continued progression of the diabetes epidemic in Colombia, a middle-income country, and its relationship with demographic and socioeconomic factors. We also found remarkably low rates of achievement of key nutritional goals among individuals with diabetes, and identified factors associated with their achievement. Further research focused in rural areas is needed in order to build a complete picture of the evolution of the diabetes epidemic in the low-income and middle-income world.
Data availability statement
Data are available in a public, open access repository. The study dataset and its associated variable definitions file have been publicly deposited in the dryad repository, they can be consulted under the following link: https://doi.org/10.5061/dryad.sqv9s4n2n.
Ethics statements
Ethics approval
All participants provided written informed consent. All study procedures were performed according to the principles of the Declaration of Helsinki, and to local rules and regulations as provided by Resolution 8430 of 1993 of the Colombian Ministry of Health. The study was approved by the IRB of Universidad de los Andes (Comité de Ética de la Vicerrectoría de Investigaciones), according to minute 1016 of 27 April 2018.
References
Supplementary materials
Supplementary Data
This web only file has been produced by the BMJ Publishing Group from an electronic file supplied by the author(s) and has not been edited for content.
Footnotes
Contributors COM participated in study conception, supervised study activities, participated in its execution, data analysis and in manuscript writing. SAGR participated in study execution, data analysis and manuscript writing. MJP-J participated in study execution, data analysis and manuscript writing. LDN-B participated in study execution, data analysis and manuscript writing. AM-R participated in study execution, data analysis and manuscript writing. EB-V participated in study conception, and participated in study execution, data analysis and in manuscript writing.
Funding This study was funded by Team Foods Colombia (068-2018).
Disclaimer The sponsor had no direct influence in the study design, execution or analysis, or on the decision to publish.
Competing interests None declared.
Provenance and peer review Not commissioned; externally peer reviewed.
Supplemental material This content has been supplied by the author(s). It has not been vetted by BMJ Publishing Group Limited (BMJ) and may not have been peer-reviewed. Any opinions or recommendations discussed are solely those of the author(s) and are not endorsed by BMJ. BMJ disclaims all liability and responsibility arising from any reliance placed on the content. Where the content includes any translated material, BMJ does not warrant the accuracy and reliability of the translations (including but not limited to local regulations, clinical guidelines, terminology, drug names and drug dosages), and is not responsible for any error and/or omissions arising from translation and adaptation or otherwise.