Article Text

Abstract
Objectives Several epidemiological models have been published to forecast the spread of the COVID-19 pandemic, yet many of them have proven inaccurate for reasons that remain to be fully determined. We aimed to develop a novel model and implement it in a freely accessible web application.
Design We built an SIR-type compartmental model with two additional compartments: D (deceased patients); L (individuals who will die but who will not infect anybody due to social or medical isolation) and integration of a time-dependent transmission rate and a periodical weekly component linked to the way in which cases and deaths are reported.
Results The model was implemented in a web application (as of 2 June 2020). It was shown to be able to accurately capture the changes in the dynamics of the pandemic for 20 countries whatever the type of pandemic spread or containment measures: for instance, the model explains 97% of the variance of US data (daily cases) and predicts the number of deaths at a 2-week horizon with an error of 1%.
Conclusions In early performance evaluation, our model showed a high level of accuracy between prediction and observed data. Such a tool might be used by the global community to follow the spread of the pandemic.
- epidemiology
- public health
- statistics & research methods
- COVID-19
Data availability statement
Data are available in a public, open access repository. Data are available upon reasonable request. The tool is accessible online and free of charge. Other data are accessible upon reasonable request.
This is an open access article distributed in accordance with the Creative Commons Attribution Non Commercial (CC BY-NC 4.0) license, which permits others to distribute, remix, adapt, build upon this work non-commercially, and license their derivative works on different terms, provided the original work is properly cited, appropriate credit is given, any changes made indicated, and the use is non-commercial. See: http://creativecommons.org/licenses/by-nc/4.0/.
Statistics from Altmetric.com
Strengths and limitations of this study
We developed an extension of an SIR model as an open-access tool for short-term prediction of COVID-19 evolution.
In the model, we intentionally ignored the compartment S usually found in such models.
On the other hand, we took into account the fact that some patients died and therefore introduced a compartment D corresponding to them.
The model uses early data and works for a large set of countries.
Longer follow-up is needed to confirm early results that showed a high level of accuracy.
Introduction
The COVID-19 pandemic has been a disruptive event for most healthcare systems across the globe. It has led governments to take both public measures for population containment and often a resetting of healthcare organisation in order to be able to absorb the peak of patients in particular for critical care. Since the inception of the outbreak, all stakeholders seemed keen to access to reliable and ‘living’ information regarding the evolution of cases, hospitalisations and deaths in their countries as well as in others. Cross-area comparisons were made to understand some characteristics of this novel epidemic.1 2 Also, being able to predict at least in the short term, the evolution of the main outcome indicators has been a relentless objective of care for providers and decision-makers. A single tool providing such an aid would be likely to, respectively, inform people and enlighten relevant stakeholders to anticipate the needed measures, in particular regarding the steering of care and social measures. We therefore developed such an online tool, intended to be an adaptive model, that is, able to adapt to new early data so as to refine its prediction and be freely accessible to the community.
The aim of this study was to report the development of the model, as well as some preliminary data demonstrating its workability and its accuracy in studying different countries.
Methods
We built an SIR-type compartmental model for the COVID-19 data provided by the Johns Hopkins University (https://github.com/CSSEGISandData/COVID-19/tree/master/csse_covid_19_data/csse_covid_19_time_series).3
The model is a parametric model whose parameters change from country to country to reflect differences in dynamics. A classic SIR model considers three types of individuals: susceptible individuals (S), infected individuals (I) and recovered individuals (R).4 Many extensions to this model have been proposed, in particular by adding a compartment of exposed but non-contagious individuals (E) to the model renamed as SEIR.5
Other models distinguish between symptomatic and asymptomatic patients, between patients admitted to intensive care units and patients admitted to regular wards.6–8 The more complex these models are, the more parameters they depend on. A classic method then consists of fixing the value of some of these parameters to values found in the literature and modifying the other parameters in order to obtain simulations with dynamics that are similar to those of the data. Our approach was different: our main objective was to develop an epidemiological model that fits the observed data as closely as possible, while at the same time being as simple as possible. However, we did not aim to develop an empirical model that looks like the data (eg, using a polynomial model): the model and its parameters must have a real epidemiological interpretation, in terms of transition from one state to another or length of stay in a state. On the one hand, we made the hypothesis that the number of contagious individuals in the population was negligible as compared with the population size, which is realistic as the latest studies suggested an infection rate of around 5% in most countries.9 This hypothesis allowed us to ignore the compartment S of the model. On the other hand, we had to take into account the fact that not all patients recovered but that a certain proportion died. We therefore introduced a compartment D corresponding to the deceased patients.
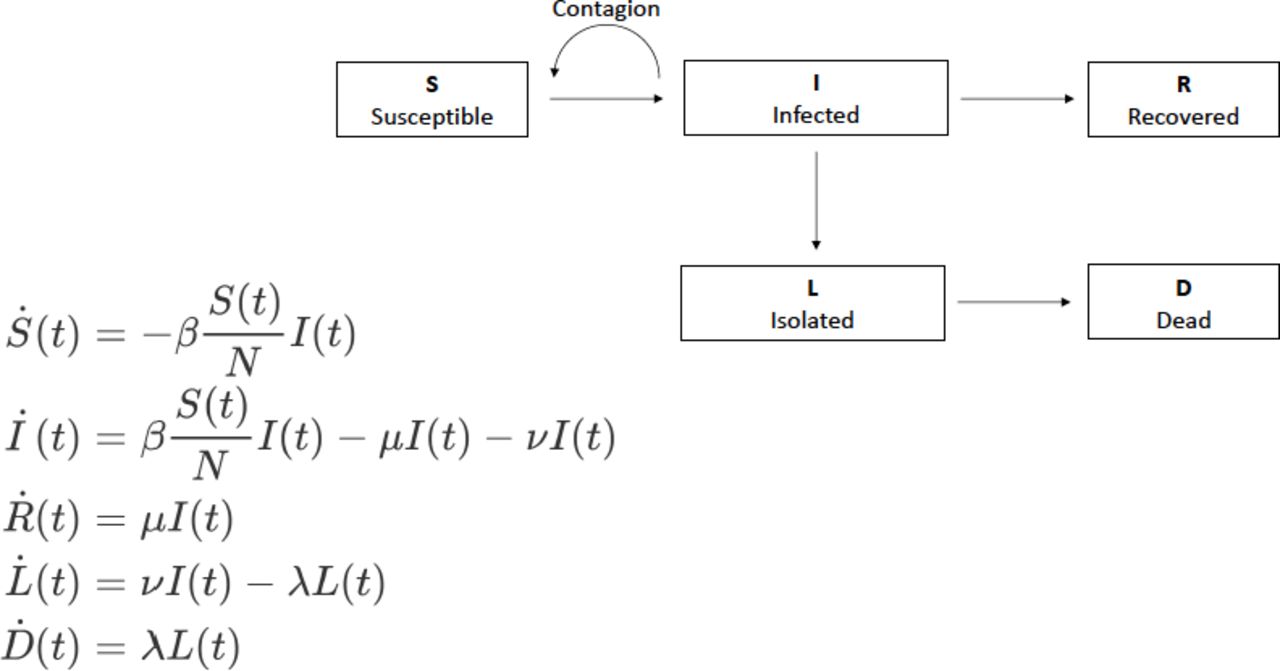
As an examination of the data at first glance showed that there was a delay between new infections and deaths, we therefore added an additional compartment L in the model, which represents the group of individuals who will die (because they were infected), but who will not infect anybody, for instance due to social or in-hospital isolation (figure 1). There is no direct flux between I and D, but a flux between I and L and then between L and D.

Diagram of the SIR model used and that includes susceptible individuals (S), infected individuals (I), recovered individuals (R), non-infectious individuals who will die (L) and deceased patients (D). Here, μ, ν, λ are rate constants while β is a time-varying transmission rate function.
A fundamental parameter of the model is the transmission rate β (see figure 1), which indicates how quickly people become infected and become contagious themselves. Our model integrates a time-dependent transmission rate, whose variations can be thought to be related to the public measures taken by the country of interest. One can thus hypothesise that the transmission rate was stable—and possibly high—before the lockdown, and then decreased with lockdown in countries that have adopted such a measure. A piecewise linear model was used for the transmission rate to take into account these possible variations:

As the number of change points K, the initial values β0 and a, the locations (τ1, τ2, …, τK) and the magnitude (h1,h2, …, hΚ) of the changes in the slope are unknown, they were estimated together with the model parameters.
The data available for each country are the daily numbers of confirmed cases (w_j), bearing in mind that this is a number that represents an unknown fraction of the actual total number of cases, and the daily numbers of deaths (d_j). A periodical weekly component appears in each of these series, for many countries. This component is of course not related to the dynamics of the epidemic, which has no scientific reason to change across the days of the week, but rather to the way in which the numbers of cases and deaths are counted and reported, which can change from day to day especially for the former. This component is taken into account in the observation model in the form of a cosine function:


Where W(t)=β(t) I(t) is the predicted number of infected individuals and where (ew,j) and (ed,j) are two sequences of independent and identically centred Gaussian variables.
Once the model is fully defined, its parameters can be estimated for each country through the maximum likelihood estimation method and using precisely that country’s data.
It should be noted that the uncertainty related to the estimation of the parameters has not been evaluated. This could be done, for instance, by means of parametric bootstrap. The model, the parameter estimation algorithm, the method for model selection as well as several plotting routines have been implemented in the R package covidix. This package is available on Github (https://github.com/MarcLavielle/covidix). An example of how to use covidix can be found here: (http://webpopix.org/covidixExample.html).
Of interest is the fact that an interactive, easy-to-use web application (Shiny V.1.4.0.2, 2020) also allows to visualise the data and the fitted model for several countries (http://shiny.webpopix.org/covidix/app1/). The data used in this application are updated frequently in order to be able to follow on a day-to-day basis what the model predicts for countries.
Patient and public involvement
Neither patients nor the public were involved, as the current research only includes publicly available aggregated data.
Results
A first version of the covidix package and the web application were available as of 12 April 2020 with model adjustments on data from eight countries. Nine new countries were added between 12 April 2020 and 15 May 2020 (see table 1).
Model parameters for each country
Figure 2 shows that the model is able to accurately capture the different changes in the dynamics of the pandemic (1) for countries, such as Switzerland, which controlled the spread of the epidemic well; (2) for countries, such as Italy, which did not react soon enough and saw the number of deaths increase very rapidly before taking containment measures which slowly decreased this figure; (3) for countries, such as the USA, that have not taken sufficiently severe measures to significantly reduce incidences; (4) for countries, such as Brazil, where the pandemic has arrived later. Furthermore, the fits clearly highlight the weekly periodical component whenever it exists.

Observed and predicted number of cases for several countries (left: daily number of confirmed cases, right: daily number of reported deaths). The magenta dots are the observed data. The green curves represent the daily numbers of cases and deaths predicted by the model, including the periodical component related to how data are counted and reported throughout the week.
Figure 3 shows that the prediction from the model becomes more accurate as more data are made available. When little information is already available on the dynamics of the epidemic and the effect of containment (around 16 April 2020 here), the model nevertheless allows us to assess quite accurately how the number of deaths will increase in the following weeks and when important numbers will be reached (eg, 4000 for Sweden and 100 000 for the USA). These forecasts were very accurate for both countries in the relatively short term (2 weeks in our example). For Sweden, a total of 4000 deaths was observed on 24 May. Depending on the time of analysis, the model predicted 31 May 2020 (7 days of error), 18 May 2020 (6 days) or 21 May 2020 (3 days) if the calculation was performed with the data available on 16 April 2020, 01 May 2020 or 26 May 2020, respectively. For the USA, a total of 100 000 deaths occurred on 27 May 2020. With the same date of analysis, the model predicted 20 May 2020 (7 days of error), 24 May 2020 (3 days) and 25 May 2020 (2 days).

Observed and predicted number of deaths for Sweden and the USA. The predictions were obtained at different dates (left: 16 April 2020; middle: 1 May 2020; right: 16 May 2020). The magenta dots are the observed data of the training dataset used for building the model. The red dots are the observed data of the validation dataset. The green curves represent the cumulated numbers of deaths predicted by the model.
The model also allowed us to estimate the day of the peak of daily deaths in each country (table 2). Moreover, the delay in days for a twofold or fourfold increase or decrease in the number of deaths was assessed by the model. For instance, in Italy, the number of deaths predicted by the model reached its peak on 27 March 2020. A quarter of this number had been reached 15 days before that date, during the exponential growth phase, where it doubled in 5 days. Growth then slowed and the number of deaths doubled in 10 days to reach the peak. The decline was much slower, as it took 25 and 47 days to divide the number of deaths by 2 or 4, respectively.
Maximum daily number of deaths predicted by the model
Discussion
The almost unprecedented magnitude of the COVID-19 pandemic has made epidemiological models critical not only for researchers but also for policymakers.10 Many models have been published either in scientific journals or as open-access platforms for helping the global community to describe and forecast the evolution of the pandemic outcome, yet with frequently conflicting findings.11 The SIR model had been already used in different countries to describe the spread of the COVID-19.12–14
We herein reported the development of an original model for short-term prediction of COVID-19 outcome at an aggregated level like a country, as well as updated data suggesting its very accuracy. Our model has several strengths as compared with others. First, it is adaptive and fits the observed data, through a mechanistic modelling, even though we acknowledge that many other models are also adaptive, notably those analysed under the control theory framework. Second, it appears to be validated by the data, with good short-term predictions in all tested cases, as shown in the figures and as it can be seen on the online tool. For instance, the model early showed that Sweden, a country in which limited public measures have raised a national and international controversy, would rapidly reach a cumulated number of deaths of 4000.15 Third, it is a parsimonious model, as very few parameters are needed to describe the outcome of interest, and the prediction proved stable over time. Fourth, we implemented it as an open-access interactive tool, so as to make it operational for any relevant stakeholder for the immediate benefit of the scientific and general community in the context of the COVID-19 outbreak. Fifth, it is designed to be updated on a regular basis, ideally on a daily basis, with the possible incorporation of new countries over time. Last, it can also be seen as a monitoring tool. Also, the current work focuses on what happened between early March and early June 2020. Indeed, this period corresponds to what has been widely called the ‘first wave’ of the COVID-19 pandemic in most European countries. We have chosen to cover this period because various parameters related to the dynamic of the pandemic (lethality rate, number of tests performed, infection rate, etc) seem to have changed significantly afterwards.
Our model nevertheless has some limitations. The main one is probably that it needs early data to be fed with so as to work. It therefore requires a minimum follow-up on the outbreak to be effective. Our report is also limited by the fact that we did not proceed to a full comparison with other models and cannot herein demonstrate respective performances of published models as compared with ours. We intended to report the development of the model and its rationale, as well as early positive findings as soon as possible, in particular since the model is made freely accessible as an online tool.
We encourage researchers and policymakers to use this freely accessible model since its main purpose is to describe precisely the spread of this pandemic. As the pandemic pursues its course in many countries, we will continue to enrich it with real data and will further investigate its performance.
Data availability statement
Data are available in a public, open access repository. Data are available upon reasonable request. The tool is accessible online and free of charge. Other data are accessible upon reasonable request.
Footnotes
Contributors ML designed and developed the model and the tool. J-DZ, MF and JHL provided medical insights and wrote the manuscript. All authors read and approved the final manuscript. J-DZ affirms that the manuscript is an honest, accurate and transparent account of the study being reported; that no important aspects of the study have been omitted; and that any discrepancies from the study as planned (and, if relevant, registered) have been explained.
Funding The authors have not declared a specific grant for this research from any funding agency in the public, commercial or not-for-profit sectors.
Competing interests All authors have completed and submitted the ICMJE Form for Disclosure of Potential Conflicts of Interest. No conflict of interest related to the current work was reported. Outside the submitted work, J-DZ reports being an advisor for several consulting firms linked with pharmaceutical industry (Oliver Wyman, Roland Berger). He also reports speaking fees from a manufacturers’ professional association, consulting fees from Ferring, Pierre Fabre, AbbVie, AstraZeneca, Biogen, Boehringer Ingelheim, Takeda and Johnson & Johnson. He is a personal investor in approximately 20 digital companies, medical device companies or biotech companies, and as a limited partner in an investment fund. He reports being a founding partner of Inato, a company involved in clinical research and whose customers are pharmaceutical companies. JHL reports fees from Ethicon, Takeda and MD Start, and invitation to a medical congress by Biomup. He is a consultant for Safeheal.
Provenance and peer review Not commissioned; externally peer reviewed.