Article Text

Abstract
Objective To improve our understanding of how television (TV) time is linked to cardiometabolic health among adults by systematically and critically evaluating the evidence that watching TV is associated with increased food consumption, lack of movement or negative affect or affects subsequent sleep.
Design Systematic review.
Data sources Web of Science and PubMed.
Eligibility criteria Studies that provided quantitative evidence on short-term associations of watching TV with dietary intake, characteristics of sitting, affect and sleep among samples of healthy adults (≥18 years old).
Data extraction and synthesis Study quality was assessed using the National Heart, Lung, and Blood Institute Quality Assessment Tools; studies deemed to be of low quality were excluded from the review. Due to heterogeneity of study designs and measurements, the findings were synthesised using narrative summary accompanied by custom plots.
Results We identified 31 studies that met the inclusion criteria. Most of the associations reported by the studies included in this review were weak or inconsistent. There was no strong evidence to suggest that food consumption is higher while watching TV than in other contexts or that TV is a particularly ‘sedentary’ behaviour. Affect was less likely to be positive while watching TV than in other contexts but was not more likely to be negative. Two small studies suggest that TV may impact sleep via suppressing melatonin and delaying bedtime.
Conclusion There is currently no strong evidence to suggest that TV might impact cardiometabolic health via increasing food consumption, being linked with prolonged/inactive sitting, affect or subsequent sleep. Additional research is required to understand how TV fits within everyday lives and relates to eating, sitting, affect and sleep to improve our understanding of how it might impact cardiometabolic health.
- public health
- epidemiology
- sports medicine
Data availability statement
All data relevant to the study are included in the article or uploaded as supplementary information. All data generated or analysed during this study are included in this published article and its supplementary information files.
This is an open access article distributed in accordance with the Creative Commons Attribution Non Commercial (CC BY-NC 4.0) license, which permits others to distribute, remix, adapt, build upon this work non-commercially, and license their derivative works on different terms, provided the original work is properly cited, appropriate credit is given, any changes made indicated, and the use is non-commercial. See: http://creativecommons.org/licenses/by-nc/4.0/.
Statistics from Altmetric.com
Strengths and limitations of this study
This review synthesises for the first time a diverse body of evidence that tests for associations between watching TV and food consumption, characteristics of sitting, mood/affect and sleep, to shed light on mechanisms by which TV time might impact cardiometabolic health.
A systematic approach was taken in gathering and appraising the evidence.
Custom plots were produced to visualise the findings of individual studies, including the magnitude, direction and statistical significance of associations.
The outcomes and designs of included studies were too heterogeneous for estimating overall summary estimates using meta-analysis.
Introduction
Television (TV) time has been associated with poor cardiometabolic health outcomes among adults, including cardiovascular mortality,1 2 incidence of type 2 diabetes1 2 and increases in adiposity.3 TV time is generally assumed to be sedentary and sedentary time is now a well-established risk factor for poor cardiometabolic health.1 4 However, the association between TV time and poor health outcomes is stronger than the association between total sitting time and poor health outcomes1 5 or than between time spent sitting in other contexts, such as sitting at work, and health outcomes.6–9 For studies based entirely on self-reported measures, lower measurement error in the assessment of TV time than in the assessment of other sedentary behaviours is likely to contribute to such a difference.10–12 However, the relationship between self-reported TV time and cardiometabolic outcomes is also stronger than the relationship between objectively assessed sedentary time and those same outcomes,13–15 a finding that is unlikely to be attributable to measurement error. It is possible that TV time has a particularly adverse impact on cardiometabolic health and this suggestion is repeatedly made in the literature.1 5 7 16
Several possible explanations for the larger observed effects of TV time have been put forth. Most commonly, it has been suggested that dietary intake while watching TV (particularly snacking) may contribute to its effect.1 5 7 16 It has also been suggested that the way in which sitting occurs while watching TV may be important, for example, if it is characterised by particularly low energy expenditure (EE) or low levels of muscular activation.1 5 16 Detrimental impacts of TV on sleep and mental health (potentially partly via short-term affective responses) have also been noted as potential mechanisms by which TV might adversely impact cardiometabolic health.16–18 However, the evidence lending support to these suggested possible explanations has not, to our knowledge, been exhaustively or critically evaluated.
The purpose of this critical systematic review is to improve our understanding of how TV time is linked to cardiometabolic health among adults. To this end, we have critically evaluated the available literature that provides evidence regarding short-term associations between watching TV and food consumption, characteristics of sitting, affect, and sleep.
Methods
Eligibility criteria
Studies were eligible for inclusion in the review if they provided quantitative evidence of dietary intake, characteristics of sitting, or affect while watching TV or subsequently on the same day as watching TV, or on sleep subsequently on the same day. Studies could be experimental or observational as long as they described behaviours while watching TV or on the same day subsequent to watching TV. Participants in the studies had to be non-institutionalised adults (≥18 years old) who were not exclusively characterised by a particular health status (eg, only overweight or obese adults). All studies had to be published in English in 2000 or later as TV viewing practices change over time.
Information sources and search strategy
The literature was searched in March 2021 using Web of Science Core Collections and PubMed. The search strategy included terms to identify studies that measured TV time across all disciplines (online supplemental file 1). The reference lists of all included papers were also checked. We had initially set out to address a broader research question, aiming to capture all studies that examined TV time in relation to any factors that might impact cardiometabolic health; the search strategy was therefore intentionally broad and we did not specify outcome variables of interest a priori. Given the diversity of studies identified, we subsequently chose to narrow the scope of our research question to focus only on studies that measured the variable of interest while watching TV (or immediately after) among adults.
Supplemental material
Study selection
The titles and abstracts of the retrieved studies were screened for relevance. A subsample (10%) was independently screened by both authors to ensure agreement and consistency; any discrepancies were discussed until an agreed application of inclusion and exclusion criteria was reached, then one author (JW) screened the remainder of titles and abstracts. The full-texts of studies with relevant abstracts were consulted to determine eligibility. Both authors confirmed the eligibility of each full-text, and any cases of disagreement were resolved through discussion.
Quality assessment
The quality of each eligible full-text was assessed based on the National Heart, Lung, and Blood Institute Quality Assessment Tools for observational cohort and cross-sectional studies (for observational studies) and for controlled intervention studies (for experimental and intervention studies) (https://www.nhlbi.nih.gov/health-topics/study-quality-assessment-tools). In order to draw on the highest standards of evidence, studies deemed to have low internal validity based on the quality appraisal were excluded from the review. The quality assessment of each study was confirmed by both authors and any disagreements were discussed until consensus was reached.
Data extraction
The data from each eligible study were extracted into a spreadsheet with predefined columns for the general study details (location, date), study design, methodology, sample characteristics, statistical analyses (including covariates) and main findings regarding the behaviour(s) of interest .
Synthesis of results
The results of the associations between TV time and the outcome of interest were organised by categories of outcome variables that emerged from the search (diet, characteristics of sitting, affect, sleep). Because of heterogeneity of study outcomes and study designs, meta-analysis was not used. Therefore, the results were synthesised using narrative summary accompanied by visualisation of study findings. We constructed custom plots designed to illustrate each study’s findings to provide a visual summary of the strength of the evidence for each outcome. We plotted the reported effect size if the paper reported this; if studies did not report effect size but reported sufficient information to calculate it (eg, mean and SD), we calculated the standardised mean difference (SMD) using the R package metafor (online supplemental file 2). If 95% CIs or SEs were reported, these were converted to SD using the formula suggested in the Cochrane handbook (https://handbook-5-1.cochrane.org/chapter_7). When calculating the effect size within experimental studies that used within-subjects designs, we imputed correlations of 0.5 to account for repeated measurements; sensitivity analyses using correlations of 0.6 and 0.8 were also conducted to examine the extent to which the imputed correlation might affect the results (shown in online supplemental file 2). While we acknowledge that the interpretation of the magnitude of effect sizes is arbitrary and context-specific, for the purposes of plotting we classified effect sizes as negligible (SMD<0.20, OR<1.50 or correlation (r)<0.10), small (SMD=0.20–0.49, OR=1.50–2.49, r=0.10–0.29), medium (SMD=0.50–0.79, OR=2.50–4.29, r=0.30–0.49) or large (SMD≥0.80, OR≥4.30, r≥0.50) based on standard conventions.19
Supplemental material
Within the plots, the included papers are ordered from most robust to least robust evidence, primarily on the basis of study design (eg, within-subjects prioritised over between-subjects) and sample size. Whether the finding of the study was statistically significant is denoted through a filled (black) symbol with the direction of the association denoted by a positive sign (+), negative sign (−), zero (0) or question mark (?) if the direction could not be ascertained; non-significant associations are unfilled. The strength of the effect size is denoted by number of boxes (one=negligible, two=small, three=medium, four=large) based on the reported or calculated effect size. Where the effect size was not reported and could not be calculated in a standardised way (eg, regression coefficient, graphical presentation of means), we plotted the findings with a triangle, filled (or not) to denote statistical significance. Significance was determined based on (1) the calculated or reported CIs not crossing 0 or (2) the study reported a p value <0.05 where effect size with CIs was not reported and could not be calculated.
Patient and public involvement
No patients involved.
Results
Search results
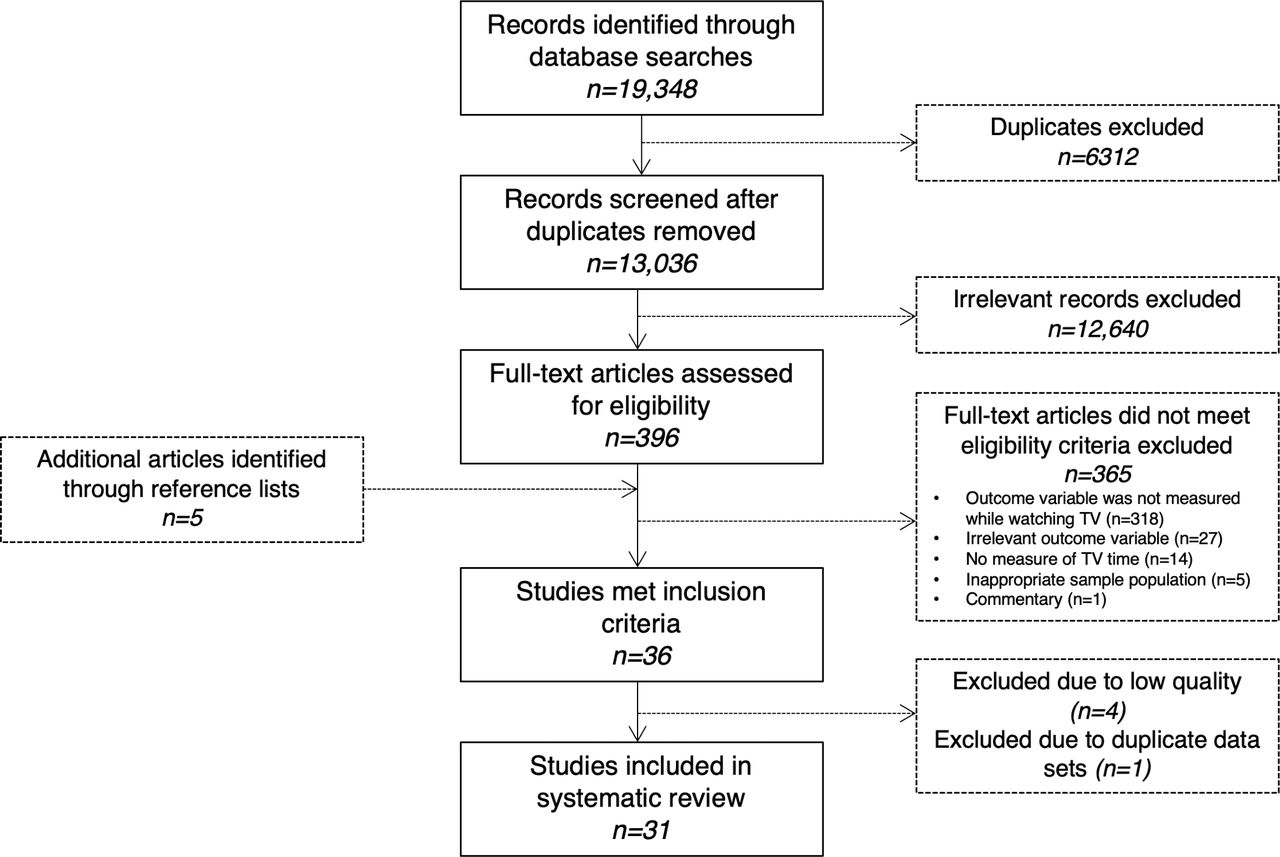
The flow of studies through the review process is shown in figure 1. From the original 13 036 unique records retrieved by the database searches, 31 were eligible for inclusion. An additional 5 papers were retrieved through reference lists and 5 papers were excluded (4 due to poor study quality), leaving 31 studies included in the review (see online supplemental file 3 for study details, including information on statistical modelling with covariates listed).
Supplemental material

Flow of studies through the review process.
Characteristics of included studies
Twenty-five studies were experimental, primarily focused on links between TV and food consumption (n=19); the remainder focused on EE of sitting or movement while watching TV (n=4) or the effects of TV on subsequent sleep (n=2). Most experimental studies used a within-subjects study design (n=17) and were conducted in Europe (n=11) or North America (n=9), Australia (n=3) and Japan (n=2). Sample sizes ranged from 13 to 120; 10 studies included only female participants while one study included only men.
Six studies were observational, including studies examining food consumption (n=4) and affect (n=2) while watching TV in free-living contexts. Five of these studies were based in the USA and one in New Zealand with sample sizes ranging from 40 to 538.
Food and drink consumption while watching TV
Experimental studies
TV versus doing nothing
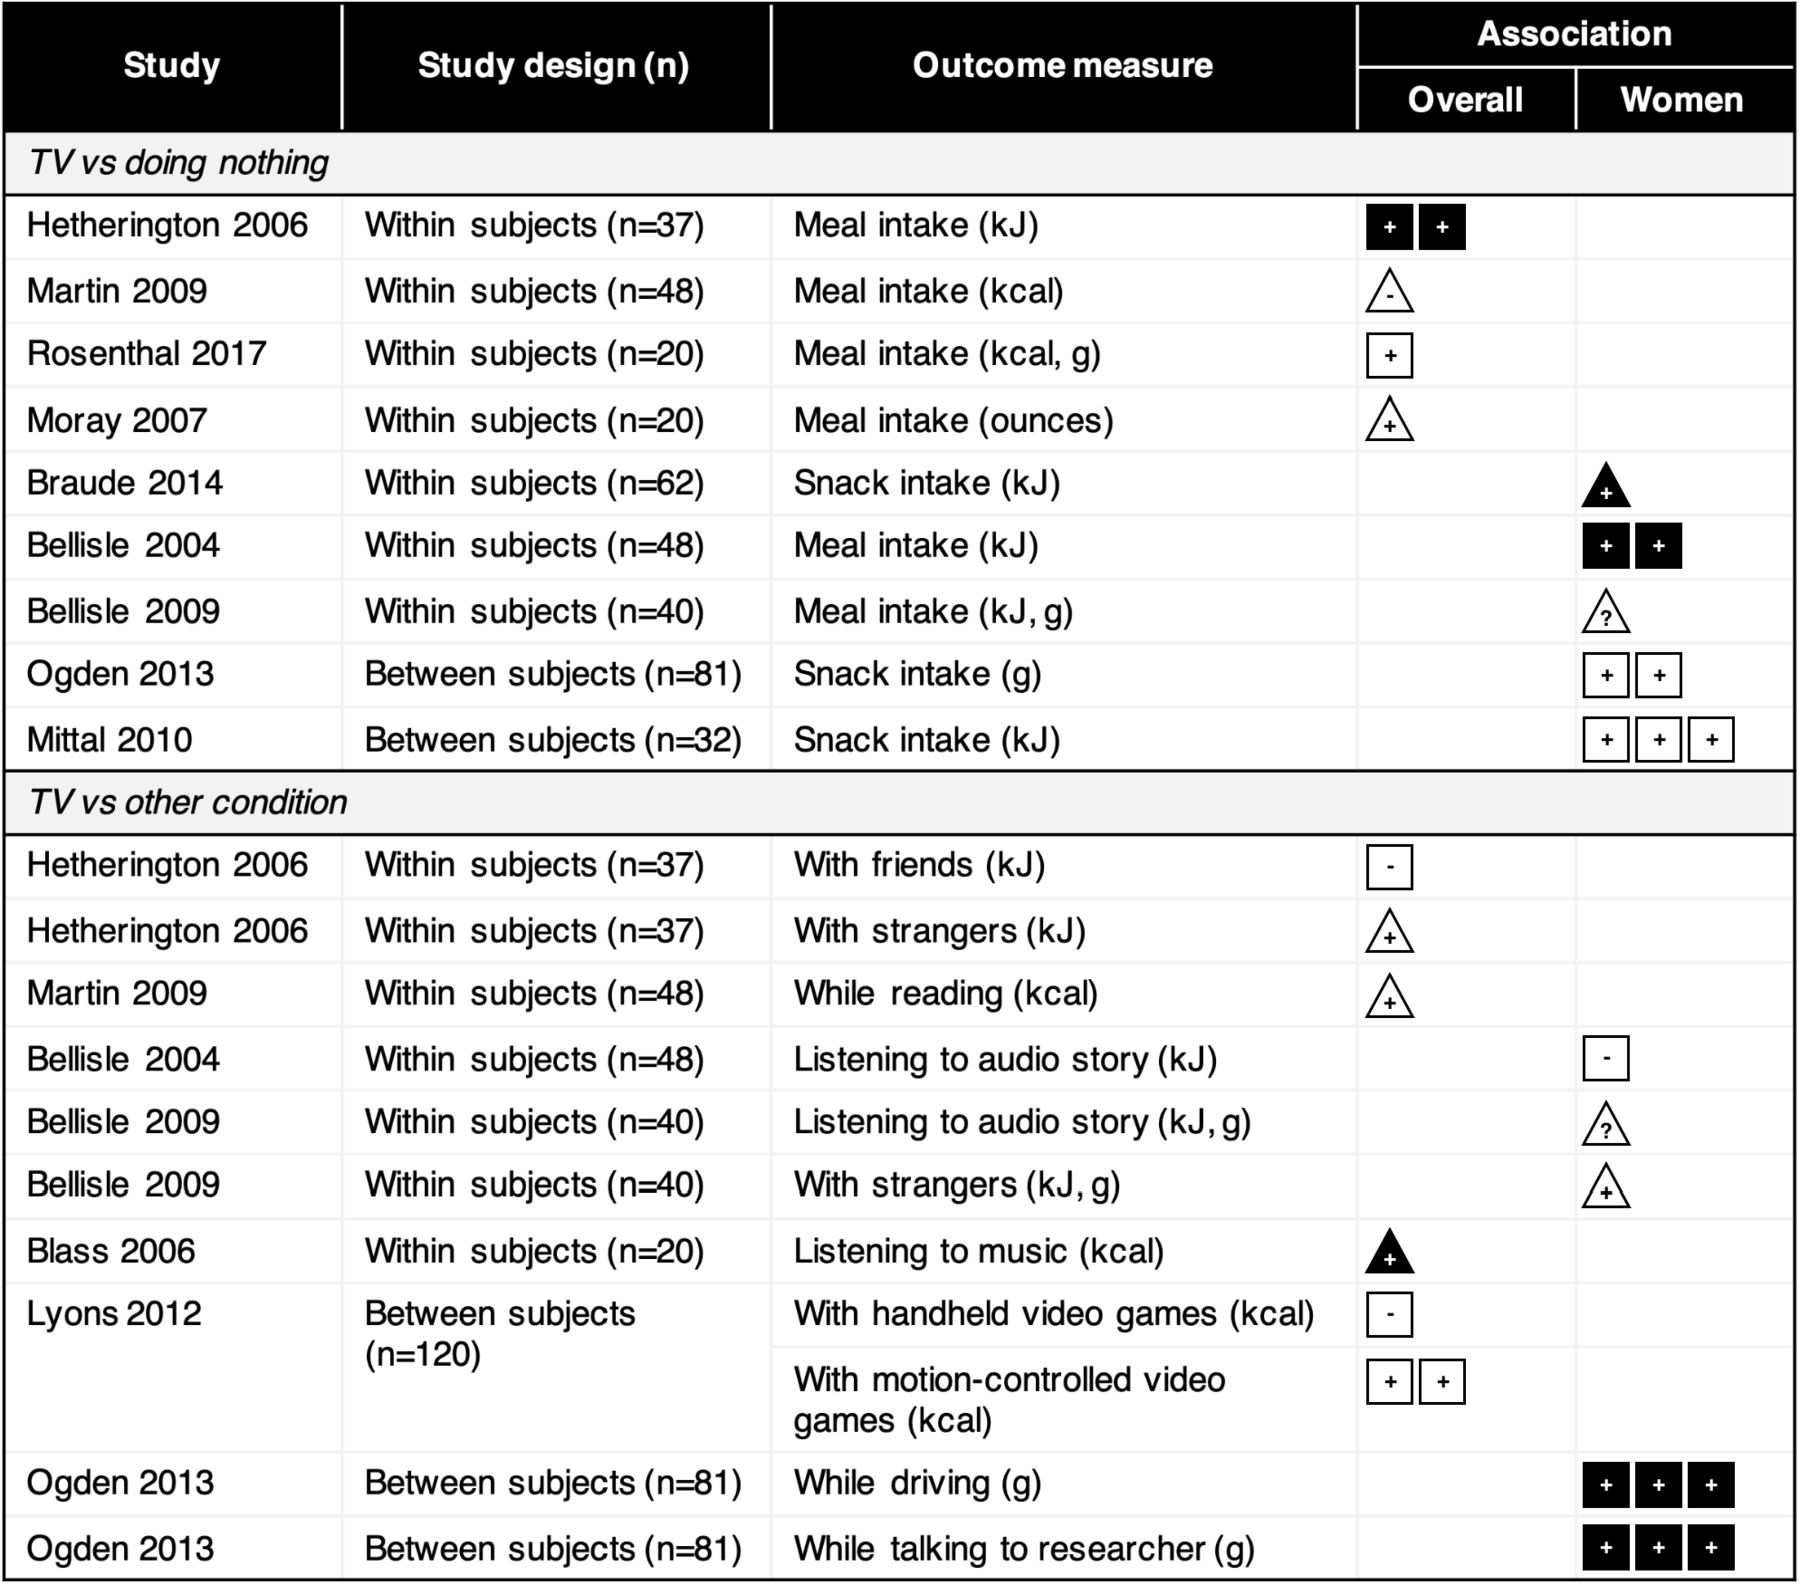
There is some evidence to suggest that more food is consumed while watching TV compared with while doing nothing else in a laboratory setting (figure 2 and online supplemental file 3). Nine experimental studies compared food consumption while watching TV compared with a control condition spent alone with no distraction.20–28 Seven studies found that participants had higher consumption in terms of energy intake20–22 24 26 or mass26–28 during the TV condition compared with the control condition (generally small effect sizes), although this did not reach significance in most cases. In sensitivity analyses, effect sizes increased from small to medium in two studies20 22 when a larger correlation coefficient was imputed (online supplemental file 2).

Summary plot of effect sizes for experimental effects of TV on food consumption compared with doing nothing else or doing something else. Strength of effect size is denoted by number of boxes (one=negligible to four=large); triangles denote cases where effect size could not be calculated. Filled (black) symbols denote significant associations; non-significant associations are unfilled.
TV versus other activity
There is little evidence to suggest that more food is consumed while watching TV compared with while doing other activities in a laboratory setting (figure 2 and online supplemental file 3). Seven studies compared food consumption while watching TV with consumption while doing other tasks, including listening to audio stories,20 23 listening to classical music,29 reading,25 simulated driving,27 playing video games,30 eating with a researcher or strangers22 27 and eating with friends.22 Five of these studies reported no differences in the amount of food consumed between the TV condition and the other experimental condition they tested.20 22 23 25 30 The remaining two studies reported higher consumption while watching TV compared with while listening to classical music,29 driving27 or while conversing with a researcher.27 Sensitivity analyses suggested larger imputed correlations did not materially change the findings (online supplemental file 2).
Effect of TV on later consumption on the same day
Three studies, all in laboratory settings, tested whether the consumption of a snack while watching TV (compared with while not watching TV) would result in higher food consumption at a meal or snack later on in the same day (consumed without TV)24 31 32 (online supplemental file 3). Two of these studies found that when the earlier snack had been consumed while watching TV, significantly more was eaten in the subsequent TV-free meal/snack24 31; the third did not find subsequent consumption was higher after the eating-with-TV exposure.32
Role of TV content
There is little evidence to suggest that the content of TV being watched influences food consumption in experimental settings (online supplemental file 3). Four studies examined food consumption when exposed to food advertisements compared with either neutral (non-food) advertisements33–35 or no advertisements,25 35 all reporting no main effect of commercial condition (although Anschutz et al33 reported a significant interaction with gender such that women ate more when exposed to food commercials compared with neutral commercials but the opposite was true for men). Three studies evaluated the impact of TV content on food consumption24 36 37; two of these reported that participants ate more when watching boring or repeated showings of TV compared with engaging or novel TV,36 37 while the third reported no difference in consumption when participants watched funny, boring or sad TV shows.24 One study38 compared snack consumption following exposure to either a clip of a cooking show or a nature show, reporting no difference in overall consumption between the groups (although more chocolate balls were consumed following exposure to the cooking show than the nature show).
Observational studies
Four observational studies examined dietary patterns while watching TV in free-living settings among voluntary/convenience samples of adults in New Zealand,39 African-American women in Chicago40 and young adults in the USA41 42 (figure 3 and online supplemental file 3).

Summary plot of eating patterns while watching TV in free-living contexts. Strength of effect size is denoted by number of boxes (one=negligible to four=large); triangles denote cases where effect size could not be calculated. Filled (black) symbols denote significant associations; non-significant associations are unfilled.
The most detailed evidence comes from the study by Gemming et al39 in New Zealand, which linked 24-hour dietary recalls to wearable camera recordings on three separate measurement days, allowing for an in-depth assessment of the contextual details (eg, location, environment, social context, presence of screens) surrounding each eating episode noted in the recall. In their sample, 17% of eating episodes (22% of meals and 12% of snacks) took place while watching TV. Snacks consumed while watching TV were higher in energy (by 514 kJ (123 kcal)) than snacks consumed when no TV was viewed. There was no difference in meal energy intake or duration of meals or snacks while watching TV compared with when no screen was viewed.
The remaining three studies examined the contexts of self-reported eating and drinking using ecological momentary assessment40 and food diary entries annotated with contextual information.41 42 These studies found that 30%40 and 26%41 of snacking and eating occasions, respectively, took place while watching TV. Among young adults in the USA, Stroebele and de Castro42 reported that an average of 1.03 meals per day took place with the TV on, but meal size did not differ with or without the TV on. Compared with food and drink consumed while ‘not doing anything else’, a larger proportion of snacks40 and sugar-sweetened beverages41 and smaller proportions of water, fruit, vegetables and cereals/grains41 were consumed while watching TV compared with while doing nothing else.
Characteristics of sitting while watching TV
Four experimental studies examined associations between watching TV and characteristics of sitting, specifically EE43–45 and level of movement.46 Three experimental studies compared the EE of watching TV with the EE of other sedentary behaviours.43–45 The most robust evidence indicated that the EE of sitting while watching TV was lower than the EEs of typing, playing a handheld video game (both small effect sizes), and playing a screen-based video game while sitting (large effect size; figure 4).45 The other two studies found no difference between the EE of watching TV and the EE of typing at a desk,44 reading at a desk44 or working on a laptop computer43 in their samples (figure 4 and online supplemental file 3), although their relatively small sample sizes and lack of a priori power calculations may mean their non-significant findings were due to underpowered samples.

Summary plot of effect sizes for characteristics of sitting while watching TV. Strength of effect size is denoted by number of boxes (one=negligible to four=large); triangles denote cases where effect size could not be calculated. Filled (black) symbols denote significant associations; non-significant associations are unfilled.
A laboratory-based study compared the level of movement captured using hip-worn, triaxial accelerometry while watching TV (seated on a chair without armrests) compared with other sedentary behaviours among adults.46 Total movement (which we calculated as vector magnitude of acceleration) was higher while watching TV compared with while reading, writing, typing and sitting both ‘naturally’ (ie, with free movement) and motionless, but did not significantly differ from movement while playing cards or preparing food while seated (figure 4).
In sensitivity analyses using larger imputed correlation coefficients, the effect sizes slightly increased for the difference in the EE of TV compared with typing and for the difference in vector magnitude of acceleration for TV versus reading, preparing food and sitting naturally (online supplemental file 2).
Affect during TV viewing
In two studies, participants self-reported their affect while watching TV within their everyday lives (figure 5 and Online supplemental file 3). Using a day reconstruction approach for the previous day in which leisure activities and affect were reported, Kuykendall et al47 found that respondents generally experienced poorer affect while watching TV compared with while engaged in other leisure activities, in terms of lower positive activated and deactivated affect (energetic/alert/vigorous and peaceful/at ease/serene, respectively) and higher negative deactivated affect (bored/tired/dull). However, negative activated affect (anxious/jittery/nervous) was generally lower while watching TV compared with other leisure activities. In a separate sample using similar methods, levels of relaxation were higher while watching TV than during physical activity (but similar to other leisure activities), levels of happiness and satisfaction were lower when watching TV compared with other activities (except for physical activity, which was similar to TV), and feelings of sadness did not differ between TV and other leisure activities.

Summary plot of effect sizes for affect while watching TV. Strength of effect size is denoted by number of boxes (one=negligible to four=large); triangles denote cases where effect size could not be calculated. Filled (black) symbols denote significant associations; non-significant associations are unfilled.
In a study using experience sampling methods over the course of a week, Goodwin et al48 found that mean positive affect scores were lower while watching TV compared with while engaging in other leisure activities (eg, hobbies) or while doing productive activities (eg, work or volunteering); negative affect score did not differ while watching TV compared with while doing any other activities. In sensitivity analysis, only the effect size of the difference in positive affect during TV versus productive activities increased (from small to medium) with larger imputed correlations (online supplemental file 2).
Impact of TV viewing on sleep
One small experimental study (n=13)49 and one small intervention study (n=16),50 both in Japan, were included here (online supplemental file 3). Komada et al49 tested the effect of TV displays on melatonin and cortisol secretion at night in a laboratory setting. Melatonin and cortisol are hormones involved in the body’s sleep-wake cycles, and the production of melatonin in the body promotes sleep and is known to be suppressed by bright light.51 Komada et al49 found that a TV display with higher blue light intensity was associated with a suppressive effect on melatonin levels but not on cortisol levels. Asaoka et al50 conducted an intervention in which university students and elderly adults limited their TV time to 30 min a day for 1 week, following a week-long ‘control’ in which participants went about normal activities. During the week of restricted TV time, the university students went to bed significantly earlier and slept significantly longer compared with the control week; the intervention had no effect on sleep duration among the elderly.
Discussion
This critical systematic review aimed to improve our understanding of how TV might impact cardiometabolic health by evaluating and synthesising available fair-quality and high-quality evidence on the effects of watching TV on food consumption, characteristics of sitting, affect and subsequent sleep. Most of the associations found were weak or inconsistent. There was no strong evidence from laboratory or free-living settings to suggest that food consumption while watching TV is higher than food consumption in other contexts. There was also no clear evidence to suggest that sitting while watching TV (in laboratory contexts) might be a particularly ‘sedentary’ behaviour. The association between TV and affect was complex. Positive affect and certain aspects of negative affect (eg, anxiousness or nervousness) tended to be lower while watching TV compared with other leisure activities, while other aspects of negative affect (eg, sadness) did not differ; feelings of tiredness or boredom were higher while watching TV compared with other leisure activities. There was a very small amount of evidence to suggest TV may impact sleep by suppressing melatonin and by impacting bedtime, at least in younger people.
The evidence on the impact of watching TV on food consumption is weak. In laboratory contexts in which fixed (and often large) amounts of food were placed in front of participants, participants tended to consume more while watching TV compared with while doing nothing else but more often than not this difference was not statistically significant, and there was very little evidence that consumption was higher while watching TV than during other potentially distracting activities such as listening to music. There is a very small amount of evidence that consumption of food while watching TV (compared with doing nothing) may be associated with greater subsequent intake than consumption while not watching TV. Evidence from free-living contexts, in which TV viewing conditions and food availability are quite different, suggested that energy intake while watching TV versus not did not significantly differ for meals but differed by a small amount for each snacking episode.39 42 Observational studies found 17%–26% of eating events and 12%–30% of snacking events occurred while watching TV39–41; however, no evidence was available to describe what proportion of TV-watching was accompanied by eating to determine whether TV ‘triggers’ food consumption. It is worth highlighting that the studies cited most often as evidence to suggest links between TV and snacking or higher food intake are not based on measurements of food consumption while watching TV; rather, this evidence shows that those with higher TV time have higher total energy consumption, higher snack intake or less-healthy diets than those with lower TV time with the causality of this association entirely unclear.52–56 Further research in free-living contexts is needed to improve our understanding of the possible co-occurrence of TV watching and food consumption to test the hypothesis that watching TV leads to greater energy intake or greater intake of foods associated with cardiometabolic risk. The use of devices such as wearable cameras (eg Gemming et al39) may prove particularly useful for this to assess the contexts of eating episodes (with and without TV), the contexts of TV viewing episodes (with and without eating) and the co-occurrence of the two. TV viewing may also affect diet in other ways not examined here.
There was little evidence to suggest that TV might be a particularly ‘sedentary’ behaviour. Compared with other seated activities, one of three experimental studies found that EE was lower while watching TV and another experimental study showed incidental movement was higher while watching TV. The ecological validity of these findings is unclear as the settings for TV watching in these studies (eg, on chairs without armrests, for short and fixed amounts of time) do not reflect TV-watching conditions in free-living contexts. We did not find any studies that examined whether watching TV may induce prolonged uninterrupted bouts of sitting, which have been shown to interfere with glucose and lipid metabolism.57 58 We also did not find any studies that examined the characteristics of sitting while watching TV in free-living contexts. There is evidence that those with higher self-reported TV time have higher free-living accelerometer-measured prolonged sedentary time59 and fewer breaks in sedentary time,59 60 but these studies do not provide evidence that this prolonged sedentary time or lack of breaks is directly linked with time spent watching TV. Further research in free-living contexts should make use of mixed methodologies, for example, by combining accelerometry with wearable cameras, using electromyographic shorts and diaries, or applying direct observation methods (see Aunger and Wagnild61; Troiano et al62 for review) to improve our understanding of characteristics of sitting specifically during TV viewing.
There is little evidence to support the hypothesis that TV may impact cardiometabolic health via impacting affect. The two studies that examined affect while watching TV (both in free-living contexts) found that positive affect and feelings of happiness tended to be lower while watching TV than during other leisure activities, while the relationship between negative affect and TV depended on what aspect of negative affect was measured; overall negative affect and feelings of sadness were not higher or lower while watching TV, boredom and tiredness was higher, and anxiousness and nervousness were lower while watching TV compared with during other leisure activities.47 48 These findings suggest that TV may be a form of leisure that is ‘numbing’ in that it may ease negative feelings but not necessarily increase positive feelings. The role of TV in everyday lives as a method of stress management and relaxation and as a way to escape negative or depressed feelings has been previously described.63–66 In light of this, it is possible that measured mood or affect while watching TV may represent ‘emotional spillover’ from activities preceding TV time.47 From a measurement perspective, it would be useful to assess how affect might change over the course of TV viewing instances to better understand how TV might alter emotional states throughout the course of viewing.
Mental health status may be an important confounder of the association between TV and cardiometabolic health. Depression, for example, has been prospectively associated with both high TV time67 and poor cardiometabolic health outcomes.68 There is mixed evidence suggesting prospective associations between TV time and depression or depressive symptoms.69–72 Further research is needed to disentangle the relationships between TV, mood/affect and mental health, and cardiometabolic health outcomes.
There is a very small body of evidence to suggest that TV time may impact sleep, which may in turn impact cardiometabolic health. One small study included in this review found that blue light from a TV display suppressed melatonin,49 which may lead to a disruption in circadian rhythms, and another small study found that a reduction in TV time led to an earlier bedtime in young people.50 Thus, TV time may be linked to sleep disruption and later bedtimes, but much more evidence is needed to demonstrate this effect. The hypothesis that watching TV reduces sleep quantity or quality should be tested in people during their everyday lives, and might involve using wearable cameras to assess TV time and accelerometry to assess sleep quality and quantity.
This review did not identify strong evidence for any mechanism through which TV time has been posited to adversely impact cardiometabolic health. It is possible, however, that these factors may interact or have a multiplicative effect. For example, the combination of low EE of sitting while watching TV (based on laboratory evidence) with the slightly higher energy intake from snacks while watching TV could potentially produce a larger effect than either of these aspects on their own.
Importantly, even if such associations are observed in everyday lives, causality requires careful consideration as they may be the result of confounding, whereby, for example, chronic stress may prompt consumption of calorically dense foods73 and may also prompt TV-watching as a way to relax, perhaps concurrently. More generally, while the association between socioeconomic position (SEP) and TV time is likely to vary globally across cultural and economic contexts, low SEP is consistently linked to high TV time in ‘western’ countries such as the UK,74 the USA,75 Australia76 and Canada.77 Within these contexts, low SEP itself is associated with some of the outcomes considered here, as well as with poor cardiometabolic health outcomes78–81 and may thus confound the relationship between TV viewing, diet, sitting characteristics, affect and sleep, and health outcomes. More empirical evidence, particularly using ethnographic or mixed-methods approaches, is needed to understand the place of TV in everyday lives and its potential role in the development of cardiometabolic disease, with particular attention to the question of whether watching TV is causally implicated in changing health-related practices. Experimental studies are also useful in helping disentangle causality.
The findings of this review must be interpreted in light of the limitations in the evidence base. The vast majority of included studies reported statistically significant results but often with very small effect sizes, suggesting possible publication bias. The associations seen in this review should therefore be interpreted with caution as statistically significant findings may be over-represented in the literature base. The majority of included studies examining food consumption and characteristics of sitting were laboratory-based, thus the ecological validity of such findings is unclear. Methods that capture these kinds of data in free-living contexts, such as use of wearable cameras or electromyographic shorts, may be useful for providing insights into the ways in which TV occurs in real-life settings. These methods will also be relevant for examining the contexts and possible health-related consequences of screen-related practices more broadly beyond just TV time. Key strengths of this review include its systematic approach and that it is the first to comprehensively examine and evaluate evidence of the assertions commonly made in the literature explaining why TV is particularly detrimental to cardiometabolic health.
Conclusions
There is currently no strong evidence to suggest that TV impacts cardiometabolic health via effects on food consumption, prolonged/inactive sitting, affect or sleep. Further research exploring the putative mechanism(s) by which TV viewing might impact cardiometabolic health is required. We suggest that studies make use of innovative and/or mixed methods, such as wearable cameras, participant observation or diaries, to improve our understanding of how TV fits within everyday lives and how it may impact cardiometabolic health outcomes, or whether relationships between TV time and cardiometabolic health reflect confounding.
Data availability statement
All data relevant to the study are included in the article or uploaded as supplementary information. All data generated or analysed during this study are included in this published article and its supplementary information files.
Acknowledgments
The authors wish to thank the Anthropology of Health Research Group at Durham University for helpful feedback, and Professor Adetayo Kasim for providing statistical advice.
References
Supplementary materials
Supplementary Data
This web only file has been produced by the BMJ Publishing Group from an electronic file supplied by the author(s) and has not been edited for content.
Footnotes
Twitter @jwagnild
Contributors JMW led the study. Both authors (JMW and TMP) contributed to the design, database searches, data collection and analysis. JMW constructed the plots. Both authors (JMW and TMP) contributed to and approved the final manuscript.
Funding JW was supported by Durham University.
Competing interests None declared.
Provenance and peer review Not commissioned; externally peer reviewed.
Supplemental material This content has been supplied by the author(s). It has not been vetted by BMJ Publishing Group Limited (BMJ) and may not have been peer-reviewed. Any opinions or recommendations discussed are solely those of the author(s) and are not endorsed by BMJ. BMJ disclaims all liability and responsibility arising from any reliance placed on the content. Where the content includes any translated material, BMJ does not warrant the accuracy and reliability of the translations (including but not limited to local regulations, clinical guidelines, terminology, drug names and drug dosages), and is not responsible for any error and/or omissions arising from translation and adaptation or otherwise.