Article Text

Abstract
Objectives There are increasing requirements to make research data, especially clinical trial data, more broadly available for secondary analyses. However, data availability remains a challenge due to complex privacy requirements. This challenge can potentially be addressed using synthetic data.
Setting Replication of a published stage III colon cancer trial secondary analysis using synthetic data generated by a machine learning method.
Participants There were 1543 patients in the control arm that were included in our analysis.
Primary and secondary outcome measures Analyses from a study published on the real dataset were replicated on synthetic data to investigate the relationship between bowel obstruction and event-free survival. Information theoretic metrics were used to compare the univariate distributions between real and synthetic data. Percentage CI overlap was used to assess the similarity in the size of the bivariate relationships, and similarly for the multivariate Cox models derived from the two datasets.
Results Analysis results were similar between the real and synthetic datasets. The univariate distributions were within 1% of difference on an information theoretic metric. All of the bivariate relationships had CI overlap on the tau statistic above 50%. The main conclusion from the published study, that lack of bowel obstruction has a strong impact on survival, was replicated directionally and the HR CI overlap between the real and synthetic data was 61% for overall survival (real data: HR 1.56, 95% CI 1.11 to 2.2; synthetic data: HR 2.03, 95% CI 1.44 to 2.87) and 86% for disease-free survival (real data: HR 1.51, 95% CI 1.18 to 1.95; synthetic data: HR 1.63, 95% CI 1.26 to 2.1).
Conclusions The high concordance between the analytical results and conclusions from synthetic and real data suggests that synthetic data can be used as a reasonable proxy for real clinical trial datasets.
Trial registration number NCT00079274.
- epidemiology
- health informatics
- information management
- information technology
- statistics & research methods
Data availability statement
Data may be obtained from a third party and are not publicly available. The dataset can be obtained by registering at Project Data Sphere (https://www.projectdatasphere.org/).
This is an open access article distributed in accordance with the Creative Commons Attribution Non Commercial (CC BY-NC 4.0) license, which permits others to distribute, remix, adapt, build upon this work non-commercially, and license their derivative works on different terms, provided the original work is properly cited, appropriate credit is given, any changes made indicated, and the use is non-commercial. See: http://creativecommons.org/licenses/by-nc/4.0/.
Statistics from Altmetric.com
- epidemiology
- health informatics
- information management
- information technology
- statistics & research methods
Strengths and limitations of this study
The study evaluated whether a synthetic clinical trial dataset gives similar analysis results and the same conclusions as does analysis of the real dataset.
A machine learning method was used to generate the synthetic data.
A published analysis evaluating the effect of bowel obstruction on survival of patients with colon cancer was replicated.
The results and conclusions from real and synthetic data were compared in univariate, bivariate and multivariate analyses.
The identity disclosure (privacy) risks of the synthetic data were not explicitly evaluated, although existing evidence in the literature suggests that it is low.
Background
It is often difficult for researchers to get access to high-quality individual-level data for secondary purposes (eg, testing new hypotheses and building statistical and machine learning models). Specifically, for clinical trial data, secondary analysis of data from previous studies can provide new insights compared with the original publications1 and has produced informative research results including those on drug safety, evaluating bias, replication of studies and meta-analysis.2 Therefore, there has been strong interest in making more clinical trial data available for secondary analysis by journals, funders, the pharmaceutical industry and regulators.3–8
For example, the International Committee of Medical Journal Editors (ICMJE)’s data sharing policy9 indicates that articles reporting the results of clinical trials must include a data sharing statement when they are submitted to ICMJE journals for publication. Funders also have data sharing requirements. According to the Wellcome Trust’s policy,10 researchers receiving funding are expected to share their data rapidly; an outputs management plan is a requirement for any funding proposal which anticipates the generation of significant outputs (eg, data, software or other materials). These plans are factored into funding decisions. The NIH Statement on Sharing Research Data11 indicates that applicants seeking $500 000 or more in funding per year are required to include a data sharing plan (or explain why it is not possible to share their research data). Data shared by researchers should be individual-level data on which the accepted publication was based.
However, data access for secondary analysis remains a challenge.12 To highlight this challenge, an examination of the success rates of getting individual-level data for research projects from authors found that the percentage of the time these efforts were successful varied significantly and was generally low at 58%,13 46%,14 25%,15 14%16 and 0%.17
One reason for this challenging data sharing environment is increasingly strict data protection regulations. A recent National Academy of Medicine/Government Accountability Office report highlights privacy as presenting a data access barrier for the application of artificial intelligence and machine learning in healthcare.18 While patient (re-)consent is one legal basis for making data available for secondary purposes, it is often impractical to get retroactive consent under many circumstances and there is significant evidence of consent bias.19
Anonymisation is one approach to making data available for secondary analysis. However, recently there have been repeated claims of successful reidentification attacks on anonymised data,20–26 eroding public and regulators’ trust in this approach.26–36 However, it should be noted that there are no known successful reidentification attacks on anonymised clinical trial data at the time of writing.
To provide additional options and methods for sharing the information from clinical trials, in this paper we propose using synthetic data.37 To create synthetic data, a machine learning generative model is constructed from the real individual-level data, capturing its patterns and statistical properties. Then new data are generated from that model. This step is performed by the data controller/custodian who has access to that real data. The synthetic version of the data would then be provided to analysts to conduct their studies.
There are many use cases where synthetic data can provide a practical solution to the data access problem38 and have been highlighted as a key privacy-enhancing technology to enable data access for the coming decade.39 Furthermore, there are recent examples of research studies using synthetic data not requiring ethics review because they are considered to contain no patient information.40 To the extent that this becomes a common practice, it would accelerate data access.
An important question with the analysis of synthetic data is whether similar results and the same conclusions would be obtained as with the real data. To answer this question, we compared the analysis results and conclusions using real and synthetic data for a published oncology trial. Given that by far the most common purposes for the reanalysis of clinical trial data are new analyses of the treatment effect and the disease state rather than replicating the primary analysis,41 we focused on replicating a published secondary analysis rather than a primary analysis. This approach will inform us about the extent to which synthetic data can be useful for the secondary analysis of clinical trials.
There have been limited replications of clinical studies using synthetic data, with only a handful of examples in the context of observational research42 43 and larger clinical trial data.44 The current study adds to this body of work and contributes to the evidence base for enabling more access to clinical trial data through synthesis.
Methods
Data sources
We obtained the dataset for an oncology trial, N0147, from Project Data Sphere (PDS) (see https://data.projectdatasphere.org/).45 The specific trial was selected because the PDS data were analysed in a published study that we could successfully replicate (validating that we have the correct data and interpreted it the same way as the authors), and the description of the analyses performed was clear enough to allow replication. In the current paper, we will refer to this PDS dataset as the ‘real’ data since that is our source dataset for synthesis.
PDS data are already perturbed to anonymise it. The level of perturbation is dependent on the sponsor. Therefore, the use of the term ‘real’ should be interpreted to mean ‘real and anonymised’ data.
Summary of trial data
Trial N0147 was a randomised trial of 2686 patients with stage III colon adenocarcinoma that were randomly assigned to adjuvant regimens with or without cetuximab. After resection of colon cancer, cetuximab was added to the modified sixth version of the FOLFOX regimen, including oxaliplatin plus 5-fluorouracil and leucovorin (mFOLFOX6), fluorouracil, leucovorin and irinotecan (FOLFIRI), or a hybrid regimen consisting of mFOLFOX6 followed up by FOLFIRI.46 Our focus is on the secondary retrospective analysis of N0147 (the published secondary analysis).47
The primary endpoint in the original trial was disease-free survival (DFS), defined as time from random allocation to the first of either tumour recurrence or death from any cause. Secondary trial endpoints were time to recurrence (TTR) and overall survival (OS). TTR was measured from random allocation to tumour recurrence, whereas OS was from random allocation to death from any cause. OS was censored at 8 years, whereas DFS and TTR were censored at 5 years. Patients who died without recurrence were censored for TTR at the time of death. Patients who were lost to follow-up were censored at the date of their most recent disease assessment or contact.
Participants in the control ‘chemotherapy-only’ arm (FOLFOX, FOLFIRI or hybrid regimen without cetuximab) were analysed in the published secondary analysis, which consisted of 1543 patients. Presentation with acute obstruction of the bowel is a known risk factor for poor prognosis in patients with colon cancer.48 49 The main objective of this secondary analysis was to assess the role of obstruction presentation as an independent risk factor for predicting outcomes in patients with stage III colon cancer. The primary endpoint in the published secondary analysis was DFS, and the secondary endpoint was OS, and both DFS and OS were censored at 5 years.
The covariates in the published secondary analysis comprised three types of variables: (1) baseline demographics, including age, sex and baseline BMI; (2) baseline Eastern Cooperative Oncology Group (ECOG) performance score that describes patients’ level of functioning in terms of their ability to care for themselves, daily activity and physical ability; and (3) baseline cancer characteristics, including clinical T stage, lymph node involvement, histological status and Kirsten rat sarcoma virus biomarker status.
Data synthesis method
The data synthesis process takes a real dataset as input, trains a generative model from it then generates synthetic data using the model. Multiple statistical or machine learning methods can be used to create a generative model.
We used sequential decision trees for data synthesis to fit a generative model. Sequential decision trees are used quite extensively in the health and social sciences for the generation of synthetic data.50–58 In these models, a variable is synthesised by using variables preceding it in the sequence as predictors. The method we used to generate synthetic data is called conditional trees,59 although other parametric or tree algorithms could also be used. Methods such as deep learning have been proposed for the synthesis of health data.60 61 However, compared with deep learning synthesis methods, sequential decision trees have the advantage of not requiring a large input dataset that is used for training. It is therefore suitable for creating synthetic variants of clinical trial data that typically have a relatively small number of participants. More details about how sequential synthesis was applied are included in the online supplemental materials.
Supplemental material
Replication of secondary analysis on the synthetic data
We first replicated the published analysis on the real dataset. Once the results could be replicated, we reran the exact same analysis R code on the synthetic version of the data.
The published secondary analysis47 included descriptive statistics consisting of frequency (percentage) for categorical variables. The Pearson χ2 test was used to investigate the statistical significance of the relationship between the baseline characteristics (clinical and pathological) and obstruction. Survival analysis was performed using the Kaplan-Meier curve. The log rank test and the Cox proportional hazards model were used to plot OS and DFS at 5 years and to create a model adjusted for baseline clinical and pathological characteristics to assess the role of obstruction in predicting OS and DFS.
Evaluation of results
Our objective was to evaluate the utility of the synthetic data. Thus, we compared the results using the real data with those using the synthetic data. Our utility evaluation method followed the recommendations to evaluate the utility of data that have been transformed to protect privacy, such as through data synthesis.62 Specifically, we used two general approaches to compare real and synthetic analysis results: information theoretic methods based on the Kullback-Leibler divergence and interval overlap for the CIs of model parameters. Both are described further.
To evaluate the utility of synthetic data, we compared the published univariate and the bivariate statistics on the real data and the synthetic data. The methods for the univariate comparisons are in the appendix. We then compared the multivariate model parameters for the models that were developed to explain survival and to test the hypothesis that obstruction was an important predictor.
Bivariate analysis
In the published secondary analysis, the bivariate results were presented as contingency tables showing the cross-tabulations of the predictors with obstruction, OS after 5 years and DFS after 5 years. The Pearson χ2 test was used to evaluate all bivariate relationships. This type of testing when used in the current context has a number of disadvantages: (1) it does not give us an interpretable effect size and therefore we would not know if a bivariate relationship was strong or not (a test statistic can be significant with a very small effect size if there are many observations); (2) the tests did not account for multiple testing, such as a Bonferroni adjustment, which means that there will be an elevated probability of finding significant results by chance; and (3) the χ2 tests considers independence, whereas the relationship that is being tested is whether each of the covariates is predictive of the outcome. For these reasons, we used a different statistic to compute the bivariate relationships on the real and synthetic datasets.
We use the Goodman and Kruskal tau statistic, which gives us a measure between 0 and 1 of the extent to which the covariate is predictive of the outcome.63 The tau coefficient was computed for the real dataset and the synthetic dataset, and the CIs were compared. CI overlap has been proposed for evaluating the utility of privacy protective data transformations,62 which is defined as the percentage average of the real and synthetic CIs that overlap. Our formulation gives an overlap value of 0 if the two intervals do not overlap at all. We express overlap as a percentage.
The published secondary analysis evaluated the bivariate relationship between each of the predictors and obstruction, and then evaluated each of the predictors and obstruction with event-free survival. We repeated these analyses with the tau statistic and CIs.
Multivariate analysis
For the multivariate models, we compared the Cox model HR estimates between the real and synthetic data. We also computed the CI overlap of the HRs from the Cox models.
Patient and public involvement
The comparative analysis of synthetic to real data did not have any patient or public involvement.
Results for trial N0147
We compared the results in the secondary analysis study that were published against the same analyses performed on the synthetic data. The results for the univariate analysis show little difference in distributions and are in the online supplemental materials.
Bivariate analysis
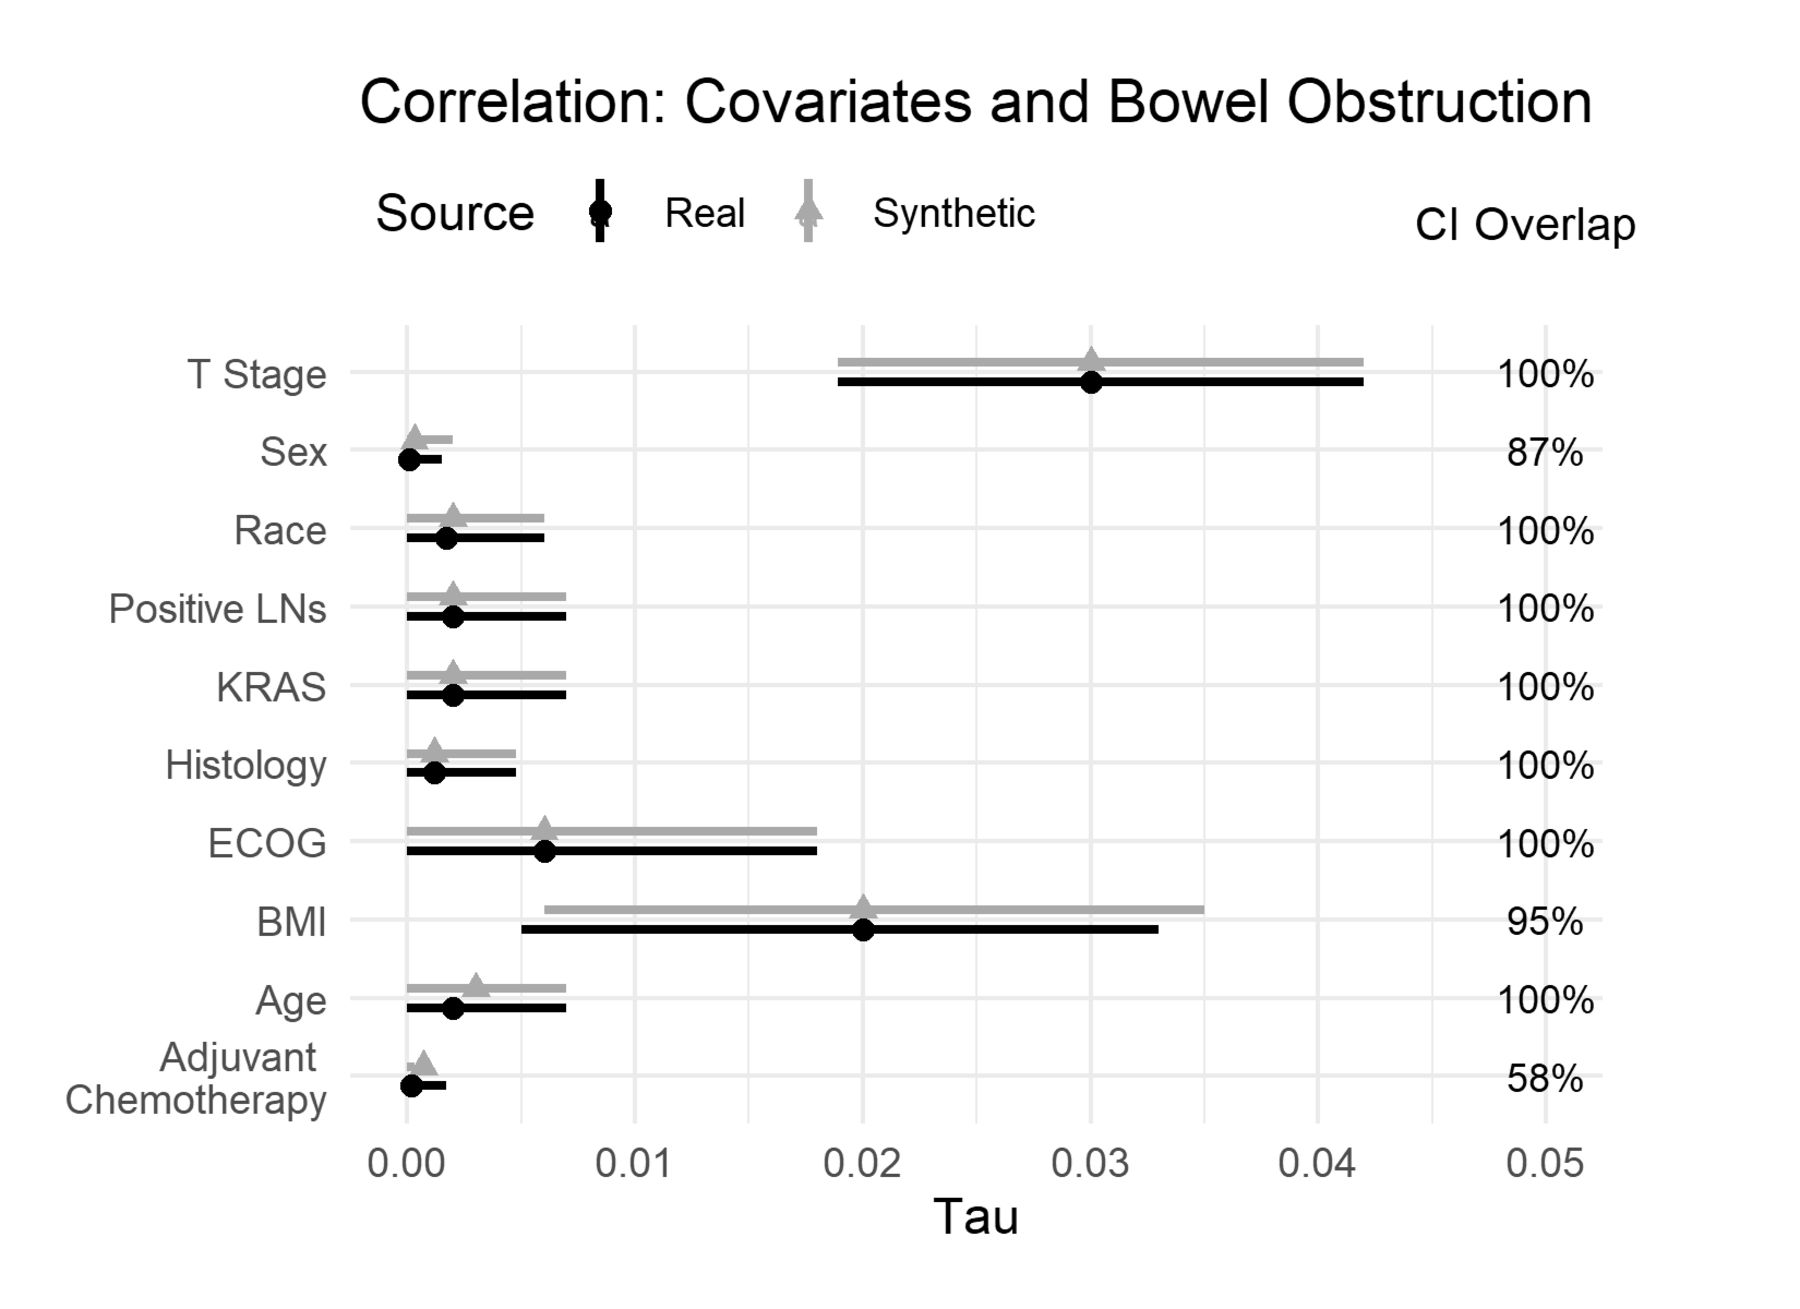
The differences between real and synthetic data for the bivariate relationships of the covariates and obstruction are shown in figure 1. When we look at the effect sizes (the tau metric), we see that the size of these bivariate relationships is very small. These covariates individually are not good predictors of obstruction. We also note that the effect sizes are similar between the real and synthetic datasets, and there are considerable CI overlaps. One would draw the same conclusions from the real and synthetic datasets.

Tau coefficient for the real and synthetic data, and the CI overlap for the bivariate relationship with obstruction. BMI, Body Mass Index; ECOG, Eastern Cooperative Oncology Group; KRAS, Kirsten rat sarcoma virus; LNs, Lymph Nodes.
The next set of results are also the bivariate relationships between the covariates and the event-free survival outcomes: OS and DFS. The results in figure 2 show the effect sizes for the bivariate relationships with OS. There are two noteworthy observations. The first observation is that all the bivariate relationships are very weak—the covariates are not individually predictive of OS. The second observation is that the effect sizes are very similar between the real and synthetic datasets. One would draw the same conclusions from the synthetic data as from the data in the published secondary analysis.

Tau coefficient and CI overlap for the real and synthetic variables against overall survival. BMI, Body Mass Index; ECOG, Eastern Cooperative Oncology Group; KRAS, Kirsten rat sarcoma virus; LNs, Lymph Nodes.
Figure 3 shows the bivariate relationships with DFS. The conclusions are like OS with one exception: the CIs for the relationship between race and DFS do not overlap. Given the weak relationship between race and DFS, this lack of CI overlap is likely due to the stochastic nature of synthesis. In addition, the relationship is quite weak in both datasets and of very similar magnitude; therefore, the conclusions would still be the same in both cases.

Tau coefficient and CI overlap for the real and synthetic variables against disease-free survival. BMI, Body Mass Index; ECOG, Eastern Cooperative Oncology Group; KRAS, Kirsten rat sarcoma virus; LNs, Lymph Nodes.
Multivariate analysis
For the multivariate analyses, the real data results were like those that were in the published secondary analysis. We first compared the survival curves for obstructed and non-obstructed patients on OS (figure 4) and DFS (figure 5). We can see that the curves are very similar between the real and synthetic datasets.

Survival curve comparing overall survival in OBS+ and OBS− patients in the real (A) versus synthetic (B) datasets. OBS+, obstructed; OBS−, non-obstructed.

Survival curve comparing disease-free survival in OBS+ and OBS− patients in the real (A) versus synthetic (B) datasets. OBS+, obstructed; OBS−, non-obstructed.
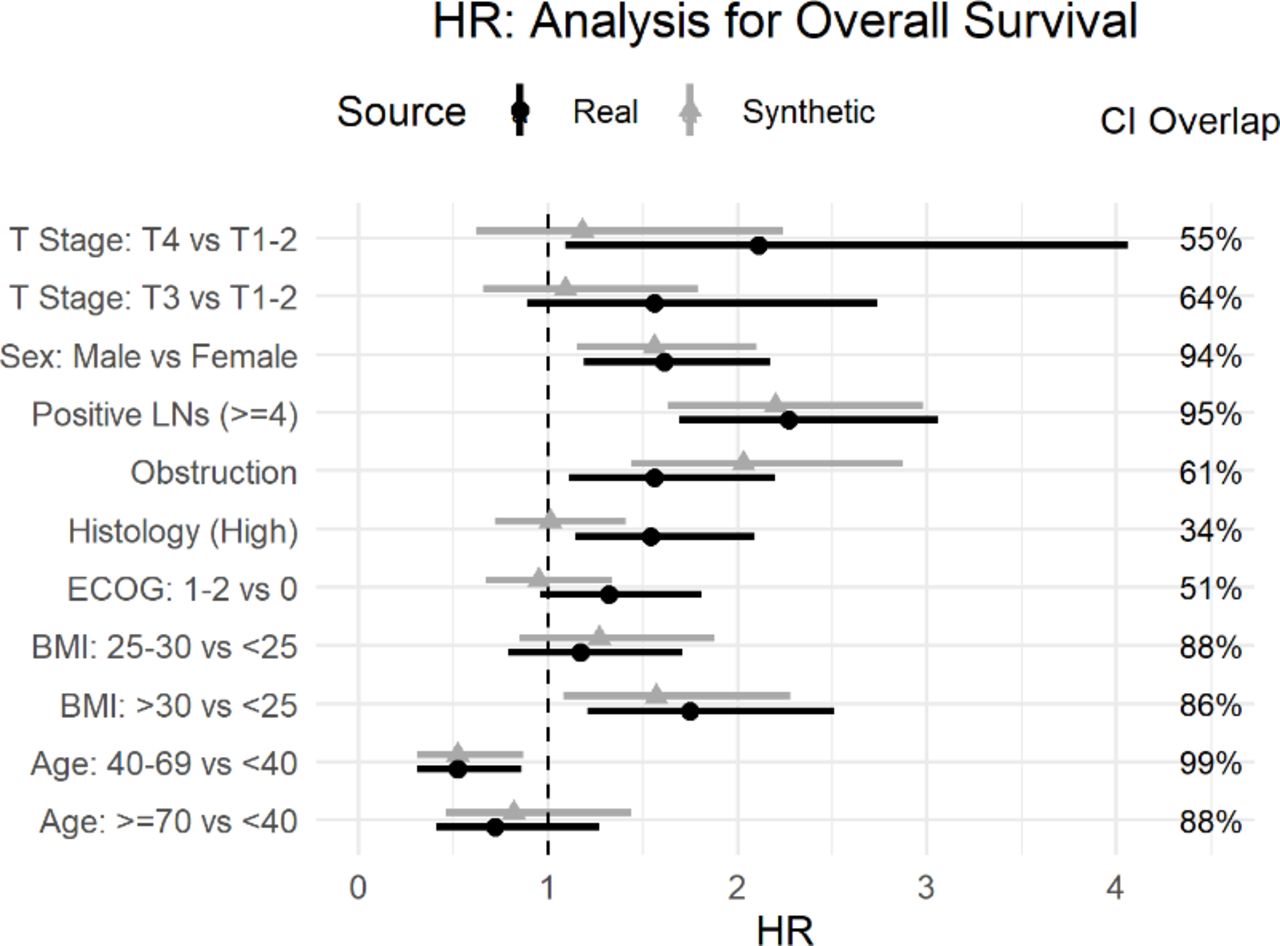
The Cox models were intended to evaluate whether obstruction affects survival after accounting for the potential confounding effect of other covariates. The real and synthetic HR model parameters were generally in the same direction with relatively high overlap for the CIs. This is the case for the OS model in figure 6 and the DFS model in figure 7.

Comparison of real and synthetic Cox model parameters (HR) with the overall survival outcome variable. BMI, Body Mass Index; ECOG, Eastern Cooperative Oncology Group; LNs, Lymph Nodes.

Comparison of real and synthetic Cox model parameters (HR) with the disease-free survival outcome variable. BMI, Body Mass Index; ECOG, Eastern Cooperative Oncology Group; LNs, Lymph Nodes.
The main hypothesis being tested in the published secondary analysis pertains to obstruction. For the OS model the HR for obstruction overlap was high at 61% (HR of 1.56; 95% CI: 1.11 to 2.2 for real data, and HR of 2.03; 95% CI: 1.44 to 2.87 for synthetic data) with both models showing a strong effect of obstruction on OS (No obstruction related to higher OS). Similarly, for the DFS model, the overlap was 86% (real data HR of 1.51; 95% CI: 1.18 to 1.95, and the synthetic data HR of 1.63; 95% CI: 1.26 to 2.1), indicating that the model shows an association between obstruction and DFS. Therefore, one would draw the same conclusion about the impact of obstruction on event-free survival.
The point estimates for the T stage covariates differ the most in figure 6 for OS and figure 7 for the DFS model, with lower CI overlap than many of the other covariates. The same is true for histology in figure 6. While some variation in the numeric values is expected in the synthetic data, the parameters were directionally the same, and the inclusion of these covariates did allow us to control for their effect in the assessment of obstruction, which was the main objective of the analysis.
One other observation from the OS model in figure 6 and the DFS model in figure 7 is that the CIs from the synthetic data are narrower than the real data. A generative model captures the patterns in the data. A plausible explanation is that the machine learning methods used during synthesis capture the signal or patterns in the data well and these are produced more clearly (or with less noise) in the synthetic data.
Discussion
Summary
The purpose of this study was to evaluate the extent to which a published secondary analysis of an oncology clinical trial could be replicated using a synthetic variant of the dataset. This replication is one of the first to test whether similar results and the same conclusions would be drawn from the reanalysis of a published clinical trial analysis using a synthetic version of the dataset.
The published secondary analysis was investigating the relationship between bowel obstruction and event-free survival for patients with colon cancer. We applied a commonly used synthesis approach that ensured the potentially identifying variables (the quasi-identifiers) in the dataset were appropriately synthesised.
We found that for the univariate and bivariate analyses in the published study, the synthetic data were quite similar in terms of distributions and effect sizes to the real data. With respect to the multivariate models that controlled for confounders, the published results were replicated in that there was a strong positive relationship between obstruction and OS and DFS after 5 years in the both the real and synthetic datasets.
Relevance and application of results
In addition to offering more options for addressing privacy concerns, sharing synthetic versions of clinical trial datasets can potentially alleviate the need for obtaining ethics board reviews for such analysis projects,40 simplifying and accelerating research studies.
If the objective of a secondary analysis of a clinical trial dataset is the replication/validation of a published study, then working with a synthetic variant of the dataset will not give the exact numeric results but would be expected to produce the same conclusions as was demonstrated in our study. Another type of secondary analysis is to assess bias in trial design, misreporting or selective outcome reporting where ‘keeping the same conclusions and comparable numerical results of all primary, secondary and safety endpoints […] is of utmost importance’.2 The data synthesis approach we presented here achieves these objectives by including the primary and secondary endpoints in the generative model to ensure that relationships with other covariates are maintained, and it does not synthesise adverse event data to maintain the accuracy of safety data. More generally, a review of protocols found that most secondary analysis of clinical trial datasets focused on novel analyses rather than replication or validation of results.41 In such cases, the conclusions from using synthetic data would be expected to be the same as using the real data. However, it is more difficult to make the case for using synthetic data for the primary analysis of a clinical trial dataset since the investigators and sponsors would have ready access to the real data.
While we are already starting to see published (observational) health research using synthetic data only,40 there will be situations where there is a requirement for additional verification that the model parameters produced from synthetic data are numerically similar to the those from the real data, and that the conclusions are the same. This step can be achieved by implementing a verification server. With such a setup, synthetic data are shared, and the analysts build their models on the synthetic data. Then their analysis code (say an R or SAS programme) is sent to a verification server which is operated by the data controller/custodian. The analysis code is executed on the real data, and the results are returned to the analysts. The returned results would either be the model parameters on the real data or the difference in parameter values between the real data model and the synthetic data model. That way, the analysts can get feedback as to the accuracy of the synthetic data model parameters without having direct access to the real data themselves. The deployment of a verification server balances the need for rapid access to data with minimal constraints with the need for ensuring model accuracy from the synthetic data. On the other hand, it does introduce an additional process step.
The need for a verification server can arise, for example, when results are going to be submitted to a regulator. Generally, in the early days of adoption of data synthesis, there will likely be a greater need for verification, and one would expect that need would dissipate as successful applications of data synthesis increase over time.
This study is a replication of a single clinical trial. However, it does provides evidence that synthesised datasets can be used as a reasonable proxy for real datasets. The data synthesis method is well established and has been applied extensively in the health social sciences. Further such replications should be performed to increase the weight evidence on the effectiveness of synthetic data as a proxy for real datasets. To the extent that synthetic data would allow drawing the same conclusions as real data, they can be more readily shared by researchers when publishing their studies and to meet funding agency requirements for data sharing, and by sponsors to meet their data transparency commitments.
Limitations
The data we used in our analysis came from PDS, which shares datasets that have already gone through a perturbation to anonymise the data. This would not affect our results or conclusions because the published study that we replicated used the same (perturbed) dataset from PDS. More generally, synthetic data can be generated from pseudonymous data rather than from fully anonymised data. Multiple researchers have noted that synthetic data do not have an elevated identity disclosure (privacy) risk,60 64–71 and therefore anonymisation before synthesis is not necessary.
This study was an assessment of the ability to replicate a secondary analysis for a clinical trial dataset. It is a reasonable expectation that as more similar replications using synthetic data demonstrate equivalent results and conclusions as real data, there will be greater acceptance of synthetic derivatives as a reliable way to share clinical trial datasets. In fact, we are already starting to see published (observational) health research using synthetic derivatives only.40
While we found that there were very little differences between the real and synthetic data on the bivariate comparisons, one may hypothesise that this was influenced by the fact that the effect sizes were small. However, that was not the case for the multivariate models where the effect sizes were larger and the differences between the real and synthetic datasets remained small.
Conclusions
As interest in the potential of synthetic data has been growing, an important question that remains is the extent to which similar results and the same conclusions would be obtained from the synthetic datasets compared with the real datasets. In this study, we have provided one answer to that question. Our reanalysis of a published oncology clinical trial analysis demonstrated that the same conclusions can be drawn from the synthetic data. These results suggest that synthetic data can serve as a proxy for real data and would therefore make useful clinical trial data more broadly available for researchers.
Data availability statement
Data may be obtained from a third party and are not publicly available. The dataset can be obtained by registering at Project Data Sphere (https://www.projectdatasphere.org/).
Ethics statements
Ethics approval
This project was approved by the Childrens’ Hospital of Eastern Ontario Research Institute Research Ethics Board (protocol number CHEOREB# 20/75X).
Acknowledgments
The work in this paper was performed in collaboration with the GOING FWD consortium. This article is based on research using information obtained online (www.projectdatasphere.org), which is maintained by Project Data Sphere (PDS), LLC. Neither PDS, LLC, nor the owners of any information from the website have contributed to, approved or are in any way responsible for the contents of this article.
References
Supplementary materials
Supplementary Data
This web only file has been produced by the BMJ Publishing Group from an electronic file supplied by the author(s) and has not been edited for content.
Supplementary Data
This web only file has been produced by the BMJ Publishing Group from an electronic file supplied by the author(s) and has not been edited for content.
Footnotes
Twitter @kelemam
Collaborators GOING‑FWD Collaborators
Co-Principal Investigators
Louise Pilote; McGill University Health Center and McGill University, Canada Colleen M. Norris; University of Alberta, Canada Valeria Raparelli; University of Ferrara, Italy
Site Principal Investigators
Alexandra Kautzky-Willer; Medical University of Vienna, Austria Karolina Kublickiene; Karolinska Institutet, Sweden Maria Trinidad Herrero; Universidad de Murcia, Spain
Co-Investigators
Karin Humphries; University of British Columbia, Canada Monica Parry; Lawrence S. Bloomberg Faculty of Nursing, Canada Ruth Sapir-Pichhadze; McGill University Health Center and McGill University, Canada Michal Abrahamowicz; McGill University Health Center and McGill University, Canada Khaled El Emam; University of Ottawa, Canada Simon Bacon; Concordia University, Canada Peter Klimek; Medical University of Vienna, Austria Jennifer Fishman, McGill University, Canada.
Contributors ZA and KEE contributed to designing the study, performing the analysis and writing the paper. LM contributed to designing the study, implemented some of the code used to perform the analysis and writing the paper. CZ contributed to designing the study, data analysis and writing the paper, and implemented some of the code used to perform the analysis. LP contributed to designing the study and writing the paper.
Funding This work was partially funded by a Discovery grant from the Natural Sciences and Engineering Research Council of Canada (grant number RGPIN-2016-06781), by Replica Analytics Ltd and by the GOING FWD Consortium. The GOING-FWD Consortium is funded by the GENDER-NET Plus ERA-NET Initiative (project reference number GNP-78). ZA is funded by the Canadian Institutes of Health Research (GNP-161904).
Competing interests This work was performed in collaboration with Replica Analytics Ltd. This company is a spin-off from the Children’s Hospital of Eastern Ontario Research Institute. KEE is cofounder and has equity in this company. LM and CZ are data scientists employed by Replica Analytics Ltd.
Provenance and peer review Not commissioned; externally peer reviewed.
Supplemental material This content has been supplied by the author(s). It has not been vetted by BMJ Publishing Group Limited (BMJ) and may not have been peer-reviewed. Any opinions or recommendations discussed are solely those of the author(s) and are not endorsed by BMJ. BMJ disclaims all liability and responsibility arising from any reliance placed on the content. Where the content includes any translated material, BMJ does not warrant the accuracy and reliability of the translations (including but not limited to local regulations, clinical guidelines, terminology, drug names and drug dosages), and is not responsible for any error and/or omissions arising from translation and adaptation or otherwise.