Article Text

Abstract
Objectives To examine the relationship between depression burden, health service utilisation and depression diagnosis in community-based men.
Design Prospective cohort study.
Setting Community-based.
Participants Men aged 35–80 years at recruitment (2002–2005), randomly selected from the northern and western suburbs of Adelaide, Australia, without depression at baseline, who attended follow-up visits (2007–2010) (n=1464).
Primary and secondary outcome measures Depression symptoms were categorised into high burden (total score of ≥13 for the Beck Depression Inventory (BDI) or ≥10 for the Centre for Epidemiologic Studies Depression Scale (CES-D) or low burden (<13 for the BDI or <10 for the CES-D). Diagnosed depression was determined by patient-reported physician diagnosis. Frequent general practitioner (GP) visits were those occurring 5+ times over the preceding year. Use of national medical and prescription services (Medicare Benefit Schedule and Pharmaceutical Benefit Scheme; MBS and PBS) was assessed through data linkage.
Results Frequent attendance and depression diagnosis was more common in men with a high than low burden of depression symptoms (45.9% vs 29.3%–18.7% vs 1.9%, p<0.001). Depression diagnoses were also more common in frequent GP attenders compared with low-average attenders (5.1% vs 2.2%, p<0.001). Among men with high burden of symptoms, there was no age-adjusted or multi-adjusted difference for likelihood of depression diagnosis between non-regular and frequent GP attenders. Annualised MBS and PBS expenditure was highest for men with undiagnosed depression.
Conclusions Men with a high burden of depression symptoms have commensurate use of health services when compared with those with a low burden, but only half report a physician diagnosis of depression. Undiagnosed depression led to a higher usage of medical and prescription services.
- public health
- epidemiology
- depression & mood disorders
- primary care
This is an open access article distributed in accordance with the Creative Commons Attribution Non Commercial (CC BY-NC 4.0) license, which permits others to distribute, remix, adapt, build upon this work non-commercially, and license their derivative works on different terms, provided the original work is properly cited, appropriate credit is given, any changes made indicated, and the use is non-commercial. See: http://creativecommons.org/licenses/by-nc/4.0/.
Statistics from Altmetric.com
Strengths and limitations of this study
First prospective study to examine the association between depression burden and subsequent frequency of general practitioner (GP) usage, likelihood of diagnosis and healthcare usage.
Used a representative sample of residential men aged 35 to 80 years.
Models adjusted for many of the shared confounders of depression status and GP usage.
Did not include younger men or ascertain whether mental health concerns were the primary reason for GP visits.
Introduction
Current estimates of the global suicide mortality rate demonstrates suicide occurs in almost twice as many men (13.5/100 000) as women (7.6/100 000).1 Recent advances in the identification and treatment of major clinical depression have been suggested as important factors that may help close this gender gap.2 3 Currently, however, depression remains more commonly diagnosed in women (5.1% across all age groups) than men (3.6%).1 This difference is largely attributed to a purported reluctance of men to seek help or use existing resources.4 This presumed reluctance is mostly viewed in policy and programme terms as being rooted in the ‘problem of masculinity’.5 There is, however, no empirical evidence that masculinity determines the frequency of healthcare usage. In Australia, for instance, data from the most recent National Health Survey demonstrate 94.4% of women compared with 88.7% of men had consulted with a general practitioner (GP) at least once over the preceding 12 months.6 This difference between genders further narrows once maternal health–related factors are included and does not account for issues including access limitations during working hours.6
The relationship between depressive symptoms and symptom type, depression diagnoses and the use of healthcare services remains unclear.7 Few studies from representative samples have examined the impact of depressive symptom burden on subsequent healthcare usage and management of depressive disorders. Consequently, this study aimed to examine the association between depression burden in men on the frequency of GP attendance, the likelihood of depression diagnosis, and the usage of national medical and pharmaceutical benefit schemes, after accounting for shared risk factors.
Methods
Study design and sampling
Participants for the present study were selected from the Men Androgen Inflammation Lifestyle Environment and Stress (MAILES) study. The MAILES study is composed of suburban, community-dwelling men aged 35–80 years at inclusion and randomly selected from the Northern and Western Statistical Local Areas of Adelaide, Australia. A more detailed description of the study design, procedures and recruitment has been published previously.8 Briefly, a total of 2563 aged-matched men from two existing prospective cohorts (the Florey Adelaide Male Ageing Study (FAMAS) and the North West Adelaide Health Study (NWAHS)) were harmonised into a dataset incorporating detailed information on sociodemographic, clinical, behavioural, chronic disease and medication data. Ethics approval and oversight for the MAILES study was obtained from the Human Research Ethics Committees (HRECs) of the Queen Elizabeth HREC for the North West Adelaide Health Study (approval number: 2010054) and the Royal Adelaide Hospital HREC for the Florey Adelaide Male Ageing Study (approval number: 020305). All participants gave written informed consent.
Patient
Participants were not involved in the design and conduct of this research; however, all available participants are regularly updated on results of the study through a dedicated website (https://www.adelaide.edu.au/freemasons-foundation-centre-for-mens-health/research/mailes), as well as regular Participant Day Events and newsletters.
Depression
Depressive symptom burden
Depressive symptom burden was assessed using the Beck Depression Inventory (BDI)9 in FAMAS men and Centre for Epidemiological Studies Depression Scale (CES-D)10 in NWAHS men. Both the BDI and CES-D show robust agreement in the detection of major clinical depression.9 Both the BDI and the CES-D were also used to define validated subscales of depressive symptoms (somatic, affective, and anhedonia)9 11 for further analysis.
Self-reported depression diagnosis
Physician diagnoses of depression was determined by self-reported responses to the question: ‘Have you ever been told by a doctor that you have depression?’.
Depression medication
Current prescriptions (within 6 months of clinic visit) for antidepressants was determined by record linkage with the PBS for medications within the anatomical therapeutic chemical (ATC) group NO6A. This group encompasses non-selective monoamine reuptake inhibitors (MARIs; NO6AA), selective serotonin reuptake inhibitors (SSRIs; N06AB), non-selective monoamine oxidase inhibitors (MAOIs; NO6AF), non-selective monoamine reuptake inhibitors (MARIs; NO6AA), monoamine oxidase A inhibitors (MAO‐As; NO6AG) and other antidepressants (N06AX).
GP attendance and healthcare usage
Frequency of GP visits was assessed using a self-reported measure. Those who had visited their GP in the preceding 12 months were asked to indicate their frequency of attendance into ordinal categories of 1–2 times, 3–4 times, 5–9 times and 10+ times. For the current analysis, GP frequency was analysed according to the following categories: 0–4 times (low-average attendance) and 5+ times (frequent attendance) based on the Australian government’s National Health Performance Authority classification system.12 Additional information on other healthcare usage was obtained through consented linkage into the Medicare Benefits Schedule (MBS) and Pharmaceutical Benefits Schedule (PBS).
Covariate data
Information on age, education, marital, region of birth, occupational, income, education, smoking, alcohol and leisure-time physical activity status was obtained by self-report using validated items.8 Previous diagnosis of other health conditions was also obtained by self-report, and other medication usage was assessed by both self-report and PBS linkage.8 The Newest Vital Sign13 was used to determine adequate, possibly limited and limited health literacy. Body mass index (BMI), waist circumference, and systolic and diastolic blood pressure were collected in-clinic using standardised clinical protocols.8
Statistical considerations
Analytic sample
Data for the current study were collected at the follow-up assessments which occurred on average at 4.8 years post-baseline. Importantly, given the demonstrated reverse causality between depression and healthcare usage,8 we excluded participants from the analytical sample who reported at the baseline visit any of (1) high depressive symptom burden, (2) a self-reported depression diagnosis or (3) current use of prescribed antidepressant medication. Furthermore, participants without missing responses to depression and GP attendance measures at follow-up comprised the analytic sample for this study (figure 1).

Consort diagram for the study of the association between depression and subsequent health service usage in a community-based cohort of Australian men. Health services measures included frequency of GP services over the previous 12 months and linkage to Medicare and Pharmaceutical Benefits Scheme over the follow-up period. Depression measures include self-reports of physician diagnoses of depression, depression symptoms and use of depression medication (WHO ATC Class NO6A).
Statistical analyses
Descriptive analyses of relationships between categories of GP frequency, depression measures and covariates (see Covariate data section) were initially conducted using χ2 tests (categorical) and t-tests (continuous). Covariate data were selected on the basis of presumed or a priori association between exposure or outcome, and include age. For our analysis of depression burden on GP frequency (see (1), figure 2) and likelihood of depression diagnoses ((2), figure 2), depressive symptoms were further categorised as low burden (total score of 0–11 and 0–9 on the BDI and CES-D, respectively) and high burden (total score of ≥12 and ≥10 on the BDI and CES-D, respectively). GP frequency in the previous year was further analysed according to the following categories: 0–4 times (low-average attendance) and 5+ times (frequent attendance) based on the Australian government’s National Health Performance Authority classification system.12

Study design overview. Men without depression at baseline were examined at follow-up to determine (1) the association between depression burden and subsequent GP frequency in the preceding year, (2) the association between depression burden and subsequent likelihood of a GP diagnosis of depression during the follow-up period, and (3) annualised use of the Medicare Benefit Scheme (MBS) and Pharmaceutical Benefit Scheme (PBS) among men with diagnosed depression, undiagnosed depression and no depression.
Base binomial regression models were conducted for GP frequency (5+ visits; 0–4 visits) on depression diagnosis (Yes; No) controlling for selected covariates. Following this, both main exposure and all covariates with an age-adjusted association with the outcome variable of p≤0.15 were included in the final model (including age (per SD increase), marital, work status, current smoking, number of other chronic conditions (continuous), number of current medications (continuous)). Given an observed interaction effect of depressive burden on estimates for GP frequency on depression diagnosis, models were also stratified by overall and depression subtype burden groups. For the MBS and PBS analysis, consecutive claims data were standardised to 12 months prior to clinic dates through to a final census date of 12 months after follow-up clinics. An annualised MBS and PBS figure was also generated by dividing total claim amount over the census period by years of participant follow-up (median participant follow-up: 4.85 years). For this analysis, participants were further categorised into the following depression groups: Diagnosed depression=physician diagnosis of depression or antidepressant usage (>6 months) during follow-up; Undiagnosed depression=no physician diagnosis of depression or antidepressant usage, but a high burden of symptoms at follow-up; No depression=no physician diagnosis of depression, antidepressant usage or high burden of symptoms at follow-up. Estimated marginal means were used to assess differences in annualised and age-adjusted mean differences of MBS and PBS usage among different depression groups.
All analyses were conducted in STATA (StataCorp. 2018. Stata Statistical Software: Release 16. College Station, TX: StataCorp LP). Statistical significance was set at an alpha level of 0.05 for all analyses.
Results
Descriptive characteristics of depression among GP frequency groups
Overall, 87.9% (n=1244) of men surveyed at follow-up assessments had visited a GP at least once over the preceding year and 30.4% (n=445) were classified as frequent GP attenders (≥5 visits/year). When compared with men with low burden of depression symptoms, frequency of GP visits was higher among men with a high burden, with only 5.1% (n=5) of such men reporting 0 visits (vs 9.4% (n=128)) in the preceding year, compared with 19.4% (n=19) (vs 9.5% (n=130)) who had visited a GP 10 times or more. Among depression categories, there was a higher proportion of frequent attenders in men with a high burden of symptoms (45.9% (n=45), compared with 29.3% (n=400) for low burden), those with a depression diagnosis (50.1% (n=24), cf. 30.1% (n=429) to those without) and among men currently taking medication for depression (75.0% (n=15) cf. 32.2% (n=430) to those who do not). The proportion of those reporting depression diagnoses was highest among those with a higher burden of depressive symptoms (for overall symptom burden and by symptom subtype) (table 1).
GP frequency in the previous year by overall and subgroup depression in a community-based cohort of Australian men aged 35 to 80 years
With increasing GP attendance categories, we also observed higher mean age, number of chronic conditions and current medications, a higher proportion of retirees, sedentary men and a lower proportion of married men (table 1). There was no difference by age in the proportion of men within depression categories. We did observe a higher proportion of men aged 70 years and over with current antidepressant usage, which was consistent when analysed by depression medication class (data not shown).
Association between GP frequency and depression diagnosis by symptom burden
In unadjusted binomial models of the likelihood of a physician diagnosis of depression among men with a high burden of depressive symptoms, frequent GP attenders were initially over three times more likely than low-average attenders to have received a recent diagnosis (OR 2.58, 95% CI 1.56 to 3.87). This effect, however, was equivalent for both frequency groups after age adjustment (OR 1.77, 95% CI 0.73 to 4.26) and multiple adjustment (OR 1.40, 95% CI 0.61 to 3.19). Among men with a low burden of depressive symptoms, frequent GP attenders were approximately three times more likely to receive a depression diagnosis, including after adjustment for shared confounders (OR 2.66, 95% CI 1.54 to 6.98) (table 2). In subgroup analyses, observed estimates did not substantially differ when examined by somatic, anhedonia and affective domains (figure 3).
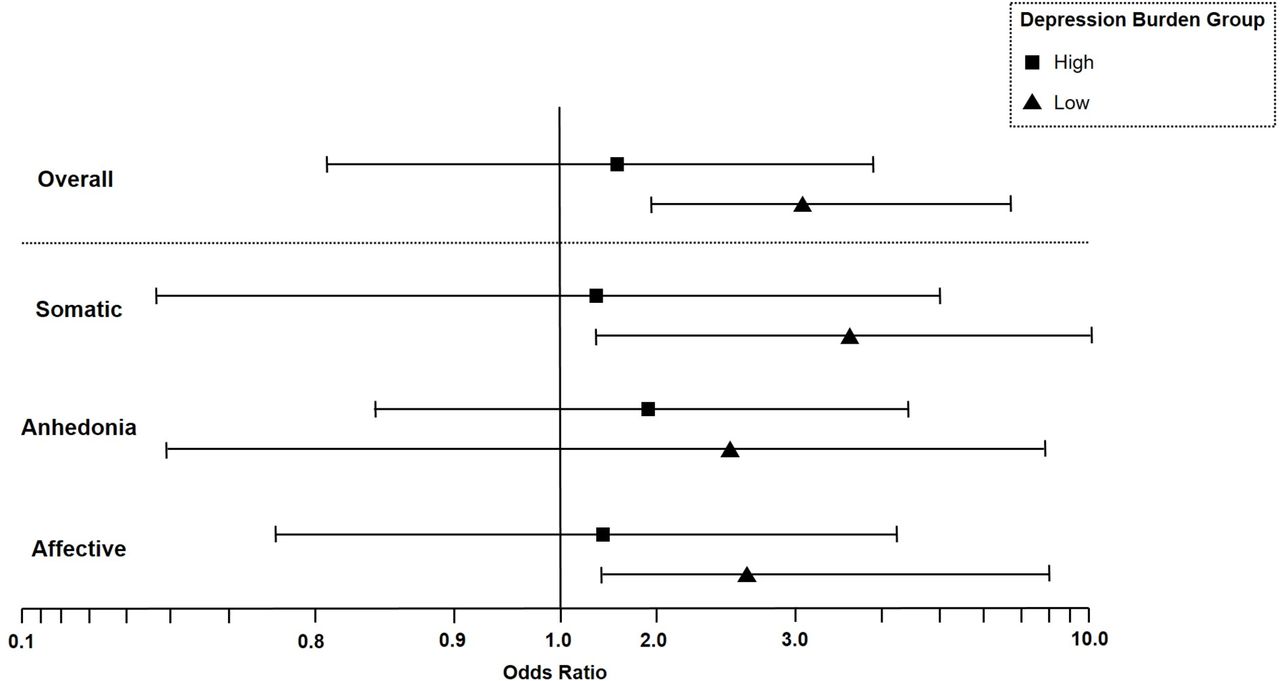
Effect of frequent general practitioner (GP) usage (>5 visits/year) on age-adjusted likelihood of depression diagnosis by overall and subtype depression symptom burden. Data presented are age-adjusted OR for the effect of frequent GP usage in the preceding year on the likelihood of reported depression diagnoses at follow-up, by depression burden group. Symptoms of depression were categorised as follows: Overall: High symptom burden=total score of ≥12 and ≥10 on the Beck Depression Inventory (BDI) and Centre for Epidemiologic Studies Depression Scale (CES-D), for FAMAS and NWAHS participants, respectively; Low symptom burden=total score of 0–11 and 0–9 on the BDI and CES-D, respectively. Somatic, anhedonia and affective depression symptoms subdomains: calculated as per,8 10 High symptom burden=tertile 3; Low symptom burden=tertile 1.
Logistic regression models for the likelihood of depression diagnosis among frequent general practitioner (GP) attenders (>5 visits/year), stratified by high and low depressive symptom burden in a community-based cohort of Australian men aged 35 to 80 years
Association between depression and subsequent MBS and PBS usage
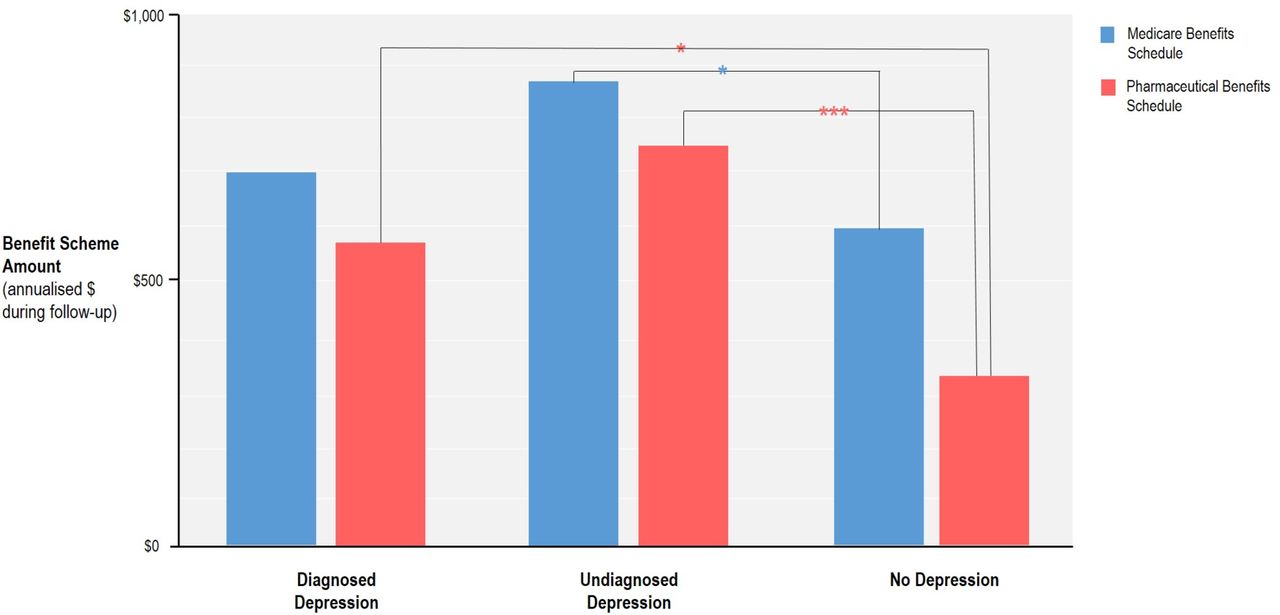
Men with depression had higher levels of both MBS ($A763 per year) and PBS ($A712) expenditure, after adjustment for confounding factors. Men with undiagnosed depression at follow-up were found to expend the highest amount in both MBS ($A872 on average per year) and PBS ($A742), after adjustment for confounders of GP attendance (figure 4).
Annualised and age-adjusted mean differences of Medicare and Pharmaceutical Benefit Scheme usage among different depression groups during follow-up in a community-based cohort of Australian men. Data presented are annualised mean scheme claims during follow-up period (mean: 4.8 years), adjusted for participant age. Depression groups are as follows: diagnosed depression=physician diagnosis of depression or antidepressant usage (>6 months) during follow-up; undiagnosed depression=no physician diagnosis of depression or antidepressant usage, but high burden of depression symptoms; no depression=no physician diagnosis of depression, antidepressant usage or high burden of symptoms at follow-up; *p<0.05, ***p<0.001.
Discussion
We demonstrated that over 90% of the men surveyed had attended their GP at least once in the preceding year. The frequency of overall GP attendance among comparably aged men in the Australian National Health Survey6 was 89.6% and 88% in the Men in Australia Telephone Survey (MATeS).14
The available data on primary care usage by men with depression are less clear, with studies indicating increased, equivocal and decreased health service utilisation by these men (see15). In the current study of a large, representative sample of men, 96% of the subgroup with a high burden of depressive symptoms attended their GP at least once in the preceding year. These men were also more likely to be frequent (>5 visits per year) users of GP services compared with men without, or a low burden of, depression symptoms.
In regards to the diagnosis of depression, after adjustment for related confounders (eg, age, number of comorbidities and medications), we found no relationship between GP frequency of attendance and a likelihood of a diagnosis of depression being in men with a high symptom burden. However, among those with a low burden of depressive symptoms, frequent GP attenders were almost three times more likely to have received a diagnosis of depression, even after adjustment for confounders. Earlier studies have typically suggested such discrepancies arise through a failure by men with severe depression to report their symptoms.16 However, our results clearly demonstrate that contrary to popular belief, men with significant depressive symptoms are engaging with medical professionals, and do so more frequently than men with low-average depressive symptoms. The conversion of symptoms to a diagnosis appears to be the missing link in this group of men.
Over recent decades, there has been increased interest in the different ways depressive symptoms are experienced and reported by men.17 Previous studies, mostly in primary care, have consistently demonstrated that severe depressive symptoms are often reported in the context of somatic complaints,18 especially in men.19 Our data, however, suggest no difference in depression diagnosis likelihood when stratified by somatic, affective or anhedonia domains. A case analysis of typical patients diagnosed with depression involving 1760 GPs who participated in the Australian RADAR Program18 concluded that somatic symptoms were the most important predictors of depression severity in primary care. There are limited comparisons that can be made with our data given this study did not report estimates by gender, and relied on GP recall of depression severity and symptom domain using Likert scales, rather than validated depression symptom measures from patients. More recent studies suggest that men’s depression may be better characterised by externalised symptoms (eg, anger, alcohol misuse, risk-taking),20 rather than the more traditional symptoms included in most questionnaires for depression such as chronic low mood and amotivation.21 This difference in presentation and assessment likely contributes to the differential rates of diagnosis observed between men and women.22 23 While the disproportionately high rate of suicide in men is often attributed to a reluctance by men to seek help for depression,24 our data and others25 suggest there are other healthcare factors (eg, male-specific depression symptom questionnaires, GP education) that must be urgently addressed.
Our study also demonstrated that medical and pharmaceutical scheme claims were greatest in those men with a high depression symptom burden that remained undiagnosed.26 27 An earlier German study of 451 primary care patients aged over 75 years had similarly found higher mean annual healthcare costs in undiagnosed compared with diagnosed depression cases (€5582 vs €4722, respectively).28 Effective treatment of depression has been shown to lower healthcare costs.29 30
The strengths of the current analysis include the use of a representative cohort of well-characterised men, the inclusion of validated, depression symptom questionnaires to differentiate between symptomatic and asymptomatic men, and the use of MBS and PBS linkages in addition to self-reports of healthcare usage. Limitations include the absence of men younger than 35 years who are often the least likely to use GP services, comparatively low numbers of men with both depression and infrequent GP usage, and the inability to ascertain whether mental health concerns were the primary reason for our participants GP visit.
Counter to the prevailing view that men, and especially men with depression, fail to appropriately engage with healthcare services, this study unequivocally demonstrates that men overwhelmingly do attend GP services. However, in the case of those with a high burden of depressive symptoms, more frequent attendance does not increase the likelihood of a diagnosis of depression by a GP. While further work is urgently required to better understand the presentation of depression in men, this study highlights that there are indeed missed opportunities for targeted inquiry relating to depressive symptoms in men. We have further demonstrated that untreated or ineffectively treated depression is a major driver of healthcare expenditure which should provide further impetus to encourage healthcare professionals to initiate dialogue with their male patients around any mental health concerns.
Acknowledgments
The authors would like to acknowledge the clinic and recruitment staff for their invaluable efforts. Particular thanks are extended to Janet Grant, Sandy Pickering and to staff of the North West Adelaide Health Study for all their assistance. Thanks to Chris Seaborn and Erika Bowden at the Department of Nuclear Medicine, The Queen Elizabeth Hospital for providing expertise and assistance with DXA procedures. The authors also acknowledge Siemens Healthcare for providing the radioimmunoassay kits for all Immulite assays. Finally, thanks are extended to our participants and their families for their invaluable contributions.
References
Footnotes
Contributors SM is guarantor of the paper, taking responsibility for the integrity of the work as a whole, from inception to published article. SM and GAW conceived of the study, interpreted data, drafted the manuscript and contributed to the acquisition of funding. IZ conceived of the study, interpreted data and drafted the manuscript. RJA conceived of the study, interpreted data and contributed to the acquisition of funding. AV and SM analysed the data and revised the manuscript. SA interpreted data and revised the manuscript. All authors read and approved the final manuscript.
Funding This work was supported by the Australian Government National Health and Medical Research Foundation (Project Grant # 627227, Investigator Grant # 1113423).
Competing interests SM has received research funding from the National Health and Medical Research Council of Australia. RJA reports grants from National Health & Medical Research Council (Project Grant no. 627227), grants from ResMed Foundation during the conduct of the study; non-financial support from Embla Systems, Colorado, outside the submitted work. GAW reports grants from National Health & Medical Research Council (Project Grant no. 627227), grants from ResMed Foundation during the conduct of the study; non-financial support from Embla Systems, Colorado, personal fees from Eli Lilly, Bayer Schering, Sanofi, Novo Nordisk, AstraZeneca, INova and Elsevier outside the submitted work. IZ, AV and SA have no competing interests to declare.
Patient and public involvement Patients and/or the public were not involved in the design, or conduct, or reporting, or dissemination plans of this research.
Patient consent for publication Not required.
Provenance and peer review Not commissioned; externally peer reviewed.
Data availability statement Data are available on reasonable request. Due to institutional requirements surrounding participant data, all relevant data are available on request by contacting digital-library@adelaide.edu.au with the support of the relevant study group (FAMAS Investigators: famas.clinic@adelaide.edu.au).