Article Text

Abstract
Objective To describe the characteristics and outcomes of patients with a clinical diagnosis of COVID-19 and false-negative SARS-CoV-2 reverse transcription-PCR (RT-PCR), and develop and internally validate a diagnostic risk score to predict risk of COVID-19 (including RT-PCR-negative COVID-19) among medical admissions.
Design Retrospective cohort study.
Setting Two hospitals within an acute NHS Trust in London, UK.
Participants All patients admitted to medical wards between 2 March and 3 May 2020.
Outcomes Main outcomes were diagnosis of COVID-19, SARS-CoV-2 RT-PCR results, sensitivity of SARS-CoV-2 RT-PCR and mortality during hospital admission. For the diagnostic risk score, we report discrimination, calibration and diagnostic accuracy of the model and simplified risk score and internal validation.
Results 4008 patients were admitted between 2 March and 3 May 2020. 1792 patients (44.8%) were diagnosed with COVID-19, of whom 1391 were SARS-CoV-2 RT-PCR positive and 283 had only negative RT-PCRs. Compared with a clinical reference standard, sensitivity of RT-PCR in hospital patients was 83.1% (95% CI 81.2%–84.8%). Broadly, patients with false-negative RT-PCR COVID-19 and those confirmed by positive PCR had similar demographic and clinical characteristics but lower risk of intensive care unit admission and lower in-hospital mortality (adjusted OR 0.41, 95% CI 0.27–0.61). A simple diagnostic risk score comprising of age, sex, ethnicity, cough, fever or shortness of breath, National Early Warning Score 2, C reactive protein and chest radiograph appearance had moderate discrimination (area under the receiver–operator curve 0.83, 95% CI 0.82 to 0.85), good calibration and was internally validated.
Conclusion RT-PCR-negative COVID-19 is common and is associated with lower mortality despite similar presentation. Diagnostic risk scores could potentially help triage patients requiring admission but need external validation.
- COVID-19
- molecular diagnostics
- epidemiology
This is an open access article distributed in accordance with the Creative Commons Attribution Non Commercial (CC BY-NC 4.0) license, which permits others to distribute, remix, adapt, build upon this work non-commercially, and license their derivative works on different terms, provided the original work is properly cited, appropriate credit is given, any changes made indicated, and the use is non-commercial. See: http://creativecommons.org/licenses/by-nc/4.0/.
Statistics from Altmetric.com
Strengths and limitations of this study
Large cohort of consecutive acute medical admissions in two hospitals covering a diverse population in London, UK, during first COVID-19 ‘peak’.
Assessment of ‘real-world’ performance of SARS-CoV-2 reverse transcription-PCR (RT-PCR) from nasopharyngeal swabs for diagnosis of COVID-19.
Inherent limitations of retrospective cohort study design, including some missing data.
Not all patients had SARS-CoV-2 RT-PCR testing.
Introduction
The COVID-19 global pandemic, caused by infection with theSARS-CoV-2, has led to unprecedented numbers of unwell and infectious patients requiring admission to hospital. The symptoms of COVID-19 can be nonspecific, so diagnostic confirmation in hospital is often sought by detection of SARS-CoV-2 RNA sequences by reverse transcription-PCR (RT-PCR) from a clinical specimen.
Since the beginning of the pandemic, the standard sample for PCR testing has been a nasopharyngeal swab (NPS) or aspirate, but there are concerns that a significant proportion of cases tests negative on initial RT-PCR of an NPS sample, with many patients having repeated sampling to confirm the diagnosis.1 A systematic review of real-world diagnostic sensitivity of SARS-CoV-2 RT-PCR reports that up to 33% of patients with COVID-19 may have an initial false-negative NPS result despite a compatible clinical illness, consistent thoracic imaging and/or subsequent positive antibodies to COVID-19.2–5 False-negative RT-PCR may result from inadequate nasopharyngeal sampling technique, delayed time to analysis, ineffective sample storage, variable gene targets in RT-PCR assays leading to imperfect analytic sensitivity or if a patient is tested at a point when viral throat carriage is absent or below the detectable threshold (either too early or too late).6 7 This high false-negative rate complicates both hospital infection control and clinical decision-making. Being able to identify patients with a high probability of COVID-19 despite a negative RT-PCR is crucial for effective clinical care.
The clinical characteristics and outcomes of hospitalised patients with COVID-19 have been well described globally, but these studies are limited to patients with RT-PCR-confirmed COVID-19.8–10 The pattern of disease and outcomes of patients with false-negative COVID-19 tests has neither been well reported to date nor the diagnostic accuracy of RT-PCR assays in secondary care settings in the UK. Several studies have derived and validated risk scores to assess severity and prognosis among patients with COVID-19; however, few risk scores focus on identifying patients with COVID-19 among those needing hospital admission and those that do are from outside the UK, do not consider all hospital admissions, rely on high-resolution CT scanning of the lungs and exclude patients without RT-PCR-confirmed disease.11
We, therefore, aim to describe the characteristics and outcomes of patients with a clinical diagnosis of COVID-19 but with negative RT-PCR from NPS and the real-world sensitivity of RT-PCR for COVID-19. Second, we describe predictors of COVID-19 among general medical admissions, including assessing whether a simple diagnostic risk score could be derived, internally validated and used to predict which patients admitted to medical wards will have COVID-19.
Methods
Study design
This is a retrospective observational cohort study of consecutive admissions in London North West University Healthcare NHS Trust, comprising two hospitals, Northwick Park and Ealing. Patients were included in this study if they were admitted via the acute medical team between 2 March and 3 May 2020 inclusive.
Data collection
Cases were identified retrospectively through electronic medical admission lists. Deidentified data on patient demographics, comorbidities, clinical characteristics, vital signs, routine biochemical, haematological and microbiological tests, diagnosis and clinical outcomes were extracted from routinely collected clinical data using electronic patient record systems and other NHS Trust health information systems. Physiological observations were those first recorded on admission to the emergency department. All biochemical and haematological data were from the first samples taken within 48 hours of admission. Thoracic imaging (chest radiographs and CT) were reported by consultant radiologists and coded based on COVID-19 guidelines from the British Society of Thoracic Imaging (BSTI).12
RT-PCR of a clinical specimen from NPS was the only SARS-CoV-2 testing available during the study period. The decision to test was based on a clinical suspicion of COVID-19. Testing was performed at the point of admission or as soon as possible afterwards. Due to high demand and limited capacity, some patients with high clinical suspicion did not undergo SARS-CoV-2 testing. Routine testing for all admissions was introduced after the study period. Most SARS-CoV-2 testing was done using Panther Fusion (Hologic; ORF1ab Region 1/2 target) or Abbott RealTime (RNA-dependent RNA polymerase, nucleocapsid target) assays on NPS.
Approval for this study was provided by London North West University Healthcare NHS Trust research and governance department, and the NHS Health Regulatory Authority (IRAS ID 285815). Written informed consent from participants was not obtained in compliance with Secretary of State for Health and Social Care ‘Notice’ under Regulation 3 (4) of the Health Service Control of Patient Information Regulations 20 021 requiring health providers to process confidential patient and Control of Patient Information Regulations due to the COVID-19 pandemic.
Definitions
Patients were assigned as having RT-PCR-confirmed COVID-19 if they had a positive SARS-CoV-2 RT-PCR within 7 days before or after the date of admission and had a discharge diagnosis of COVID-19 recorded by the clinical team. False-negative RT-PCR COVID-19 was defined as patients with a discharge diagnosis of COVID-19 made by the clinical team and one or more negative SARS-CoV-2 RT-PCR within 48 hours of admission in the absence of any positive SARS-CoV-2 RT-PCR results. Patients with evidence of alternative diagnoses (ie, not COVID-19) made by the clinical team and no positive SARS-CoV-2 RT-PCR results were defined as not having COVID-19. Medical records were reviewed for patients with positive SARS-CoV-2 tests greater than 7 days after admission but before discharge and a diagnosis of COVID-19, to assess whether the admission was likely to represent a missing or delayed SARS-CoV-2 RT-PCR result (ie, patients with community-acquired COVID-19) or nosocomial COVID-19 transmission. Mortality was assessed at discharge from hospital.
Statistical methods
Basic descriptive statistics were performed, with continuous data presented as median (IQR) and categorical data as frequency (%). Comparisons were made using χ2 tests for proportions, t-tests for means and Wilcoxon rank sum for medians. Logistic regression was used to assess associations between variables and diagnosis of COVID-19. In exploratory analyses to assess association between RT-PCR-negative COVID-19 and mortality, a multivariable logistic regression model was used adjusting for other variable associated with poor outcomes in COVID-19.13
Sensitivity and false-negative RT-PCR
The real-world sensitivity of SARS-CoV-2 RT-PCR from NPS against a reference standard of a clinical diagnosis of COVID-19 was estimated as the proportion of patients positive from any RT-PCR, excluding those without any valid RT-PCR results. Sensitivity was also calculated by restricting analyses to patients with two or more RT-PCR results from NPS taken in a 24-hour and 48-hour period. The reference standard was patients with at least one positive RT-PCR in the time period. Incremental yield of a second RT-PCR following an initial negative result in patients was also calculated. Specificity of SARS-CoV-2 RT-PCR was assumed to be 100%.
Diagnostic risk score
In development of a score to predict COVID-19 among medical admissions, candidate predictor variables were selected based on a priori knowledge, published literature, clinical reasoning and the need for variables to be objective, reproducible, available in the emergency department soon after presentation. We considered demographic characteristics (age, sex, ethnicity), clinical symptoms associated with COVID-19 (cough, fever or shortness of breath), vital signs (including National Early Warning Score 2 (NEWS 2)) and laboratory bloods (including C reactive protein (CRP) and arterial/venous blood gas) at the time of presentation to hospital.
Continuous variables were assessed for non-linearity using fractional polynomials and categorised based on established cut-off values and/or fractional polynomials. Complete case analysis was chosen for derivation and internal validation of the score, given most key variables had fewer than 10% missing data. To derive a prediction model, we undertook univariable logistic regression analysis assessing associations between candidate variables and COVID-19 diagnosis (including all COVID-19 irrespective of RT-PCT status). We then used a backward elimination approach to create a multivariable predictive model, with stepwise elimination of variables, using likelihood ratio tests and Akaike information criterion to compare models. Interaction in the model was also assessed using likelihood ratio testing.
Points were assigned to each variable by identifying clusters of regression coefficients from the final model, then taking the median of those clustered coefficients and scaling, so the lowest point score is at least 1, and then rounding to the nearest integer.14 A COVID-19 diagnostic risk score was then derived by combining the points based on patient characteristics. Performance of both the full predictive model and risk score was assessed using the area under the receiver operating characteristic (AUROC) curve (also known as concordance statistic) for discrimination and plots of predicted probability of COVID-19 against observed risk of COVID-19 for calibration (calibration plots). Decision curve analysis was also conducted to help weigh benefits of using the model, compared with assuming all or no patients were diagnosed with COVID-19, and comparison with other single variables with strong associations with COVID-19.
Internal model validation was done using the bootstrap procedure, with final model applied to each bootstrap sample (n=200), and an optimism-corrected AUROC curve was calculated.15 A prediction model was also generated using bootstrap samples and tested on the original data set. Cut-off thresholds were defined to identify patients at high-risk and low-risk of COVID-19 after plotting risk score against observed COVID-19 risk such that the high-risk group accounted for as many COVID-19 cases as the low risk as few as possible. Sensitivity, specificity, positive predictive value (PPV) and negative predictive value (NPV) were calculated for each threshold, and NPV and PPV were calculated for varying prevalence of COVID-19 among medical admissions. Sensitivity analysis used multivariate multiple imputation with chained equations for missing data, assuming they were missing at random. Imputation was done for missing candidate predictor variables using 20 imputations, and model generation and performance were repeated. All analyses were done using Stata V.16 (StataCorp 2019). Predictive modelling elements are presented in accordance with TRIPOD guidance.16
Results
Patient characteristics
Between 2 March and 3 May 2020, 4008 patients were admitted (2536 at Northwick Park Hospital and 1472 at Ealing Hospital), with 1792 (44.7%) diagnosed with COVID-19 (figure 1). There were a median of 65 (IQR 57–76) admissions daily, including median daily admission of 47 (IQR 28–56) patients diagnosed with COVID-19 (online supplemental figure 1). COVID-19 diagnoses of 1391 (77.6%) had at least one positive SARS-CoV-2 RT-PCR, 283 (15.8%) had at least one negative and no positive RT-PCR, and 119 (6.6%) did not have an RT-PCR result.
Supplemental material

Patient flow diagram by final diagnosis and SARS-CoV-2 RT-PCR status with outcomes. Note ‘presumed COVID-19’ includes patients who were RT-PCR negative (n=293) and those who did not have a valid RT-PCR results (n=109). RT-PCR, reverse transcription-PCR.
There were several differences between patients with and without a COVID-19 diagnosis at discharge (including those with false-negative RT-PCR results, table 1, online supplemental table 1). Most notably patients with COVID-19 were more likely to be men, be more unwell at admission (NEWS score 6 vs 2 for patients without COVID-19) and more likely to need supplementary oxygen. On chest radiograph, patients with COVID-19 were more likely to have lung infiltrates (79% vs 48%) and less likely to have clear lung fields (7% vs 33%).
Supplemental material
Baseline characteristics and outcomes for patients, including demographics, co-morbidities, admission vital signs and laboratory blood tests, stratified by diagnosis and SARS- CoV-2 RT-PCR status
Outcomes
Overall, 248 (6.2%) of medical admissions were admitted to intensive care unit (ICU) for level 2 or 3 support. Patients with COVID-19 diagnosis were more likely to be admitted to ICU (12.7% compared with 1.0%, p<0.0001). Median time to intensive care admission was 1 day (IQR 0–3) from admission. Inpatient mortality was 15.6% overall with substantially higher mortality in patients with COVID-19 diagnosis (26.9% compared with 6.4%). Of 0.4% (n=16) remained admitted at the time of data extraction or were missing mortality status. Inpatient death occurred a median of 5 (IQR 2–10) days after admission for patients with COVID-19, and hospital stay was longer than for those without COVID-19 (median 5 (IQR 3–11) days compared with median 3 (IQR 1–7) days, p<0.0001).
Sensitivity of SARS-CoV-2 RT-PCR
Based on patients with COVID-19 with at least one valid SARS-CoV-2 RT-PCR result (n=1674), 16.9% (n=283) diagnosed with COVID-19 had at least one false-negative RT-PCR. Of 217 patients had a single negative result, with 66 having two or more negative results. Median time from admission to negative swab was 0 (IQR 0–1) days. Based on a clinical COVID-19 reference standard, the sensitivity of PCR was 83.1% (95% CI 81.2% to 84.8%). The diagnostic yield (ie, including those without SARS-CoV-2 PCR results) of SAR-CoV-2 PCR testing of NPS was 77.6% (95% CI 75.6% to 79.5%). If restricted to patients with chest radiology suggestive of COVID-19, 198/968 patients with COVID-19 were RT-PCR negative, giving a sensitivity of 79.6%.
A total of 185 patients with COVID-19 had two RT-PCR tests within 24 hours, at least one of which was positive. Of 35/185 had a false-negative RT-PCR, giving a sensitivity of 81.1% (95% CI 74.7% to 86.5%). Of 62/254 patients with COVID-19 and two or more RT-PCR tests within 48 hours, giving a sensitivity of 75.6% (95% CI 70.0% to 80.5%). A total of 557 patients with two RT-PCR tests within 24 hours had an initial negative test, of whom 17 had a second test that was positive, giving an incremental yield of 3.1% (95% CI 1.9% to 4.8%). Of 36/669 patients with an initial negative RT-PCR had a second test that was positive within 48 hours, giving an incremental yield of 5.4% (95% CI 3.9% to 7.4%).
False-negative COVID-19 RT-PCR
Of patients with RT-PCR-negative COVID-19, 70.0% (198/283) had chest radiography or chest CT suggestive of COVID-19 based on BSTI coding, 80.2% (227/283) had lung infiltrates on chest imaging, and only 6.7% (19/283) had normal lung fields on chest radiography; 88.0% reported cough, fever or shortness of breath at admission. Broadly, patients with false-negative RT-PCR COVID-19 and those confirmed by positive PCR had similar demographic and clinical characteristics. Distribution of NEWS score and CRP were similar to RT-PCR-confirmed patients with COVID-19 and differed from those without COVID-19 diagnosis (online supplemental figure 2). Notable differences include false-negative patients with RT-PCR COVID-19 being more likely to report shortness of breath, slightly longer duration of symptoms (median of 7 (IQR 3–12) days compared with 6 (IQR 3–10) days for PCR-positive patients) (table 1). False-negative patients with RT-PCR also had higher median lymphocyte and platelet counts.
Supplemental material
Importantly, outcomes were worse for patients with RT-PCR-confirmed COVID-19 compared with those who were had a false-negative RT-PCR, with a higher proportion admitted to ICU (13.8 (95% CI 12.1 to 15.7 vs 7.8 (95% CI 5.2 to 11.5)%, p=0.006), and more patients dying during admission (29.3 (95% CI 27.0 to 31.8)% vs 16.6 (95% CI 12.7 to 21.4)%, p<0.0001). When limited to patients with chest radiology suggestive of COVID-19, patients with false-negative RT-PCR disease still had better outcomes than PCR-confirmed COVID-19 (ICU admission 8.4%, mortality 16.3%, n=227). In exploratory analyses adjusted for age, sex, comorbidities, admission oxygen saturation and admission urea, OR for mortality was 0.41 (95% CI 0.27 to 0.61) for RT-PCR-negative compared with RT-PCR-positive COVID-19 (see online supplemental figure 2).
Predictors of COVID-19 and diagnostic model
Several demographic and clinical variables were strongly associated with a diagnosis of COVID-19, both in univariable and multivariable analysis (table 2). Abnormal chest radiography with infiltrates (OR 7.8, 95% CI 6.3 to 9.6), CRP over 50 (OR 6.0, 95% CI 5.2 to 6.9) and NEWS 2 score 5 or more (OR 5.2, 95% CI 5.0 to 6.6) had the strongest associations with COVID-19 diagnosis.
Univariable and multivariable logistic regression analysis for risk of COVID-19 diagnosis
The final multivariable diagnostic model included age (modelled as a binary variable being between 50 and 70 years old), sex, ethnicity, reporting anyone of cough, fever or shortness of breath, NEWS 2, CRP and chest radiograph appearance (n=2940 table 3). Discrimination of the full model was moderate (AUROC curve 0.83, 95% CI 0.82 to 0.85), with good calibration (see figure 2). A simplified risk score was constructed based on β coefficients (table 3), with similar calibration and discrimination to the full model (AUROC curve 0.83, 95% CI 0.81 to 0.84). Internal validation using bootstrap samples (n=200) generated an optimism-corrected AUC 0.82 (95% CI 0.80 to 0.84), AUC for internal validated model 0.83 (95% CI 0.81 to 0.85). Decision curve analysis showed that the diagnostic risk score model had better clinical utility across a range of thresholds than treating all or no patients as having COVID-19, using a CRP of >50 or a NEWS score ≥5 (see figure 2). The model and risk score performed similarly in sensitivity analyses using multiple imputation instead of complete case analysis and assessing the risk score using the whole patient population (see online supplemental table 3).
Supplemental material

(A) ROC for the full diagnostic predictive model. AUC 0.839 (95%CI 0.824 to 0.853), n=2940. (B) Calibration plot showing observed compared with predicted risk of COVID-19 diagnosis as deciles, with 95% CI. The dashed green line shows perfect calibration. (C) Decision curve analysis showing standardised net benefit at different threshold probabilities for diagnosing patients with COVID-19, comparing diagnosing all patients as COVID-19 (blue solid line), diagnosing no patients with COVID-19 (solid red line), and various diagnostic risk models, including the COVID-19 diagnostic score (full model and simplified risk score), CRP over 50, and NEWS of 5 or more. AUC, area under the curve; CRP, C reactive protein; NEWS, National Early Warning Score; ROC, receiver operating characteristic curve.
Multivariable logistic regression diagnostic model for COVID-19, with regression (β) coefficients and diagnostic score points
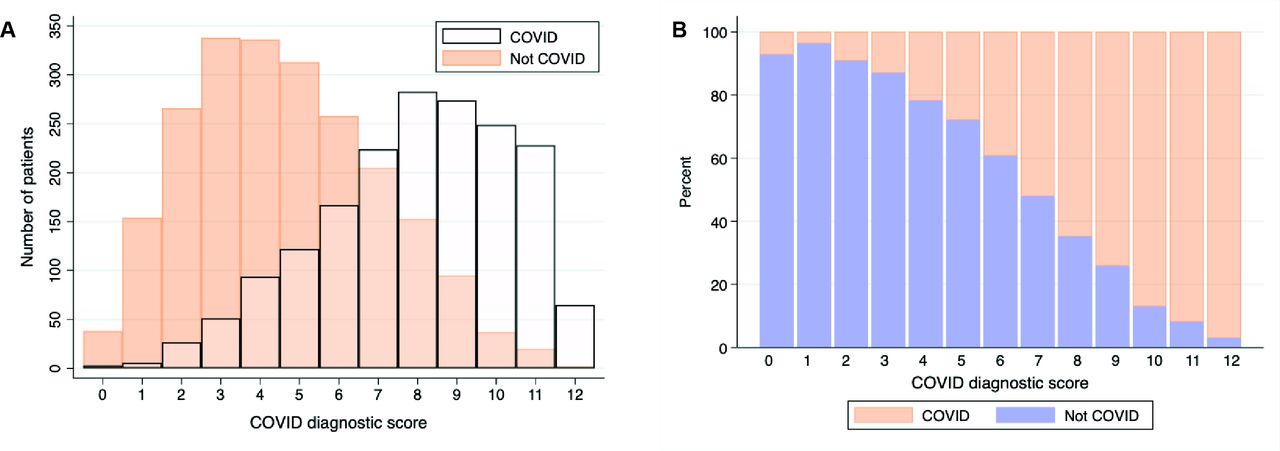
The number and proportion of patients with or without COVID-19 diagnosis based on the risk score are shown in figure 3. Of 446 (15%) patients had a score of <4, of whom 10.9% (49/446) were diagnosed with COVID-19. Using this threshold to identify patients without COVID-19 had a 26.6% sensitivity, but 96.6% specificity, with an 89.0% PPV(table 4). A total of 594 (20.2%) patients were above the high-risk threshold, set at a diagnostic risk score >9. At high COVID-19 prevalence (50%), this threshold had a good PPV (>90%), and at a low prevalence (<5%), it had a high NPV; however, most patients fell in between both thresholds. Potential uses for such a clinical score are highlighted in online supplemental table 4.
Supplemental material

(A) Overlaid histogram of COVID-19 diagnostic risk score and number of patients with COVID-19 (white) and alternative (not COVID-19) diagnoses. (B) Proportion (%) of patients with COVID-19 (orange) or alternative (not COVID-19, blue) diagnoses by COVID-19 diagnostic risk score. N=2940.
Diagnostic performance of a low COVID-19 risk threshold (less than four points on the diagnostic score) and high-risk threshold (greater than nine points)
Discussion
The key findings of this study are that SARS-CoV-2 RT-PCR-negative COVID-19 is common among patients admitted to hospital, with real-life sensitivity of RT-PCR testing from NPS being 83% compared with a clinical reference standard of clinical diagnosis of COVID-19. Patients with RT-PCR-negative COVID-19 had similar clinical characteristics to RT-PCR-positive patients in this and other cohorts,17 although significantly better outcomes (lower risk of mortality and ICU admission).14 17 The proportion and number of COVID-19 admissions were increased during a 3-week period from the 22 March to 11 April 2020, and patients with COVID-19 were substantially more unwell than patients without COVID-19, with implications for service delivery. Mortality in patients admitted without COVID-19 was also high at 6.4%.
The current gold-standard diagnostic test for COVID-19, SARS-CoV-2 PCR from NPS, has several limitations, which are challenging health systems and healthcare facilities management. We demonstrate, despite high analytical sensitivity, the real-life sensitivity of PCR is inadequate (around 80% at best).18 Repeat testing of patients with an initial negative RT-PCR only increased yield by 3%–5% within 48 hours. In addition to slow turnaround times, and resource and logistical challenges, there is an urgent need for alternative rapid and accurate methods to triage and stratify patient’s risk of COVID-19, to allow appropriate infection control measures and safe patient flow to cohort areas or isolation rooms, without overwhelming hospital infrastructure. CT imaging of lungs can lack specificity for COVID-19, and rapid RT-PCR platforms are expensive and have inadequate throughput for future peaks of COVID-19.19 20 Few studies have assessed pragmatic tools to assess risk of COVID-19 based on readily available clinical or laboratory variables.21 22
We found several clinical, radiological and laboratory blood factors that were associated with COVID-19. Our diagnostic score had moderate performance for discriminating COVID-19 from other diagnoses (AUROC curve 0.83). A low-risk threshold had a good specificity and PPV, therefore, it could be used to identify patients with a low COVID-19 risk for transfer to a low-risk cohort area. Similarly, the high-risk score had a good PPV and specificity, therefore, these patients could be managed as having COVID-19 and cared for in isolation rooms or cohorts if necessary. Those patients in neither high-risk nor low-risk group may benefit from rapid COVID-19 RT-PCR or antigen testing, depending on capacity; however, this score would need external validation before use. Although derived from a cohort including unselected acute medical admissions, the higher prevalence of other respiratory viral pathogens may impact performance, especially specificity.23 Furthermore, this score does not account for the vulnerability of individual patients for severe COVID-19 (eg, based on age or comorbidities), which would also impact decisions on isolation and testing.23
This is the first study, to our knowledge, reporting lower ICU admissions and mortality in RT-PCR-negative patients with COVID-19, despite similar markers of disease severity at admission (NEWS, CRP, oxygen saturations and requirement for supplementary oxygen), and in multivariable adjusted model. Interestingly, the median duration of symptoms was slightly longer, and median lymphocyte count was slightly higher in PCR-negative patients, suggesting they presented slightly later in their disease course, and, therefore, may be at a phase of illness with lower viral burden in the upper respiratory tract.24–26 This may also be associated with their better prognosis. Other potential reasons for better outcomes in PCR-negative patients with COVID-19 include misclassification bias, where other respiratory conditions may have been classified as COVID-19. However, sensitivity analysis in patients with chest radiology suggestive of COVID-19 had similar findings, and a small number of misclassifications are unlikely to lead to such substantial differences in mortality. RT-PCR result may, therefore, be important in prognostic scores for COVID-19, especially as its association with mortality was independent of other key predictors such as age and sex. Patients with RT-PCR-negative COVID-19 should also be included in treatment trials, and the efficacy of treatment could be analysed separately given their different outcomes.
During the study period, the overall number of daily admissions did not increase substantially. However, the proportion of admissions that were related to COVID-19 increased substantially in late March and early April, with a fall in non-COVID-19 admissions, as previously documented.27 This has implications for planning for future COVID-19 peaks. Another important finding was the high mortality in patients without COVID-19, an over twofold increase from mortality in the previous year (2.4% compared with 6.4%).28 While we were unable to describe the causes of death among these patients, the increased mortality may result from late presentation to hospital due to national government-mandated ‘lockdown’ COVID-19 control measures and fear of nosocomial transmission risk. This has been previously documented in patients with paediatric, cardiology and oncology-related issues but not among acute medical admissions.28 29
This study has several strengths. The cohort is in a large acute hospital trust with two sites covering a diverse population, and all consecutive medical admissions were included. This is one of the first large cohorts to report data on unselected acute medical admissions, and one of the largest cohorts of patients with RT-PCR-negative results with COVID-19. There are also several limitations. The retrospective nature of the study has inherent limitations, including missing data. Although we included consecutive admitted patients, not all patients had SARS-CoV-2 testing, and two different RT-PCR assays were used, which may have slightly different primer targets and analytical sensitivities and may impact the generalisability. The decision to repeat tests on patients with negative RT-PCR results was made by the responsible clinical team. The absence of serology or other confirmatory testing introduces a risk of misclassification bias and RT-PCR inclusion in the reference standard, and the influence of variables including in the diagnostic risk score on clinical diagnosis of COVID-19 introduces incorporation bias. However, there remains no perfect reference standard for COVID-19 diagnosis and these biases are unlikely to significantly impact our findings. Our diagnostic risk model needs external validation, only has moderate discrimination, and is at risk of overfitting. Systematic reviews have struggled to identify other diagnostic clinical scores with high discrimination, and effective patient management is likely to involve a combination of clinical features, radiology and rapid PCR testing.11
In conclusion, we demonstrate that RT-PCR-negative COVID-19 is common among patients admitted to hospital and is associated with a better outcome despite similar severity at presentation. We derived and internally validated a diagnostic risk score with potential utility to help triage patients admitted from the emergency department, although prospective trials of different approaches are warranted in future peaks of COVID-19.
Supplemental material
Acknowledgments
The authors would like to acknowledge all staff at London North West University Healthcare Trust who were involved in the care of patients during the study period, staff supporting the provision of clinical care, and all patients and their families.
References
Supplementary materials
Supplementary Data
This web only file has been produced by the BMJ Publishing Group from an electronic file supplied by the author(s) and has not been edited for content.
Footnotes
Twitter @ankurgw
AG-W and CKM contributed equally.
Contributors AG-W, CKM, TC, VP, GS, RT, NV, SD, AW, AM, MH and PP made substantial contribution to the conception of the work. AG-W, CKM, AW, AM and PP made substantial contribution to the design of the work. AG-W, CKM, JB, SF, GS, JT, NG, HC, MH contributed to data acquisition. AG-W and CKM analysed the data. AG-W, CKM, AW, AM, PP contributed to data interpretation. AG-W and CKM drafted the manuscript. All authors contributed to revising the manuscript critically for important intellectual content, approved the final manuscript and are accountable for all aspects of the work.
Funding The authors have not declared a specific grant for this research from any funding agency in the public, commercial or not-for-profit sectors.
Competing interests None declared.
Patient and public involvement statement Due to the retrospective nature of this study, undertaken during the COVID-19 pandemic, patients or the public were not involved in the design, or conduct, or reporting, or dissemination plans of our research.
Patient consent for publication Not required.
Provenance and peer review Not commissioned; externally peer reviewed.
Data availability statement Data are available upon reasonable request, subject to approval by the London North West University Healthcare NHS Trust Research and Governance Department and approval from relevant ethics and regulatory bodies.
Supplemental material This content has been supplied by the author(s). It has not been vetted by BMJ Publishing Group Limited (BMJ) and may not have been peer-reviewed. Any opinions or recommendations discussed are solely those of the author(s) and are not endorsed by BMJ. BMJ disclaims all liability and responsibility arising from any reliance placed on the content. Where the content includes any translated material, BMJ does not warrant the accuracy and reliability of the translations (including but not limited to local regulations, clinical guidelines, terminology, drug names and drug dosages), and is not responsible for any error and/or omissions arising from translation and adaptation or otherwise.