Article Text

Abstract
Background COVID-19 has caused a global public health crisis affecting most countries, including Ethiopia, in various ways. This study maps the vulnerability to infection, case severity and likelihood of death from COVID-19 in Ethiopia.
Methods Thirty-eight potential indicators of vulnerability to COVID-19 infection, case severity and likelihood of death, identified based on a literature review and the availability of nationally representative data at a low geographic scale, were assembled from multiple sources for geospatial analysis. Geospatial analysis techniques were applied to produce maps showing the vulnerability to infection, case severity and likelihood of death in Ethiopia at a spatial resolution of 1 km×1 km.
Results This study showed that vulnerability to COVID-19 infection is likely to be high across most parts of Ethiopia, particularly in the Somali, Afar, Amhara, Oromia and Tigray regions. The number of severe cases of COVID-19 infection requiring hospitalisation and intensive care unit admission is likely to be high across Amhara, most parts of Oromia and some parts of the Southern Nations, Nationalities and Peoples’ Region. The risk of COVID-19-related death is high in the country’s border regions, where public health preparedness for responding to COVID-19 is limited.
Conclusion This study revealed geographical differences in vulnerability to infection, case severity and likelihood of death from COVID-19 in Ethiopia. The study offers maps that can guide the targeted interventions necessary to contain the spread of COVID-19 in Ethiopia.
- epidemiology
- public health
- public health
This is an open access article distributed in accordance with the Creative Commons Attribution Non Commercial (CC BY-NC 4.0) license, which permits others to distribute, remix, adapt, build upon this work non-commercially, and license their derivative works on different terms, provided the original work is properly cited, appropriate credit is given, any changes made indicated, and the use is non-commercial. See: http://creativecommons.org/licenses/by-nc/4.0/.
Statistics from Altmetric.com
Strengths and limitations of this study
This is the first study that maps vulnerability to COVID-19 infection, severe cases and associated death in Ethiopia at a high level of resolution across the entire territory of Ethiopia.
This is also the first study that has attempted to present the degree of service preparedness for COVID-19 across the country.
The study incorporated a wide range of indicators from multiple sources and applied rigorous geospatial techniques to provide the best possible prediction maps.
However, some important indicators such as psychosocial and clinical factors were not captured in our modelling due to the lack of geocoded data.
Introduction
COVID-19 has become one of the most serious global public health crises in modern times.1 The disease was declared a pandemic on 11 March 2020 and has currently affected more than 216 countries and territories.2 As of 3 August 2020, there were more than 17.6 million confirmed COVID-19 cases and over 680 000 associated deaths around the globe.3 The highest numbers of cases and deaths have been reported from the USA, Brazil, India and some European countries, such as Russia, the UK, Italy and Spain.3 African countries, including Ethiopia, have reported a low number of COVID-19, although the number of cases and deaths are currently on the rise.4 In Ethiopia, the first case of COVID-19 was reported on 13 March 2020 in Addis Ababa, but at the time of this study almost all regions of the country were affected by COVID-19 at different magnitudes.5 However, the number of cases in Ethiopia is still very low due to limited testing capacity and delays in reporting confirmed cases.
Multiple factors, such as sociodemographic, connectivity, behavioural, climatic and comorbidity factors, are strong predictors of the differences in transmission, hospitalisation and mortality rates among and within countries.6 7 Studies conducted in Africa have provided limited information on the vulnerability of different areas to COVID-19 infection.4 8 These studies have been conducted at the country level using a limited number of indicators.4 8 Mapping the risks of COVID-19 (infection, case severity, service preparedness and death) at the lowest administrative unit, such as the district, is important in many ways. First, the generated evidence can help the government and community better prepare and respond to the health-related and non-health-related impacts of COVID-19 according to their contextual circumstances. Second, it can help the relevant bodies determine effective and efficient resource-mobilisation efforts, such as providing training for healthcare workers, supplying hospitals with necessary equipment, prioritising testing practices and distributing hand sanitiser and protective facemasks. Third, the information can be used as a guide for designing targeted travel restrictions or applying full or partial lockdowns as needed. Fourth, the evidence can stimulate further study on COVID-19 in the country.
Given Ethiopia’s large population size, variation in resources and vast geographic size, the risk of COVID-19 infection, case severity and likelihood of death are likely to differ across regions, zones and districts, suggesting that local and context-specific interventions be implemented. Therefore, this study aimed to map the vulnerability to infection, case severity and likelihood of death from COVID-19 in Ethiopia using rigorous state-of-the-art geospatial techniques.
Methods
Study area
This study focused on Ethiopia, the second-most populous country in Africa, with an estimated population size of more than 115 million.9 Ethiopia has a total area of approximately 1.1 million square kilometres, making it the 10th largest country in Africa and the 27th largest in the world. The country has a tiered administrative system consisting of regional states (first level), zones (second level), woredas or districts (third level), and kebeles or neighbourhoods (fourth level).10 There are nine administrative regional states in Ethiopia, including Tigray, Afar, Amhara, Oromia, Somali, Benishangul-Gumuz, Harari, Gambella, and the Southern Nations, Nationalities, and Peoples’ Region (SNNPR), and two administrative cities (Addis Ababa and Diredawa). Four of these regional states (namely, Afar, Somali, Benishangul-Gumuz and Gambella) are relatively less developed, and categorised as developing regional states. They lag behind the rest of the country in all indicators related to human development and disease prevention and control programmes. The administrative units of Ethiopia (shapefiles) were obtained from the Database for Global Administrative Areas.11
Data sources and variable selection
The data for this study were assembled from multiple sources (table 1). Potential indicators were selected based on evidence of association with COVID-19 infection, case severity and death based on a literature review and the availability of country-wide representative data at a district geographic scale or lower (figure 1). Table 2 presents the evidence for the association between indicators and COVID-19, as well as the rationale for selecting these indicators for the study.
Data sources and definitions of indicators for the vulnerability of COVID-19 in Ethiopia
Evidence for risk of COVID-19 infection, severity and death

Indicators for the vulnerability of COVID-19 infection, severity, service, preparedness and related death. CVD, cardiovascular disease prevalence; DM, diabetes mellitus; ICU, intensive care unit; TB, tuberculosis.
The following area-level demographic and socioeconomic indicators were used as indicators of COVID-19 infection and case severity: the average number of persons per household, the proportion of the population aged ≥65 years, the proportion of males and the number of households in the lowest wealth quintile. All of these socioeconomic and demographic indicators were obtained from the latest Ethiopia Demographic and Health Survey (EDHS).12 A map showing the distribution of EDHS datapoints are available as online supplemental figure 1. Population density, estimated as the number of people per grid, was obtained from WorldPop.13
Supplemental material
Connectivity indicators, which measure the population-level vulnerability to infection, were also captured using distance and time-bounded markers. Specifically, average travel time (measured in minutes) to the nearest city and proximity to international borders (measured in kilometres) were included to measure each area’s level of susceptibility to infection. Data on travel time to the nearest city, obtained from the University of Oxford’s Malaria Atlas Project (MAP), were used to quantify the accessibility of an area to high-density urban centres at a resolution of 1 km×1 km.14 Data on proximity to international borders were obtained from the EDHS spatial data repository and were used to measure15 the geodesic distance to the nearest international border in kilometres, indicating the risk of cross-border transmission and the spread of COVID-19. Infection rates and the spread of COVID-19 were also positively correlated with the per capita public transportation use rate.16 Thus, to determine the nearest cross-country road to each location on the map, we obtained and applied data for major roads from the World Bank.17
It is evident that inadequate knowledge about COVID-19 and a lack of awareness of prevention measures exacerbate community transmission of the disease.18 Therefore, we extracted data on adult literacy rate, access to media (such as radio, television and mobile phone messages) and knowledge about other infectious diseases (eg, HIV) from the EDHS as proxies for knowledge of COVID-19 prevention measures in each area of the country.12 According to the WHO, maintaining good hand hygiene through regular washing with soap and water is one of the most effective preventative measures for reducing the transmission of COVID-19.19 20 Using the same data as above, we also assessed hand hygiene practices, access to water and the availability of handwashing stations in a household.
Previous studies have shown that underlying chronic comorbidities and behavioural factors such as cigarette, alcohol and khat consumption were associated with more severe COVID-19 infections.21 22 Data on khat chewing and the alcohol consumption rate were obtained from the EDHS 2016,12 and data on cigarette smoking were obtained from the Ethiopia Public Health Institute Stepwise approach to Surveillance (STEPS) study.23 The STEP survey was also used to measure the prevalence of selected non-communicable diseases (NCDs) such as hypertension, heart disease and diabetes mellitus (DM).
The level of preparedness and readiness of health facilities to detect, manage and control the COVID-19 pandemic at a given location was measured using data from the Service Availability and Readiness Assessment (SARA) survey.24 For each geolocation, the obtained measures include the availability and readiness of facilities in terms of basic amenities and equipment, standard precautions, diagnostic capacities and essential medicines. In addition, data on service readiness for specific diseases such as DM, chronic respiratory disease (CRD) and tuberculosis (TB), as well as the availability of intensive care units (ICUs) and laboratory facilities, were obtained from this same survey. To augment the health facility data, we extracted population-level indicators on healthcare access and barriers to care from EDHS 2016.12
Finally, climatic data (temperature, precipitation, humidity and sunlight exposure) were obtained from the WorldClim V.2.0 Global Climate Database.25 These data were extracted at a spatial resolution of 30 s or ~1 km2 and were considered indicators of COVID-19 infection in this study.
Geospatial data processing
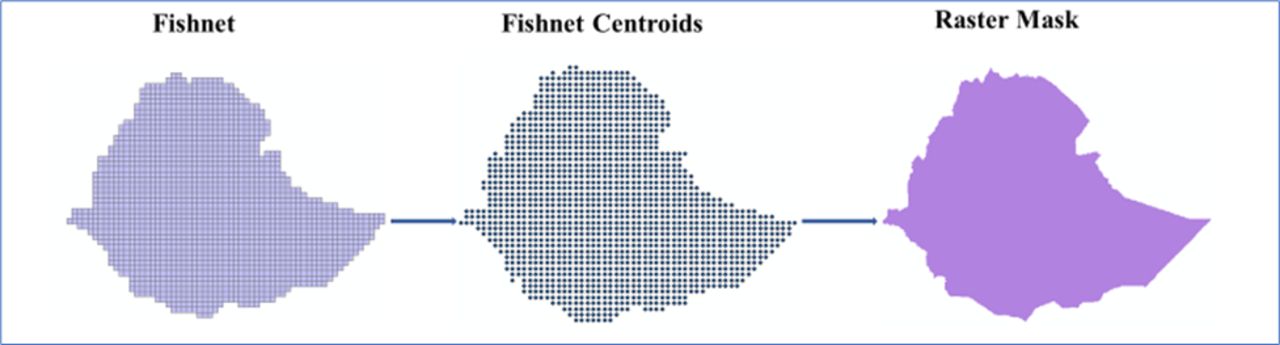
All data were georeferenced using a geographical information system, ArcGIS V.10.6.1 software (ESRI, Redlands, California, USA). The ideal resolution for spatial analysis was a latitude and longitude point that represented the location of the data cluster (point-level data), but when these were not available, we geolocated the available data to the smallest geographical areal unit, typically representing an administrative unit such as village or districts. In instances when the latitude and longitude coordinates of the village or district were not available in the dataset, centroids of the village or districts were also identified using Google Maps. A very small rectangular polygon (fishnet) with its centroid (fishnet centroid) covering the whole territory of Ethiopia was created using a sampling tool under the data management tools in the ArcToolbox (figure 2). The fishnet centroid contained a unique identification number and was used as a common georeferenced system to process, join and extract the raster and vector data collected from various sources. All vector data (point, polygon and line) were converted to raster data using geostatistical methods.26 Raster grids were then resampled to the common georeferenced system at a spatial resolution of 1 km×1 km. Finally, a raster mask covering the entire country was created by clipping smaller spatial units from a large global raster data source.

Rectangular polygon (fishnet), fishnet centroids and raster mask covering the whole territory of Ethiopia.
Statistical analyses
Geostatistical techniques such as spatial autocorrelation, kriging and semivariograms were applied to create a prediction grid surface from a scattered set of points.27 Kriging assumes that the distance or direction between sample points reflects a spatial correlation that can be used to explain variation in the surface.28 Since the variables had different units of measurement, the datasets were normalised using a min-max approach to a standard scale ranging from 0 (the lowest risk) to 100 (the highest risk).29 After normalisation, the indicators were averaged to create a vulnerability index, measuring the risk of COVID-19 for each geolocation.30 The vulnerability indices were calculated separately for each domain, namely, the vulnerability to infection, case severity and likelihood of death from COVID-19. The three domains were then averaged to produce the overall COVID-19 vulnerability index. Given that COVID-19 is a new virus, there is a lack of evidence for assigning weights for each indicator. Hence, equal weight was given to all indicators when calculating the arithmetic mean for the vulnerability indices. However, we also used principal component analysis (PCA) and geometric mean methods, which produced broadly similar results (online supplemental figures 2 and 3). The risk maps were then created separately for infection, case severity, service preparedness and death from the composite index using geostatistical tools in ArcGIS. All data transformations were performed in R.31 All items included in this study are available in the STROBE (Strengthening the Reporting of Observational Studies in Epidemiology) Statement checklist (online supplemental table 1).
Results
Vulnerability to COVID-19 infection
Figure 3 shows the vulnerability map of COVID-19 infection in Ethiopia. The map highlights that most parts of the country are likely to have a relatively high vulnerability and be at substantial risk for COVID-19 infection. Most parts of the country are identified as vulnerable to COVID-19 infection, with the exception of Addis Ababa and the north-western Somali region. The peripheral areas of the country bordering Djibouti, Somalia, Eritrea and South Sudan appeared to be vulnerable to COVID-19 infection. These outlying areas are characterised by a low level of geographical connectivity and low scores for disease knowledge, hand hygiene and socioeconomic indices (online supplemental figure 4). They also have certain climatic factors that were found to be important indicators of COVID-19 transmission.

Vulnerability map to COVID-19 infection in Ethiopia.
Vulnerability to severe cases of COVID-19 infection
Areas across the Amhara region and most parts of the Oromia region are likely to experience severe forms of COVID-19 that require hospitalisation and ICU admission. Some parts of the SNNPR are also expected to be at high risk of severe COVID-19 infections. The combination of demographic (high proportion of older adults), comorbidity (high prevalence of hypertension, DM, obesity, HIV and TB), and behavioural and economic indicators (high proportion of smokers and high level of alcohol and khat consumption, interior cooking and solid fuel use) renders these parts of the country at a higher risk of severe forms of COVID-19. Figure 4 shows the levels of vulnerability to severe forms of COVID-19.

Vulnerability map to COVID-19 severity in Ethiopia.
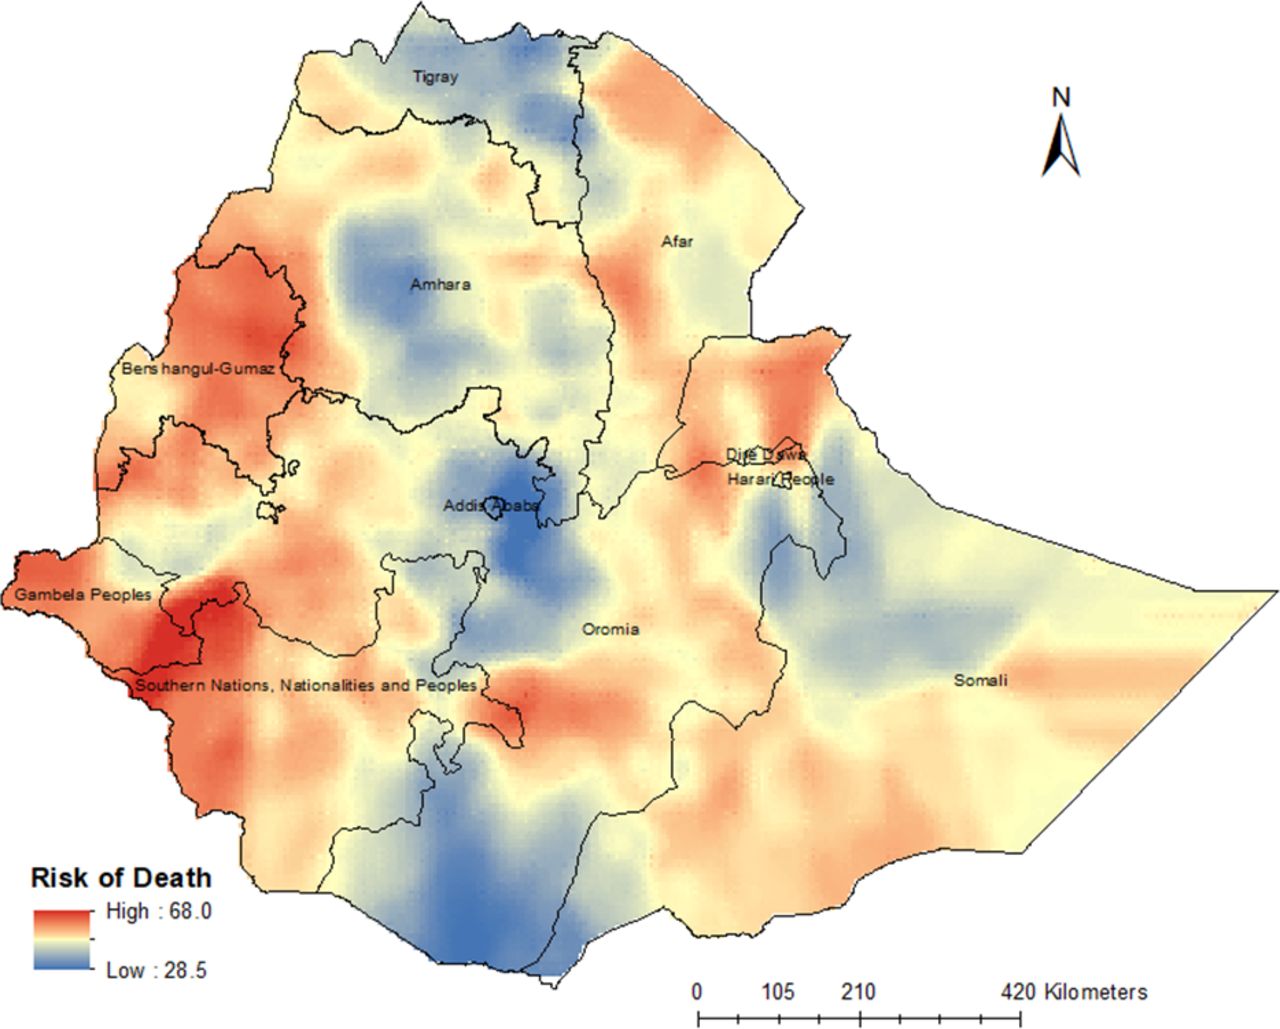
Vulnerability to death from COVID-19
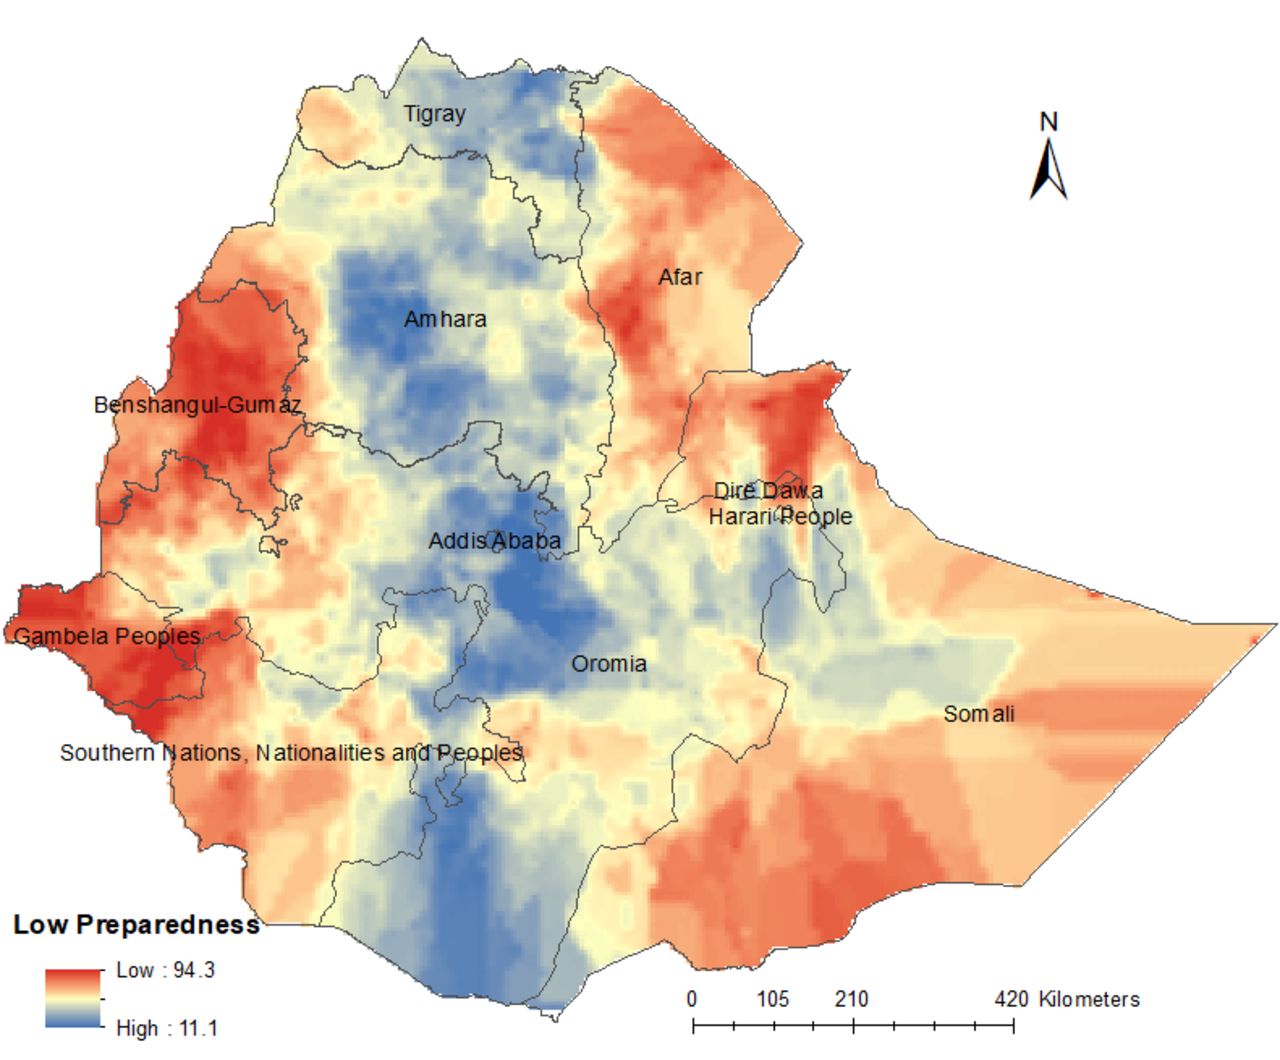
People living around border areas in Ethiopia are at a high risk for COVID-19-related death, as illustrated in figure 5. Districts and zones in the Benishangul-Gumuz, Gambela, Afar, SNNPR, Dire Dawa, Southwest Somali, Northwest Amhara, Western Tigray, and Western and Eastern Oromia regions are at high risk for COVID-19-related death. The level of service preparedness and readiness to mitigate the health effects of COVID-19 appears to be very low in these regions (figure 6). Ethiopia’s border regions have inadequate ICU availability and laboratory capacity as well as limited healthcare access. They also have low general and service-specific readiness, as shown in figure 6.

Vulnerability map to death from COVID-19 in Ethiopia.

Vulnerability map to service preparedness for COVID-19 in Ethiopia.
Discussion
This is the first study that maps vulnerability to COVID-19 infection, severe cases and associated death in Ethiopia at a high resolution. This is also the first study that has attempted to present the degree of service preparedness for COVID-19 across the country.
We found that most parts of the country are vulnerable to COVID-19 infections, and the greatest burden might be outside of Addis Ababa. It is likely that compared with other regions, a higher proportion of people from the Amhara and Oromia regions, the two most populous regions of the country, will develop severe forms of COVID-19 leading to hospitalisation and ICU admission. Border areas of the country are also expected to face a higher risk of death than areas located in the central regions. The findings of this study are of paramount importance in preventing and controlling COVID-19 transmission and in designing targeted interventions, such as enacting travel restrictions, distributing preventative masks and determining which areas to prioritise if a COVID-19 vaccine becomes available. As some of these areas also have lower preparedness scores and low general and service-specific readiness scores, the findings have wider implications for allocating resources and strengthening the healthcare system after the COVID-19 pandemic.
Despite the disproportionately high infection rate in Addis Ababa at present (online supplemental figure 5), we found that the risk of COVID-19 infection is likely to become rather high in other regions. The high infection rate in Addis Ababa at this initial stage is expected, given that Addis Ababa is a major travel hub and Bole International Airport, located in the city, is one of the largest international airports in Africa. This exposes the city to a higher risk of imported cases and, subsequently, to an early surge of infections, leaving the areas outside the city at a higher risk of later infection. Second, we considered multifaceted risk factors (indicators) for COVID-19 infection in our geospatial model. This means that although the city has a high degree of connectivity, it is also characterised by higher scores for information penetration, knowledge of disease prevention and hand hygiene practices that could help slow the rate of infection in the city.12 Third, Addis Ababa has relatively better and more consistent test-and-contact tracing practices than in other parts of the country, which means that the chance of new infections being detected in the city are much greater than in other parts of the country.5 Future efforts to expand testing and tracing practices in other areas of the county are likely to increase the extent of confirmed infections in those other areas. Recent studies have demonstrated that effective social distancing and contact tracing can significantly reduce the rate of infection.32 33 These interventions should be strengthened and expanded to areas identified as high risk in this study.
Our study also showed that the risk for severe cases of COVID-19 infection is high in most parts of the Amhara and Oromia regions. This may be due to the high prevalence of NCDs, which are associated with severe cases of COVID-19. Previous studies have revealed that the burden of NCDs, such as DM and hypertension, is high in these two regions.23 34 35
Our study also revealed that peripheral areas sharing international borders are likely to see a greater number of COVID-19-related deaths. The high risk of death along the border areas might be attributed to low preparedness in case management and weak healthcare systems. In contrast, although the Amhara and Oromia regions may have more severe cases, the preparedness indicators show that the regions are better equipped to cope with these anticipated severe cases. However, our study suggests that additional preparation and capacity strengthening are needed mainly in the following areas: emergency response systems, case detection and capacity to care for patients. It is also equally important that hospitals have adequate supplies, healthcare personnel and life-saving medical intervention resources. Despite encouraging efforts by the Ethiopian government and stakeholders to prepare the healthcare system for the pandemic, the existing healthcare services in the country may face unprecedented challenges and crises due to the surge of patients that will require hospitalisation and ICU services at the same time. This can, however, be eased by implementing public health and social measures at the individual, community and public authority levels to prevent infections and subsequent health, economic and social consequences.36 Studies have shown that implementing non-pharmaceutical interventions such as physical distancing, mask use and closure of schools, especially during the early stages of infection, can reduce transmission and subsequent potential public health and economic crises.37
Further, we found notable regional disparities in health system preparedness and readiness levels in the country. This is important because if the healthcare system is well equipped to prevent and mitigate the spread of the pandemic, then the mortality rate from the disease can be markedly reduced.38 However, we observed that Ethiopia’s border regions (ie, Benishangul-Gumuz, Gambella, Afar and Somali) have low preparedness levels. Nevertheless, comparisons between the border regions and other regions of the country need to be treated with care because Ethiopia in general has very low doctor-to-resident (1 doctor per 10 000 people) and hospital bed-to-population (3 hospital beds per 10 000 people) ratios.39 Several long-term, medium-term and short-term strategies can be implemented to mitigate these problems: (1) providing short-term training for potential actors such as community leaders, students, and traditional and modern medical practitioners; (2) recruiting additional staff to work in COVID-19-related healthcare; (3) establishing COVID-19 clinics and changing outpatient rooms to emergency clinics; (4) collaborating with private hospitals ahead of surges so that they can be used in the case such surges occur; and (5) establishing mobile clinics and temporary admission rooms in highly vulnerable areas.
Strength and limitations
This study has several strengths. First, the current study was conducted at a spatial resolution of 1 km×1 km across the entire territory of Ethiopia. Second, it incorporated a wide range of indicators from multiple sources. Third, it applied rigorous geospatial techniques, including spatial autocorrelation, kriging and semivariograms, to provide the best possible prediction maps. Finally, we produced vulnerability mapping for infection or transmission, case severity and associated death separately to assist with policy interventions related to each risk.
However, it is important to note some potential limitations of the study when interpreting the findings. First, the results need constant updating, as some of the variables used in the study may change overtime. Second, the data used in this study were not collected in the same year and the results might be changed if recently available data were used in the analysis. However, many of the variables used in this study were static and may not change over time. Moreover, we used the most recently available data for non-static variables such as EDHS data. Third, ongoing political turmoil in the country means that the dynamics of transmission may change depending on the location and severity of these incidents. For example, in areas of low security resulting from active conflict, the local health systems might be ill-prepared to prevent and control COVID-19. Insecurity also may generate unpredictable population movements, and this in turn could exacerbate infection dynamics in the country. Fourth, the calculation of the composite risk factor index was based on an unweighted average under the assumption that all indicators have equal importance, which may or may not be the case. Some of the variables included in our score may have greater effects on vulnerability to infection, case severity and likelihood of death than others. Giving equal weight for all these variables may influence the findings of our study, but the exact effect is hard to tell. However, we have calculated a weighted index using PCA as an alternative method, which produced broadly similar results (online supplemental figures 2 and 3). Lastly, some important indicators, such as psychosocial and clinical factors (eg, mental illness, quality of life and social support), were not captured in our modelling due to the lack of geocoded data.
Conclusions
Although nearly three-quarters of the current COVID-19 cases reported in Ethiopia are concentrated in and around Addis Ababa, this study predicts that over time, the risk of COVID-19 infection will be higher across most other parts of the country. A higher proportion of people from the Amhara region, most of the Oromia region and some parts of the SNNPR will develop severe cases of infection. Additionally, the risk of death will be higher in the regions of the country with low preparedness scores for COVID-19 response. Hence, the preventative and control measures that are currently in place in the capital city should be strengthened and extended to regional areas, especially to high-risk areas, to prevent and mitigate the risk of COVID-19 infection, lower the number of severe cases and limit the number of associated deaths in Ethiopia.
References
Supplementary materials
Supplementary Data
This web only file has been produced by the BMJ Publishing Group from an electronic file supplied by the author(s) and has not been edited for content.
Supplementary Data
This web only file has been produced by the BMJ Publishing Group from an electronic file supplied by the author(s) and has not been edited for content.
Supplementary Data
This web only file has been produced by the BMJ Publishing Group from an electronic file supplied by the author(s) and has not been edited for content.
Footnotes
Twitter @Gesesew, @Azebdej, @FisahaHaile
YAG and YK contributed equally.
Contributors KAA, YAG, YK, DMF, DNK, YAM, HG, MMB, MDM, AAAd, and BAD conceptualised the study. KAA designed and run the geospatial analysis. YAG involved in the data analysis. KAA, YAM, DMF, DNK, and YAG drafted the manuscript. HG, MMB, AAAd, MDM, BAD, SA, AA, AAAy, WMB, KTG, TG, ATG, LG, ABG, HTK, GDK, CTL, LBM, AHM, HM, HGT, AGT, FHT, BLW, and YK Critically reviewed and revised the drafted manuscript. KAA, YK, and AHM were responsible for quality control of accuracy and integrity of data. All the authors interpreted the data. All authors contributed to the final draft and finally approved it to be published. All authors agreed to be accountable for all aspects of the work for any issue related to the accuracy or integrity of any part of the work. The corresponding author attests that all listed authors meet authorship criteria and that no others meeting the criteria have been omitted.
Funding The authors have not declared a specific grant for this research from any funding agency in the public, commercial or not-for-profit sectors.
Map disclaimer The depiction of boundaries on this map does not imply the expression of any opinion whatsoever on the part of BMJ (or any member of its group) concerning the legal status of any country, territory, jurisdiction or area or of its authorities. This map is provided without any warranty of any kind, either express or implied.
Competing interests None declared.
Patient consent for publication Not required.
Provenance and peer review Not commissioned; externally peer reviewed.
Data availability statement All data relevant to the study are included in the article or uploaded as supplementary information. Extra data is available by emailing the corresponding author (KAA): kefyalew.alene@curtin.edu.au.
Supplemental material This content has been supplied by the author(s). It has not been vetted by BMJ Publishing Group Limited (BMJ) and may not have been peer-reviewed. Any opinions or recommendations discussed are solely those of the author(s) and are not endorsed by BMJ. BMJ disclaims all liability and responsibility arising from any reliance placed on the content. Where the content includes any translated material, BMJ does not warrant the accuracy and reliability of the translations (including but not limited to local regulations, clinical guidelines, terminology, drug names and drug dosages), and is not responsible for any error and/or omissions arising from translation and adaptation or otherwise.