Article Text

Abstract
Objective Quantify income-based inequalities in self-reported moderate-to-vigorous physical activity (MVPA) in England and the USA by sex.
Design Population-based cross-sectional study.
Participants 4019 adolescents aged 11–15 years in England (Health Survey for England 2008, 2012, 2015) and 4312 aged 12–17 years in the US (National Health and Nutrition Examination Survey 2007–2016).
Main outcome measures Three aspects of MVPA: (1) doing any, (2) average min/day (MVPA: including those who did none) and (3) average min/day conditional on participation (MVPA active). Using hurdle models, inequalities were quantified using the absolute difference in marginal means (average marginal effects).
Results In England, adolescents in high-income households were more likely than those in low-income households to have done any formal sports/exercise in the last 7 days (boys: 11%; 95% CI 4% to 17%; girls: 13%; 95% CI 6% to 20%); girls in high-income households did more than their low-income counterparts (MVPA: 6 min/day, 95% CI 2 to 9). Girls in low-income households spent more time in informal activities than girls in high-income households (MVPA: 21 min/day; 95% CI 10 to 33), while boys in low-income versus high-income households spent longer in active travel (MVPA: 21 min/week; 95% CI 8 to 34). In the USA, in a typical week, recreational activity was greater among high-income versus low-income households (boys: 15 min/day; 95% CI 6 to 24; girls: 19 min/day; 95% CI 12 to 27). In contrast, adolescents in low-income versus high-income households were more likely to travel actively (boys: 11%; 95% CI 3% to 19%; girls: 10%; 95% CI 3% to 17%) and do more.
Conclusions Policy actions and interventions are required to increase MVPA across all income groups in England and the USA. Differences in formal sports/exercise (England) and recreational (USA) activities suggest that additional efforts are required to reduce inequalities.
- epidemiology
- preventive medicine
- public health
This is an open access article distributed in accordance with the Creative Commons Attribution Non Commercial (CC BY-NC 4.0) license, which permits others to distribute, remix, adapt, build upon this work non-commercially, and license their derivative works on different terms, provided the original work is properly cited, appropriate credit is given, any changes made indicated, and the use is non-commercial. See: http://creativecommons.org/licenses/by-nc/4.0/.
Statistics from Altmetric.com
Strengths and limitations of this study
In contrast to single-equation regression modelling, hurdle models are well suited to analysing quantitative variables such as time spent in moderate-to-vigorous physical activity (MVPA) as separate models are estimated for participation and the amount of time spent active (conditional on crossing the ‘hurdle’ of participation).
This study applies hurdle models to nationally representative data from England and the USA to estimate inequalities in both aspects of MVPA among adolescents.
Self-reported data on physical activity may contain recall and reporting (social desirability) bias.
Causal inferences cannot be drawn, as this was a descriptive study based on cross-sectional data.
Introduction
Being physically active benefits mental, physical and social health in a dose-response manner,1 and is beneficial for higher academic achievement,2 yet global data for 2016 show that more than 80% of school-going adolescents aged 11–17 years did not meet the WHO’s daily minimum recommendation of 1 hour of moderate-to vigorous-intensity physical activity (MVPA).3 Socioeconomic inequalities in adolescent PA is an additional national and international concern4: evidence suggests these are domain-specific, with levels of self-reported activity in sports especially higher among the most advantaged.5 In addition, lower levels of PA among adolescent girls is well documented.3 Recent evidence also suggests possible sex-specific heterogeneity in inequalities; for example, analysis of data from the US National Health and Nutrition Examination Survey (NHANES 2007–2016) by Armstrong et al6 found lower levels of recreational MVPA (among those reporting any) in lower-income families among girls aged 12–17 years, but no association was noted among boys of the same age.6
No single factor explains the differences in levels of adolescent PA across various indicators of socioeconomic position (SEP).7 Previous literature has highlighted numerous pathways through which different, but related, aspects of SEP may impact on adolescent PA. First, the financial costs of taking part in formal, structured PA (eg, membership fees, sports equipment and travel) can act as a barrier to the active involvement of adolescents living in low-income households.7 8 Second, reduced opportunities for PA through lower access to available, affordable and safe recreational facilities represent built environmental barriers for adolescents living in more deprived areas.9 Third, lower levels of parental education may also act as a barrier among adolescents in disadvantaged families through lower knowledge of the positive health benefits of PA.7
While enabling assessment against PA recommendations, grouping a quantitative variable such as the minutes-per-day (min/day) that adolescents typically spend engaged in MVPA into a binary or ordinal variable loses information and weakens statistical power.10 Yet analysing the quantitative variable is also problematic as MVPA distributions are not typically normally distributed but contain a stack of zeros (adolescents not doing any) and are positively skewed (high values for a small number who are highly active).11 Such data can be transformed to meet normality assumptions11 but findings based on a single-equation regression model cannot identify potentially different determinants for participation and volume (ie, the product of frequency and duration).12
Hurdle models can handle quantitative MVPA data that contains a stack of zeros and positive skewness, as separate models can be fitted for the binary outcome of participation and the quantitative outcome of the amount of time spent active (conditional on crossing the ‘hurdle’ of participation). Hurdle models have become the standard approach in the health economics literature to modelling dependent variables with excessive zeros and many positive values; for example, the study by Deb and Norton13 applied hurdle models to the outcome of the number of emergency department visits, finding differences between treatment and control groups in the probability of going to the emergency department, but no difference in the number of visits for the minority who ever visited.13 In epidemiology, hurdle models have been applied to identify the correlates associated with the decision to engage in ‘risky’ health behaviours (eg, cigarette and marijuana use) and the potentially different correlates associated with the quantity consumed among those who consume any.14 While previous studies have applied hurdle models to MVPA data to examine the different correlates of participation and volume,15 16 and also investigate trends over time among adults in Queensland,17 few studies have used hurdle models to estimate inequalities in these different aspects of MVPA.18 Our study is novel as no epidemiological studies to date have used hurdle models to examine inequalities in MVPA among adolescents, yet such models could indicate, for example, whether adolescents living in high-income households are more likely to do any MVPA but, conditional on doing any, spend more or less time on average in MVPA than their counterparts in low-income households.16
Using nationally representative cross-sectional data for adolescents in England and the USA, we applied sex-specific hurdle models to quantify and compare income-based inequalities in self-reported total and domain-specific MVPA. We hypothesised that adolescents in high-income versus low-income households have a higher propensity to do any, and that conditional on taking part, spend more or less time on average being active. We further hypothesised that the pattern and/or magnitude of inequalities differ for boys and girls.
Methods
Data sources and study populations
England
The Health Survey for England (HSE) is used to monitor progress on numerous national health objectives, including PA for younger (aged 2–4 years) and older (5–15 years) children.19–21 Details of sample design and data collection are described elsewhere.22 Briefly, new, nationally representative samples of people living in private households are drawn annually using multistage stratified probability sampling. We used the most recent surveys (2008, 2012, 2015) that included questions on children’s PA.19–21 Up to two children aged 0–15 years were selected at each household in 2008 and 2012; a limit of four was used in 2015 (maximum two aged 13–15 years, interviewed directly and maximum two aged 0–12 years, where a parent/guardian provided the information). Interviewers measured participants’ height and weight and assessed demographics and health behaviours including PA. The household response rate ranged from 64% in 2008 to 60% in 2015.
We restricted the analytical population in this study to adolescents aged 11–15 years; participants aged 16 years or older are treated as adults, and so responded to a different PA questionnaire. Participants gave verbal consent for interview. Relevant national committees granted research ethics approval prior to the surveys.
United States
The NHANES uses a complex, stratified, multistage probability cluster sampling design. Details on sample design and data collection are described elsewhere.23 Briefly, data collection is based on a nationally representative sample covering all ages of the civilian noninstitutionalised population. During 2011–2014, non-Hispanic black, non-Hispanic Asian and Hispanic persons, among other groups, were oversampled. All eligible members within a household were listed and a subsample of persons was selected based on sex, age, race/ethnicity and income.23 Written informed consent was obtained from all participants before participation.
We restricted the analytical population for this study to adolescents aged 12–17 years (less detailed questions are asked of 2–11 year-olds via a parental proxy). As the same PA questionnaire was used, we pooled five 2 year cycles (2007–2008, 2009–2010, 2011–2012, 2013–2014, 2015–2016).
Differences in age range of HSE and NHANES participants
The age range of HSE (11–15 years) and NHANES (12–17 years) participants was not matched in the present study for a number of reasons. First, participants’ age was available only in grouped form in the HSE 2015 dataset (11–12 and 13–15 years), and so we could not use a lower limit of 12 years to match NHANES. Second, we included the 16–17 year-olds in NHANES to increase the precision of estimates (n=836; 34% of the analytical sample). The upper limit of 17 years also matched previous USA6 and worldwide3 studies. However, in HSE, those aged 16–17 years are asked a different set of questions on PA to those administered to children aged 5–15.
Data collection and derivation of PA outcomes
Health Survey for England
Formal and informal activities
Adolescents (or their parents/guardians: hereafter referred to as participants) were asked questions about PA conducted outside school hours in the 7 days prior to the day of interview. Participants were presented with two lists of physical activities: (1) formal activities: 10 specific (eg, individual and team sports/exercise such as football, workout with gym machines) plus up to five ‘other’ activities and (2) informal activities: nine specific activities (eg, cycling excluding to/from school; walking excluding to/from school; active play). For each activity identified, participants were asked to recall on which days they took part; and on each day, how long they spent engaged in that activity (with no specified minimum duration). Each activity was assumed to be at least moderately intensive.
Active travel (should be same level as "formal and informal activities")
Participants who had been to school on at least 1 day in the 7 days prior to interview were asked whether they had walked or cycled all or part of the way to or from school on any of those days (positive responses: walking, cycling or both). If the participants had walked, they were asked: (1) the number of days they walked to school, (2) the number of days they walked from school and (3) how long it usually takes to walk to school (an average was given if the journeys to and from school differed). These questions were repeated for cycling. Each activity was assumed to be at least moderately intensive.
Derivation of outcomes (same level as "formal and informal activities")
Outcomes were domain-specific: formal activities; informal activities and active travel. Due to the difference in questionnaire format (daily assessment for formal and informal activities; weekly for active travel), total MVPA was calculated as the sum of formal and informal activities only. This was truncated at 40 hours/week to minimise unrealistic values. Weekly totals (expressed in minutes) were divided by seven to calculate min/day. Time spent in active travel was obtained by multiplying the number of journeys (to and/or from school) by the usual time spent travelling (expressed as min/week). Those who had not attended school were included in all analyses but were allocated zero time for active travel.24
Prior to its introduction in HSE 2008, the PA questionnaire was tested in a validation study.25 First, the self-reported total time spent in MVPA assessed 1 week apart was found to have almost perfect internal validity (reliability as assessed by the intraclass correlation coefficient (ICC)=0.83 among 127 children aged 4–15 years). Second, in a comparison with accelerometer data, self-reported MVPA showed moderate external validity (ICC=0.56 and 0.27 for boys and girls, respectively).
SEP and confounders (same level as "formal and informal activities")
Household income was our chosen marker of SEP. The household reference person reports annual gross household income via a showcard (31 bands ranging from ‘less than £520’ to ‘£150 000+’). Household income was equivalised (McClements scale26), and grouped into tertiles (lowest, middle, highest). Body mass index (BMI) was calculated from valid weight and height measurements as weight in kilogrammes divided by height in metres squared. Three weight status categories were derived based on age (categorised in 6-month bands) and the sex-specific UK National BMI centiles classification27: healthy weight (a BMI-for-age below the 85th percentile), overweight (85th to below the 95th percentile) and obese (≥95th percentile).
National Health and Nutrition Examination Survey (same level as "Health Survey for England")
Global Physical Activity Questionnaire (same level as "formal and informal")
An adapted version of the Global Physical Activity Questionnaire (GPAQ V2), developed by the WHO,28 was administered directly to 12–15 years old at the Mobile Examination Centre (MEC), and during in-home interviews to 16–17 years old.6 The GPAQ captures aerobic PA in three domains: recreational, active transportation and work (eg, paid or unpaid work, household chores, yard work). For the recreational and work domains, participants are asked whether they do any vigorous-intensity activities (VPA) that ‘cause large increases in breathing or heart rate for at least 10 min continuously’ in a typical week; those answering positively, are asked on how many days in a typical week they do VPA, and for how much time they spend doing VPA on a typical day. Similar questions were asked for moderate-intensity activities: those that ‘cause a small increase in breathing or heart rate’. For active transportation, participants are asked whether they walk or use a bicycle for at least 10 min continuously to get to and from places; those answering positively, are asked on how many days in a typical week they engage in such travel, and for how much time they spend travelling actively on a typical day (walking and bicycling are not assessed separately).
Outcomes were truncated at 40 hours/week to minimise unrealistic values. Total MVPA was calculated as the sum across the three domains. Frequency (number of days/week) and duration (average min/day) were multiplied and then divided by seven to calculate min/day MVPA for total and domain-specific MVPA.11
Previous NHANES studies comparing self-report and accelerometer data among adolescents used data from the 2003–200429 and 2005–2006 cycles,30 which predated the introduction of the GPAQ V2 in 2007–2008. The first version of the GPAQ, which contained the same structure and domain approach as GPAQ V2, was found in a nine-country study of adults aged 18–75 years to show good-to-excellent test–retest reliability (Spearman’s r ranged from 0.67 for total VPA to 0.81 for total transport-related PA) and fair (Spearman’s r=0.31) criterion validity from pooled comparisons with pedometer data for total PA.28 To date, GPAQ V2 has been validated only in adult populations, showing moderate validity and acceptable short-term and long-term reliability,31 but no published studies of its measurement properties have been based on NHANES data.
SEP and confounders (same level as "formal and informal")
Household income was reported by the household reference person. The inflation-adjusted family income-to-poverty ratio (FIPR) is calculated by dividing family income by a poverty measure specific for family size. Larger FIPRs indicate higher income and was categorised as in other studies32 33 as low (<1.3), middle (>1.3 to 3.5) and high (>3.5) (high income). Race/ethnicity was categorised as non-Hispanic white, non-Hispanic black, Mexican-American and other. Three weight status categories were based on the Center for Disease Control and Prevention’s (CDC) sex-specific 2000 BMI-for-age growth charts for the USA33: healthy weight, overweight and obese were defined analogously to that described above for the HSE.
Statistical analysis
Sample characteristics
Data were pooled over the survey years to increase precision. Differences in missing data (PA or income) were estimated by sex, age, race/ethnicity (USA), area deprivation (England), smoking status (whether ever smoked cigarettes) and weight status (online supplemental tables 1 and 2 for England and the USA, respectively). Among the analytical sample, differences in age, race/ethnicity (USA) and weight status were estimated by income, using Rao-Scott tests for independence.34 To address potential bias in the composition of the analytical sample, HSE analyses were weighted using the appropriate selection and non-response weight; NHANES analyses used the combined 2-year MEC sample weights which account for differential probabilities of selection, non-response and differences between the final sample and the US civilian non-institutionalised population.23
Supplemental material
Supplemental material
Hurdle models (same level as sample characteristics)
To handle quantitative MVPA data that contains a stack of zeros and positive skew, we used the Cragg hurdle model,35 which comprises two parts: a selection/participation model and a latent model. The former is used to examine differences in the propensity for the quantitative outcome to take positive values versus zero, while the latter examines differences in the positive, non-zero part of the distribution among those with non-zero values.
Zero-inflated Poisson (ZIP) and hurdle models are suitable for analysing outcomes which contain a large number of zeros. An important factor in choosing between them is the assumed nature of the zero observations.14 ZIP models are suitable for outcomes where the subset of observations with zero values are assumed to come from a combination or mixture of two different latent classes: (1) a group that might contain zero values due to sampling variation; and (2) a group that always contains zero values (ie, structural or ‘genuine’ zeros). In contrast, hurdle models are suitable for outcomes such as min/day MVPA where it is assumed that all zeros are structural (representing a decision not to engage in MVPA), so that the propensity to engage in any MVPA is modelled separately from the amount of time spent in MVPA conditional on having crossed the ‘hurdle’ of participation.
Reflecting the difference in questionnaires, the lowest (observed) value for positive MVPA was 5 min in the last week (ie, 0.7 min/day) in HSE and 10 min in a typical week (ie, 1.4 min/day) in NHANES. In our analyses, the selection model assessed the influence of household income status on the binary outcome of participation (any vs none), while the latent model assessed its influence on the amount of time spent active, conditional on doing any MVPA (hereafter referred to as MVPA active). We specified a probit model for the former and an exponential form for the latter (ie, the natural logarithm of MVPA was modelled by ordinary least squares regression). Log-normal models are preferable to a linear form as the positive part of MVPA distributions is typically highly positively skewed; using a log-transformation obtains normally distributed values, and imposes a positive sign on the fitted values.17 36 Each model contained income (as a three-category variable) and the confounders listed above.
Based on the model estimates, three sets of marginal means by income were calculated, evaluated at fixed values of the confounders. These sets correspond to different definitions of the expected value of MVPA15: (1) the probability of doing any; (2) the average min/day MVPA for all participants (the unconditional mean), including those who did none and (3) the average min/day MVPA conditional on participation (MVPA active). Average marginal effects (AMEs), representing inequalities after adjustment for age,5 6 32 37 weight-status or BMI6 37 and race/ethnicity6 32 37 38 in the USA, were quantified by computing the absolute difference in the marginal means (low-income households as reference).
We conducted sex-stratified analyses to investigate heterogeneity in inequalities, as reported in a recent study among adolescents and youth in the USA.6 We repeated our analysis using untruncated data to investigate whether the truncation of MVPA at 40 hours/week affected our findings.
Dataset preparation and analysis was performed in SPSS V.22.0 (SPSS IBM) and Stata V.15.0 for the HSE; the datasets generated and analysed herein are available via the UK Data Service (http://www.ukdataservice.ac.uk), subject to their end user license agreement.39–41 Stata was used to prepare and analyse NHANES; datasets are publicly available via the CDC website (https://www.cdc.gov/nchs/nhanes). All analyses were performed using the survey procedures to account for the complex survey designs, including the geographical clustering of participants in primary sampling units and probability weights. Two-sided p values <0.05 were considered statistically significant. This manuscript was written according to the Strengthening the Reporting of Observational Studies in Epidemiology statement.
Patient and public involvement
Patients or the public were not involved in the design, or conduct, or reporting, or dissemination plans of our research (which involves secondary analysis of existing data).
Results
Analytical samples
In England, 4897 adolescents aged 11–15 years participated in one of the three surveys (2008, 2012, 2015), of whom 4874 had valid PA data. Of these, 855 had missing income data and were excluded from our complete-case analysis, leaving an analytical sample of 4019 adolescents. In the USA, 4705 adolescents aged 12–17 had valid PA data. Of these, 393 had missing income data and were excluded from our complete-case analysis, leaving an analytical sample of 4312 adolescents.
Online supplemental table 1 (England) and online supplemental table 2 (USA) show the differences in characteristics between adolescents excluded and included in the analytical samples. Compared with those in the analytical sample, adolescents interviewed in the HSE but with missing data on MVPA (n=23) or household income (n=855) were more likely to be older (p=0.019) and to reside in the most deprived areas (p=0.001), but were similar with regards to sex, weight status and smoking status (all p>0.05). Adolescents interviewed in NHANES but without data on MVPA (n=224) or household income (n=393) were more likely than those with complete data to be younger (p<0.001) and belong to a race/ethnic group other than non-Hispanic white (p<0.001), but were similar with regards to sex, weight status and smoking status (all p>0.05).
Sample characteristics
Among the analytical sample, information on key demographics by household income status is presented in table 1. In the USA, the distribution of adolescents by race/ethnicity varied by income (p<0.001 for both sexes); just over one-third of adolescents in low-income households were non-Hispanic white (34% boys; 38% girls) compared with over three-quarters of adolescents in high-income households (78% boys; 77% girls). Weight status varied by income in both countries. In England, 53% of boys and 54% of girls in low-income households were classified as having a healthy weight, compared with 65% of boys and 66% of girls in high-income households (boys: p=0.033; girls: p<0.001). Similarly in the USA, 58% of boys and 54% of girls in low-income households but 67% of boys and 75% of girls in high-income households were classified as having a healthy weight (boys: p=0.033; girls: p<0.001).
Key variables by income tertile and sex, Health Survey for England (2008, 2012, 2015) and National Health and Nutrition Examination Survey (2007–2016) for the USA
MVPA distributions
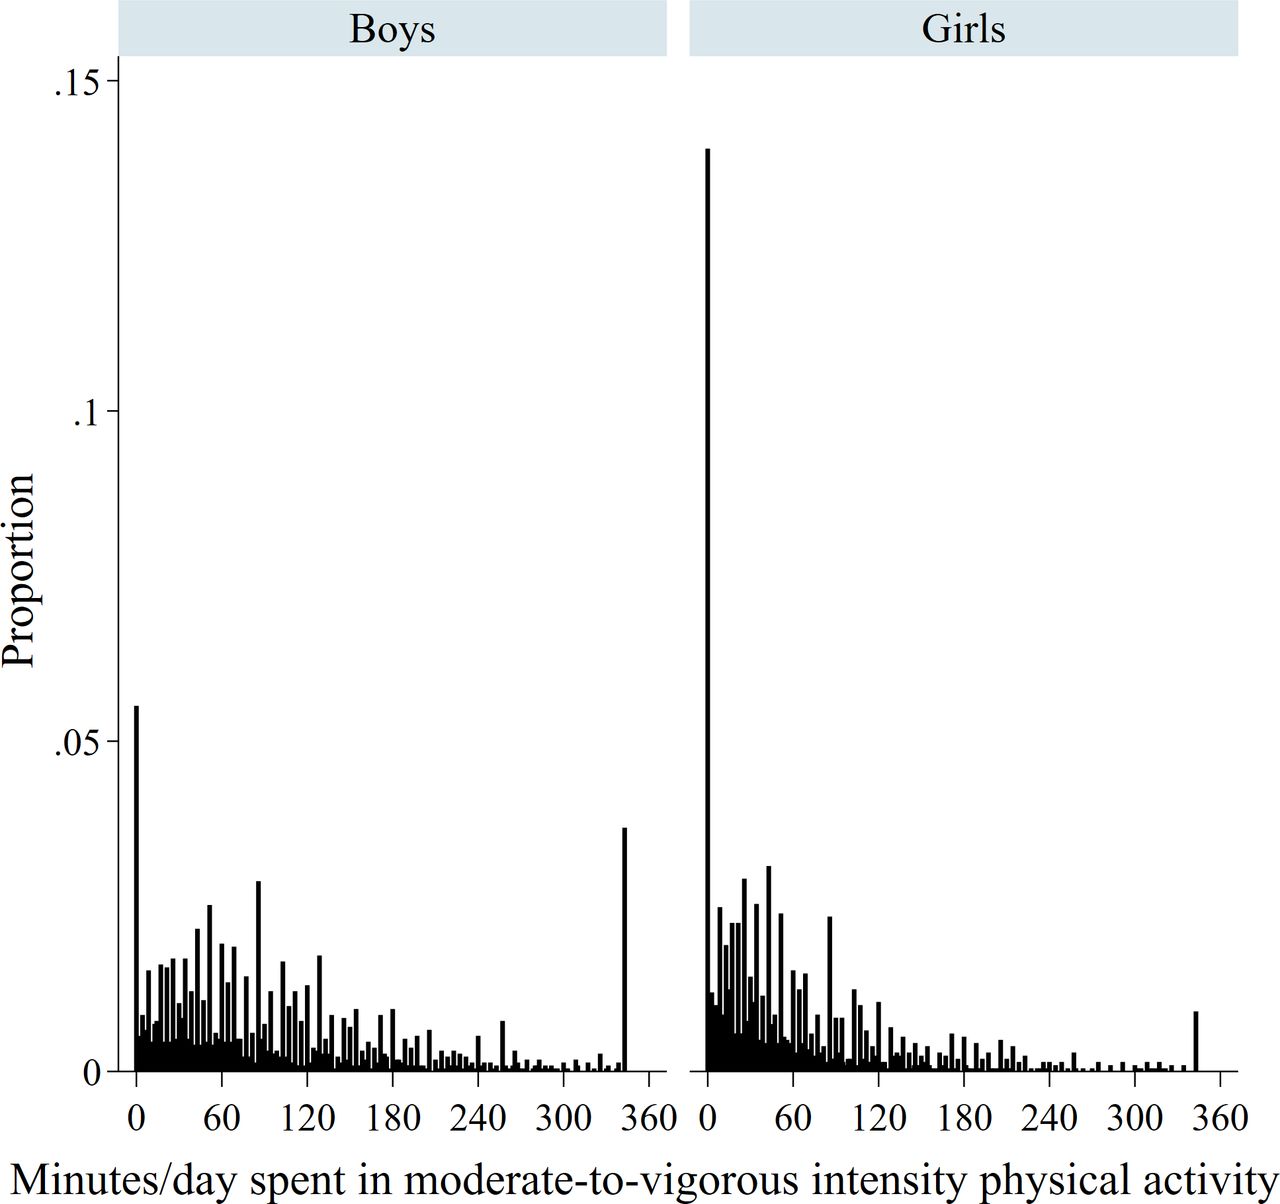
A minority of the analytical sample—66 (1.6%) and 101 (2.3%) adolescents in the HSE and NHANES datasets, respectively—had values of MVPA above 40 hours/week (ie, 342.9 min/day). Boys and girls in England spent 96 and 70 min/day on average in total MVPA in the last 7 days, respectively; equivalent figures for total MVPA in the USA were 100 and 67 min/day. However, each distribution showed a stack of zeros (highest among girls in the USA) and was positively skewed (figures 1–2).

Distribution of minutes/day spent in moderate-to-vigorous physical activity by sex in England.

Distribution of minutes/day spent in moderate-to-vigorous physical activity by sex in the USA.
Hurdle models
Table 2 (England) and table 3 (USA) show the AMEs from the estimated hurdle models corresponding to the absolute difference in the income-specific marginal means for the binary outcome of participation (doing any vs none), and the quantitative outcomes of MVPA (including those who did none) and MVPA active (conditional on those who did any). AMEs are shown graphically in figure 3 (England) and figure 4 (USA).
Parameter estimates from multivariable hurdle models (any participation and amount of time spent active), Health Survey for England 2008, 2012 and 2015

Average marginal effects (AMEs) for three outcomes of moderate-to-vigorous physical activity by sex in England. MVPA, moderate-to-vigorous physical activity.

Average marginal effects (AMEs) for three outcomes of moderate-to-vigorous physical activity by sex in the USA. MVPA, moderate-to-vigorous physical activity.
Parameter estimates from multivariable hurdle models (any participation and amount of time spent active), NHANES 2007–2016
Inequalities in MVPA in England
Among both sexes, each of the three outcomes for total (ie, formal and informal) MVPA showed similarities by income after confounder adjustment. However, this finding masked differences by sex, domain and outcome.
First, adolescents in high-income versus low-income households were more likely to have done any formal sports/exercise activity in the last 7 days (AMEs boys: 11%; 95% CI 4% to 17%; girls: 13%; 95% CI 6% to 20%); while girls in high-income households spent more time being active than girls in low-income households did (AME formal MVPA: 6 min/day, 95% CI 2 to 9). Second, girls in low-income households spent more time in informal activities than their counterparts in high-income households (informal MVPA: 21 min/day; 95% CI 10 to 33; informal MVPA active: 21 min/day; 95% CI 9 to 33), while the differences in informal activities among boys were attenuated to the null. Third, higher levels of active travel among boys in low-income versus high-income households were found for each of the three outcomes. The difference between boys in low-income versus high-income households in the probability of having done any active travel in the last 7 days was 8% (95% CI 1% to 15%). Among those who did any, boys in low-income versus high-income households spent 20 min/week more on average travelling actively (95% CI 2 to 38).
Inequalities in MVPA in the USA
Among both sexes, adolescents in high-income versus low-income households were more likely to do any (total) MVPA in a typical week (AMEs boys: 3%; 95% CI 0% to 6%; girls: 4%; 95% CI 0% to 7%); while girls in high-income versius low-income households spend more time being active (AMEs total MVPA: 16 min/day, 95% CI 5 to 26; total MVPA active: 14 min/day, 95% CI 3 to 25). As in England, the findings for total MVPA masked differences by sex, domain and outcome.
First, higher levels of recreational MVPA in high-income versus low-income households were evident among both sexes and each outcome. For example, differences between adolescents in high-income versus low-income households in recreational MVPA were 15 min/day in a typical week (95% CI 6 to 24) among boys and 19 min/day (95% CI 12 to 27) among girls; differences in recreational MVPA active were 12 min/day (95% CI 2 to 21) and 16 min/day (95% CI 8 to 24) for boys and girls, respectively.
Second, boys in high-income households were more likely to do any work-based MVPA than their counterparts in low-income households (AME 9%; 95% CI 2% to 16%), yet the quantitative outcomes (MVPA and MVPA active) showed similar levels by income. Third, adolescents in low-income versus high-income households were more likely to have taken part in active transportation (AMEs boys: 11%; 95% CI 3% to 19%; girls: 10%; 95% CI 3% to 17%). Among all participants (including those who did none in a typical week), those in the lowest-income versus highest-income households spent 7 min/day more in active travel (AMEs travel MVPA boys: 95% CI 3 to 12; girls: 95% CI 4 to 9). Among those who did any, boys and girls in low-income versus high-income households spent 8 min/day (95% CI 1 to 14) and 11 min/day (95% CI 7 to 16) longer on average travelling actively in a typical week, respectively.
Sensitivity analysis
Our main findings were very similar in analyses using untruncated data (see online supplemental tables 3 and 4 for England and the USA, respectively).
Supplemental material
Supplemental material
Discussion
Using nationally representative data from adolescents in England and the USA, sex-specific hurdle models were applied to compare levels and inequalities in self-reported total and domain-specific MVPA. We hypothesised that adolescents in high-income households were more likely to participate in MVPA and, conditional on doing any, to spend more or less time on average being active than their counterparts in low-income households. We further hypothesised that the pattern and/or magnitude of inequalities differ for boys and girls. Our analyses revealed a complex picture: differences in MVPA by household income varied by sex, domain and outcome. Levels of participation in any formal sports/exercise and recreational MVPA were higher among adolescents in high-income households in England and the USA, respectively. In contrast, levels of active travel, among boys (but not girls) in England and both sexes in the USA, were higher in low-income households.
Comparisons with previous studies
Comparisons with previous studies are difficult due to differences in study characteristics (eg, age range, SEP indicators or use of objective, device-based measurement) and analytical strategy. Bearing in mind this caveat, the low levels of MVPA across all income groups presented herein agree with other English and US studies. In England, data from the HSE 2015 showed that 21% and 16% of boys and girls aged 5–15 years, respectively, achieved the WHO recommendation of at least 60 min of MVPA per day21; US data from the 2016 National Survey on Children’s Health showed an equivalent figure of 24% among 6–17 years old.42
Income-based inequalities
Our findings of income-based inequalities in any formal sports/exercise and recreational MVPA broadly agree with the conclusions of the systematic review by Stalsberg and Pedersen7 on the effects of different SEP measures, for example, income, occupation and neighbourhood, on adolescent PA.7 More specifically with regard to family/household income, US investigations based on NHANES data showed lower reported involvement in any recreational MVPA among 12–17 years old in lower-income versus higher-income households,6 while the opposite pattern was found for engagement in any active transportation among 12–19 years old.42 Based on the 2012 NHANES and National Youth Fitness Survey Wolfe et al38 observed higher odds of low/poor cardiorespiratory fitness among 3–15 years olds in low-income and moderate-income versus high-income families.38 UK studies of 7–8 years old using accelerometry found lower levels of objectively measured VPA in lower-income versus higher-income households,43 but no clear differences by SEP in MVPA.44 However, activity monitors do not currently capture data on activity domain.
Inequalities using non-income variables
Inequalities in adolescent PA have also been observed in studies using non-income based measures of SEP. In the USA, lower levels of PA were observed among children living in families with a health insurance status of ‘government/Medicaid’, ‘other’ or ‘none’ versus those with private insurance.37 Our findings also agree with worldwide studies which observed lower reported MVPA accumulated outside-of-school among 15–16 years olds in lower-wealth versus higher-wealth households,45 and lower levels of activity frequency among 11, 13 and 15 years old in the least-affluent versus most-affluent families.3 The lower levels of involvement of adolescent boys and girls in lower-income versus higher-income households in any formal MVPA presented herein corresponds with previous analysis of HSE 2008 children aged 5–15 years using an area-based deprivation measure.19 Our findings of divergent patterns in the recreational and active transportation domains in the USA (favouring the higher-income and lower-income households, respectively) correspond with similar patterns found among adults aged 20+ years using the same datasets as the present study (NHANES 2007–2016) but with highest educational attainment as the SEP measure.46 The higher levels of active travel for boys in low-income households in England shown in the present study agrees with findings of a greater likelihood of active travel among adults in more deprived areas in Scotland.47
Sex-specific inequalities in MVPA
Most studies examining inequalities in adolescent MVPA adjusted for sex in their multivariable analyses.5 37 44 In the present study, inequalities in the average time spent in formal MVPA (including those who did none) in England were evident among girls, but not among boys. This finding is in agreement with a previous US study, which showed income-based inequalities in the average min/day spent in recreational MVPA (among those reporting any) among girls aged 12–17 years, but not among boys.6
Our novel use of hurdle models adds to recent literature by showing the domain-specific and outcome-specific nature of inequalities in adolescent MVPA by sex. For example, boys in England in high-income households were more likely to do any formal sports/exercise MVPA than their counterparts in low-income households; while the amount of time spent doing sports/exercise showed no difference by income among those who did any. In contrast, inequalities in recreational activity in the USA exist for both sexes in participation and in time spent being active. Such findings illustrate the limitations of using single equation regression models when the determinants for participation and volume may differ. Decomposing the single quantitative MVPA variable via hurdle modelling can therefore potentially shed light on the determinants of inequalities in the lower tail of the distribution (drivers of inactivity) and those impacting the positive, non-zero, part of the distribution, implying potentially different solutions to reduce inequalities.48
Mechanisms and implications for policy
There are numerous pathways through which markers of SEP such as household income impact on PA. Differences in financial/wealth resources and the built environment, including those driving inequalities in opportunity and access to affordable facilities and safe public outdoor spaces,9 are likely key modifiable determinants of inequalities in formal (England) and recreational (US) activities. Higher levels of active travel in low-income households likely reflect lower car ownership.49 Improving overall levels of PA and reducing inequalities requires policy actions and interventions to ensure low barriers of entry (eg, provision of sports facilities4 and after-school clubs50 that are free for anyone to use) and adequate support to enable adolescents to ‘move more and sit less’.51 Tackling income-based inequalities would also require tackling disparities in PA by the correlated dimension of race/ethnicity.52 Analyses of NHANES 2011–2012 data show lower levels of adolescent MVPA among non-Hispanic Blacks, Hispanics and Asians compared with non-Hispanic white populations.53
Formal interventions in cluster-randomised controlled trials aimed at increasing levels of PA among adolescents have included additional physical education classes (the KISS and STOPP trials in Switzerland54 and in Stockholm,55 respectively); exercise classes before and after school as well as at lunch breaks (the TAAG trial in the USA), and peer-mentoring and participative learning (the MOVE project56). While such interventions can fit rather easily within the school curriculum and are relatively inexpensive, the meta-analysis by Love et al concluded that such interventions have been ineffective among school-aged children and adolescents (aged 6–18 years at baseline) across both sexes and all SEP groups in increasing levels of accelerometer-assessed daily MVPA.57
According to WHO in their global action plan on PA (GAPPA),58 reducing inequalities requires both population-based policy actions to tackle the ‘upstream’ determinants that shape the equity of opportunities for PA and support for ‘downstream’ individually focused (educational and informational) interventions, with both implemented according to the principle of proportional universality. Examples of the former include encouraging non-motorised travel modes (through better road connectivity and improved provision of cycling and walking infrastructure such as segregated cycle lanes and improved road safety through traffic free routes,59 with a priority focus on travel routes around educational facilities58), and creating more opportunities for PA in public open spaces and local community settings.3 54–57 60 In the UK, the National Institute for Health and Care Excellence (NICE) recommended over a decade ago that key stakeholders should identify and work with groups of local children and young people (including those from lower socioeconomic groups) who are insufficiently active in order to: (1) understand the factors that help or prevent them from being physically active and (2) involve them in the design, planning and delivery of safe indoor and outdoor opportunities for MVPA that can tackle any inequalities in provision.61
Further research may be needed to identify the pathways through which economic and non-economic factors potentially result in fewer opportunities (at school and in the local community) for MVPA that meet the needs and interests of adolescent girls.3 The recommendations set out by NICE to increase opportunities for MVPA among girls and young women included delivery of single-gender as well as mixed-gender activities, and provision of opportunities in easily accessible community settings with appropriate changing facilities offering privacy.61 Guthold et al3 describe social marketing campaigns (eg, the This Girl Can! Campaign in the UK) combined with multicomponent intervention strategies ‘as the starting points to increase levels of PA in girls’, and is a core recommendation of the GAPPA.3
Strengths and limitations
Strengths of our study include the use of nationally representative data across PA domains. Although it is well known that MVPA distributions typically contain excess zeros and positive skew, no epidemiological studies to date have applied hurdle models to assess the different aspects of adolescent MVPA (participation and volume) and estimate inequalities in these. Hurdle models avoid the loss of information and statistical power that occurs when the quantitative MVPA variable is grouped into a binary variable, transformed to meet the assumption of normality,11 or when analysed in a single-equation model.6 By examining these different aspects of MVPA across PA domains (eg, recreational, work and travel) by household income in sex-stratified analyses our study responds to the call by the WHO for strengthened reporting of disaggregated data to reflect the priority of the GAPPA to reduce within-country disparities and to reduce levels of inactivity among the least active populations.58
Caution is required, however, when interpreting our findings. First, self-reported PA data has well-known limitations such as recall and reporting (social desirability) bias62; this may be socially patterned, thereby potentially upwardly or downwardly biasing our estimates of inequalities. Second, the analytical sample sizes (reduced further by missing PA or income data) means our findings will be statistically underpowered to some extent despite the pooling of data across survey years. Third, the analytical samples (aged 11–15 and 12–17 in England and the USA, respectively) and PA outcomes were different across the two countries. However, our aim was to compare inequalities rather than levels of MVPA. Fourth, the choice of potential confounders was limited by data availability. We were unable to provide separate estimates by race/ethnicity using NHANES data or examine any potential moderation of income inequalities. Fifth, our findings are contingent on HSE and NHANES data collection methods, including the exclusion of in-school MVPA and the assumption that all activities were of at least moderate intensity (HSE), the minimum duration of 10 min in NHANES (in accord with the contemporaneous US guidance63 but differing from recent guidelines which acknowledge that PA of any duration enhances health64), and the inability to specifically focus on inequalities in PA that typically require financial resources (both datasets). We acknowledge that different definitions may have led to different conclusions. Finally, we cannot draw causal inferences, as this was a descriptive study based on cross-sectional data.
Conclusions
Participation in formal sports/exercise and recreational MVPA was higher among adolescents in high-income households in England and the USA, respectively. Our findings may assist policy-makers to identify and commission tailored policy actions and interventions to reduce inequalities, and our methods could be used by practitioners to monitor and evaluate their impact.
Acknowledgments
The authors thank the interviewers and nurses, the participants in the Health Survey for England series, and colleagues at NatCen Social Research. The authors also thank NHS Digital. NHS Digital is the trading name of the Health and Social Care Information Centre.
References
Supplementary materials
Supplementary Data
This web only file has been produced by the BMJ Publishing Group from an electronic file supplied by the author(s) and has not been edited for content.
Footnotes
Twitter @j_mindell
Contributors SS conceptualised the study. SS was responsible for conducting the analyses, interpreting the results and drafting the manuscript. SS and JSM critically revised the manuscript. Both authors read and approved the final manuscript.
Funding The authors have not declared a specific grant for this research from any funding agency in the public, commercial or not-for-profit sectors.
Competing interests None declared.
Patient consent for publication Not required.
Ethics approval Research ethics approval for the HSE 2008 and HSE 2012 was obtained from the Oxford A Research Ethics Committee (reference number 07/H0604/102 and 10/H0604/56, respectively); ethical approval for the HSE 2015 was obtained from the West London Research Ethics Committee (reference number 14/LO/0862). NHANES protocols were approved by the National Center for Health Statistics Ethics Review Board.
Provenance and peer review Not commissioned; externally peer reviewed.
Data availability statement Data are available in a public, open access repository. HSE datasets are available via the UK Data Service (http://www.ukdataservice.ac.uk). NHANES datasets are available via the CDC website (https://www.cdc.gov/nchs/nhanes).
Supplemental material This content has been supplied by the author(s). It has not been vetted by BMJ Publishing Group Limited (BMJ) and may not have been peer-reviewed. Any opinions or recommendations discussed are solely those of the author(s) and are not endorsed by BMJ. BMJ disclaims all liability and responsibility arising from any reliance placed on the content. Where the content includes any translated material, BMJ does not warrant the accuracy and reliability of the translations (including but not limited to local regulations, clinical guidelines, terminology, drug names and drug dosages), and is not responsible for any error and/or omissions arising from translation and adaptation or otherwise.