Article Text

Abstract
Objectives Explore the association between the first national lockdown associated with the COVID-19 pandemic on admissions for violence and the relationship with deprivation.
Design Population-based longitudinal cohort study.
Setting North East and North Cumbria (NENC) area of England.
Participants All individuals living in the NENC (total population 3.1 million) admitted 2017/2018, 2018/2019, 2019/2020.
Main outcome measures Hospital Episode Statistics were extracted at Lower Layer Super Output Area and the Index of Multiple Deprivation 2019 decile applied. Directly standardised rates were explored for number of accident and emergency (A&E) attendances (per 1000); Alcohol-related admissions using Public Health England (PHE) Fingertips tool (per 100 000, ID 91414) and emergency admissions for violence (including sexual violence) (per 100 000) (ID 11201 classified by International Classification of Diseases (ICD)10 codes X85 to Y09).
Results A&E attendances are higher in NENC compared with England (409.9 per 1000 v 359.2). A&E attendance was 81% higher in 2019/20 in the most deprived compared with the least deprived. Attendances dropped during the first national COVID-19 lockdown and by September 2020 had not returned to ‘normal’ levels.
Admissions related to violence are a third higher in NENC (29% to 34% higher across 3 years) rates 7–10 times higher in most deprived than least deprived areas. Admission rates reduced during the first UK lock down but this bounced back by August higher than any of the previous 12 months.
Conclusion Emergency admissions with violence appear to associate with the COVID-19 pandemic being initially higher than before the first national lockdown. This is in the context of overall A&E attendances which are lower post lockdown. Given that emergency admissions with violence have been consistently higher in the NENC compared with England over recent years, we suggest that targeted action is required in NENC to address health inequalities.
- accident & emergency medicine
- COVID-19
- epidemiology
- general medicine (see internal medicine)
- quality in health care
Data availability statement
Data are available in a public, open access repository. Data may be obtained from a third party and are not publicly available. The data are available publically via the Hospital Episodes Statistics and PHE Fingerprints tool. https://digital.nhs.uk/data-and-information/data-tools-and-services/data-services/hospital-episode-statistics; https://fingertips.phe.org.uk/
This is an open access article distributed in accordance with the Creative Commons Attribution Non Commercial (CC BY-NC 4.0) license, which permits others to distribute, remix, adapt, build upon this work non-commercially, and license their derivative works on different terms, provided the original work is properly cited, appropriate credit is given, any changes made indicated, and the use is non-commercial. See: http://creativecommons.org/licenses/by-nc/4.0/.
Statistics from Altmetric.com
- accident & emergency medicine
- COVID-19
- epidemiology
- general medicine (see internal medicine)
- quality in health care
Strengths and limitations of this study
We present a large longitudinal observational data set to explore the impact of the first UK COVID-19 lockdown on total emergency admissions and those for violence.
Our study uses publicly available sources which may limit the data available.
Interpretation should consider the potential for impact of inconsistent coding of violence in Hospital Episode Statistics Data.
Our analysis did not include examination of the interaction with age, gender or ethnicity on the pattern of admissions for violence related injuries or any detail regarding the types of issue that precipitated admission.
Introduction
The North of England and particularly the North East has the poorest life expectancy of all the English regions with fewer years of life spent in good health for both males and females.1 The COVID-19 pandemic and its associated lockdown measures have impacted significantly on these stark health inequalities with evidence suggesting that the impact of the pandemic has been suffered more severely by those in the North of England2 (https://www.ncl.ac.uk/press/articles/latest/2020/11/nhsastudy/).
Studies have confirmed that rates of emergency hospital admissions for assault increased by almost 30% across England between 2002 and 2006 with higher rates associated with deprivation across all ages with a sixfold difference in admission rates between the poorest (highest) and wealthiest quintiles of residence.3 Violence is associated with negative social and mental health outcomes, as well as having a significant direct and indirect economic burden for health and social care systems.4–7 Violence is a major cause of morbidity and mortality that is increasingly recognised as not just a major public health issue but also a driver of health inequality.3 8–10 Although a growing number of studies demonstrate that violence is preventable, investment in violence prevention is not on a scale that matches the economic burden to health and social care.11 12
The NEQOS Population Health and Healthcare Surveillance report is produced annually https://www.ahsn-nenc.org.uk/what-we-do/improving-population-health/measurement/. The aim of this report is to provide a single reference source containing a regional oversight of activity across all areas of health and healthcare, to assist users in identifying where there is wide variation across the North East and North Cumbria (NENC). We have previously harnessed this annually commissioned population surveillance report for the North East of England to explore health inequalities, where we have shown that, although improving over time, the gap between the North East and the rest of England in healthy life expectancy is widening.1 During the COVID-19 pandemic we have used this resource to examine the impact of the COVID-19 pandemic on a range of measures that underpin health inequality. In this current study, we explore attendances at accident and emergency (A&E) overall and emergency admissions for alcohol and violence during and after the first UK national lockdown. Although there were dramatic reductions in overall attendances at A&E and emergency admissions for alcohol and violence seen during the first COVID-19 lockdown, when the lockdown was eased A&E attendances overall did not return to normal levels, unlike those for alcohol which did return quickly to prelockdown levels. There was however initially a potentially alarming trend seen for admissions for violence which appeared to have increased immediately post-lockdown (by Aug 2020) to levels not seen since early 2019, although the subsequent trend in admission rates appeared to fall again and has not returned to prelock down levels.
Methods
Geography
NENC comprises one Integrated Care System which is the furthest North in England. It encompasses a population of 3.1 million people including some of the most deprived areas in the UK. On 1 April 2020, there were a number of changes (mergers) relating to Clinical Commissioning Groups (CCGs) within the NENC area. Durham Dales, Easington and Sedgefield CCG and North Durham CCG merged to become National Health Service (NHS) County Durham CCG; Darlington CCG, Hartlepool and Stockton on Tees CCG and South Tees CCG became NHS Tees Valley CCG; and Hambleton, Richmondshire and Whitby CCG became part of NHS North Yorkshire CCG.
Where the data are presented by CCG, this is reported for the current eight CCGs that are part of the NENC area.
Data sources and presentation
The majority of the data presented is taken from Hospital Episode Statistics (HES), provided by NHS Digital. HES datasets are accessed via the Data Access Environment and reused with the permission of NHS Digital (Copyright 2021, NHS Digital). The 2020/2021 HES data are classed as provisional and should therefore be treated as an estimate until the final National Statistics annual publications.
Data were extracted from HES at Lower Layer Super Output Area and the Index of Multiple Deprivation 2019 decile was applied, before this was aggregated to CCG level for reporting purposes.
The hospital activity data relating to each indicator is generally presented in three ways:
By CCG, with NENC and England rates (Directly standardised rate)—for 2017/2018, 2018/2019 and 2019/2020.
By deprivation decile, for all CCGs in the NENC combined, crude rates—for 2017/2018, 2018/2019 and 2019/2020.
As a trend over time, for all CCGs in the NENC combined, counts—from April 2017 to September 2020 inclusive (note that data from 2020/2021 is currently classed as provisional)—and, for emergency admissions for violence only, as a crude admission rate for all CCGs in the NENC combined and for England, from April 2019 to December 2020.
In accordance with HES disclosure rules all small numbers (1–7) have been removed from this report and the remaining data has been rounded to the nearest five before crude rates are calculated. Directly standardised rates are based on unrounded data.
Time frame
We identified UK National lockdown dates from the following source: https://www.instituteforgovernment.org.uk/sites/default/files/timeline-lockdown-web.pdf:
With the first lockdown being 23 March 2020–10 May 2020.
Attendances at A&E departments
These data report on the number of A&E attendances, expressed as a directly standardised rate per 1000 population, that have taken place at either:
Emergency departments with a consultant-led 24-hour service (type 01 departments).
Other type of A&E/minor injury departments for the reception of A&E patients, nurse or doctor led (type 03 departments).
Alcohol-related hospital admissions (directly standardised rate per 100 000)
Alcohol consumption is a contributing factor to hospital admissions and deaths from a diverse range of conditions.
The data reported are admission rate to hospital where the primary diagnosis is an alcohol-attributable code or a secondary diagnosis is an alcohol-attributable external cause code. For each episode identified, an alcohol-attributable fraction is applied, which relates to the extent to which alcohol contributes to a health outcome. The total number of alcohol-related hospital admissions is therefore not a number of actual people or admissions, but an estimated number of admissions calculated as the sum of the fractions. This indicator is available in the PHE Fingertips tool https://fingertips.phe.org.uk/ (ID 91414).
Emergency admissions for violence (including sexual violence) (directly standardised rate per 100 000)
This indicator is available in the PHE Fingertips tool https://fingertips.phe.org.uk/ (ID 11201) and is based on activity where there is a recording of violent crime (classified by ICD10 codes X85–Y09) in any position of the admitting episode. Details of the specific codes included are detailed in box 1.
International Classification of Diseases (ICD)-10 codes X85–Y09 were based on the Fingertips indicator for emergency admissions for violence (Fingertips indicator reference 11201) but for a more recent time period than is presented via the Fingertips tool. Codes can be broken down as follows (based on https://icd.who.int/browse10/2016/en%23/X85-Y09)
X85—Assault by drugs, medicaments and biological substances.
X86—Assault by corrosive substances.
X87—Assault by pesticides.
X88—Assault by gases and vapours.
X89—Assault by other specified chemicals and noxious substances.
X90—Assault by unspecified chemical or noxious substance.
X91—Assault by hanging, strangulation and suffocation.
X92—Assault by drowning and submersion.
X93—Assault by handgun discharge.
X94—Assault by rifle, shotgun and larger firearm discharge.
X95—Assault by other and unspecified firearm discharge.
X96—Assault by explosive material.
X97—Assault by smoke, fire and flames.
X98—Assault by steam, hot vapours and hot objects.
X99—Assault by sharp object.
Y00—Assault by blunt object.
Y01—Assault by pushing from high place.
Y02—Assault by pushing or placing victim before moving object.
Y03—Assault by crashing of motor vehicle.
Y04—Assault by bodily force.
Y05—Sexual assault by bodily force.
Y06—Neglect and abandonment.
Y07—Other maltreatment.
Y08—Assault by other specified means.
Y09—Assault by unspecified means.
Patient and public involvement statement
There was no specific involvement of patients or the public in this study
Results
Attendances at A&E departments
Attendances at A&E departments are significantly higher in the NENC compared with England as a whole (in 2019/2020, a directly standardised rate of 409.9 per 1000 population compared with 359.2 per 1000) (figure 1A). There was significant variation in attendances across the 8 CCGs in our region (figure 1A). A&E attendance (per 1000 population) was 81% higher in 2019/2020 in the most deprived areas compared with the least deprived, a pattern that was present across the 3 years (figure 1B). Exploring attendance over time, there was a large drop in attendances in April 2020 during the first national COVID-19 lockdown. Attendance counts began to climb again through the summer but by September 2020 had not returned to the ‘normal’ levels of 2017–2019 which had been relatively stable (figure 1C).
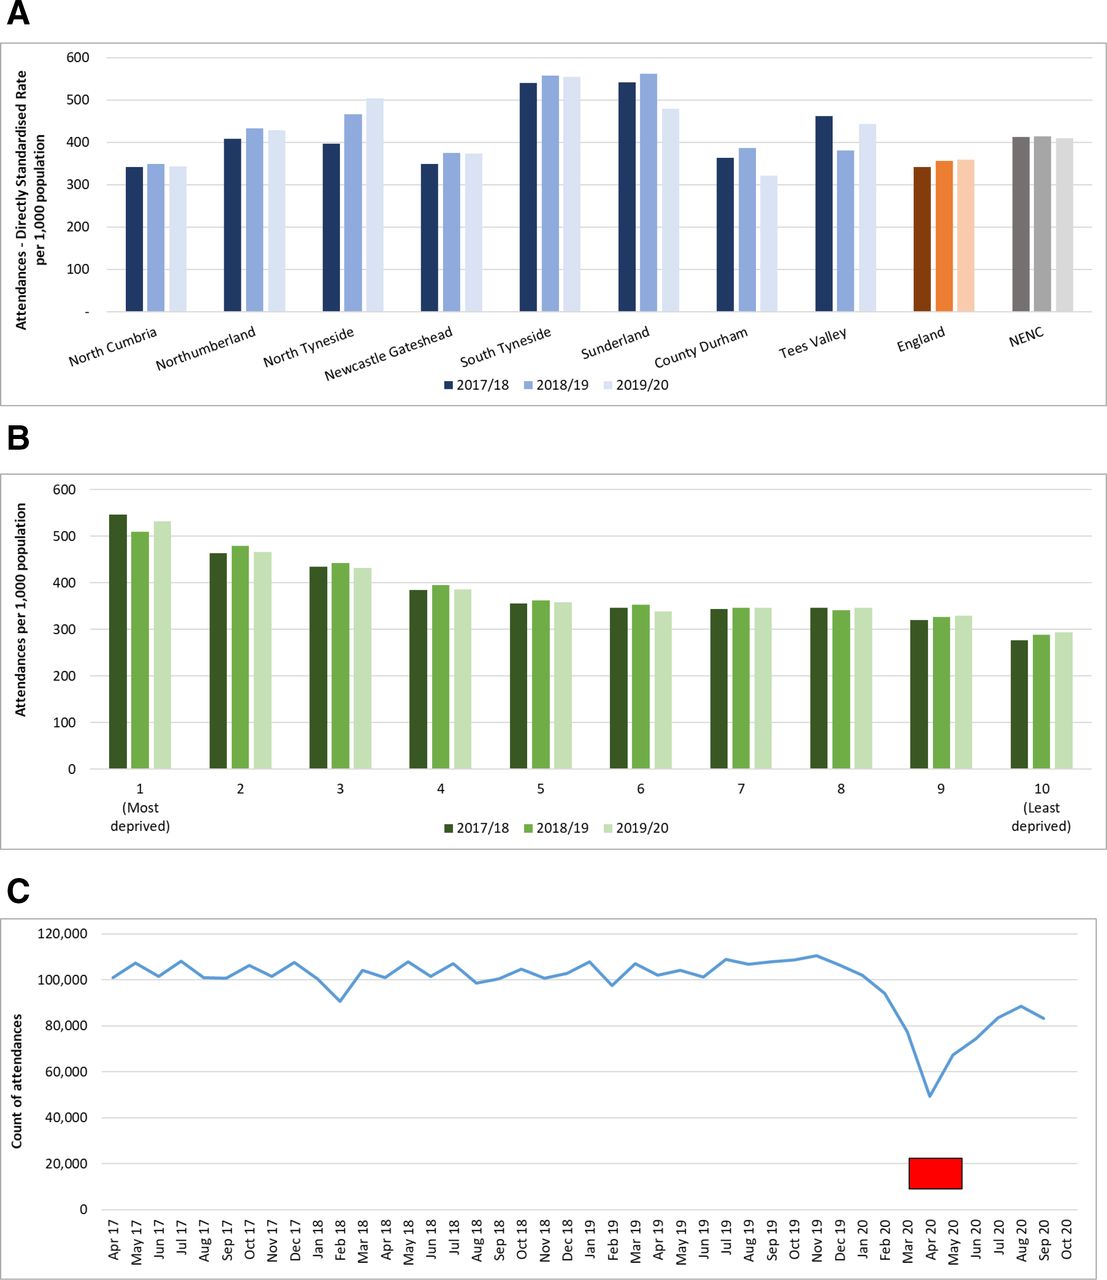
A&E attendances (per 1,000). A&E, accident and emergency; NENC, North East and North Cumbria. Lockdown is shown in red.
Admissions related to alcohol
Admissions per 100 000 population in NENC were around 34% higher compared with the whole of England with overall rates that had increased over the 3 years between 2017/2018 and 2019/2020. The rate had increased in five of the eight CCGs across all periods (figure 2A). When we considered the emergency admissions by age group, admissions tended to be higher by age up to the age of 74 (figure 2B).

Alcohol-related hospital admissions (per 100 000). NENC, North East and North Cumbria. Lockdown is shown in red.
Despite the increase in the directly standardised rate seen in 2019/2020, there was a drop of almost one-third of the number of admissions (average of around 2200 for the months leading up to lockdown, down to 1500 in April (32% reduction)) in response to the initial lockdown in March and April but admission numbers had returned to their previous level by September 2020 (figure 2C).
Admissions related to violence
Based on admissions between 2017/2018 and 2019/2020, admissions related to violence are around a third higher in NENC compared with England (29% to 34% higher across the 3 years) (figure 3A). There is a clear pattern in terms of deprivation, with rates of admission between 7 and 10 times higher in the most deprived areas than the least deprived areas (figure 3B). The crude admission rate over time showed a reduction during the first lockdown but this had bounced back by August 2020 to levels similar to early 2019 and therefore was in August higher than any of the previous twelve months (figure 3C). Examining the national trend up to December 2020 (which we looked at subsequently and therefore is available for a more recent time period), there was a similar fall in April before a peak in August (figure 3D) although the levels in NENC were higher at all time points. However, for both NENC and England, the rates dropped again after August; for England, the rate has continued to fall and, for NENC only, it reached a new low point in October 2020 with a slow increase subsequently that has not yet returned to prepandemic levels (figure 3D). Admissions for violence in NENC were higher in males compared with females although for both groups there was an uplift postlockdown (figure 3E).

Emergency admissions for violence (including sexual violence), per 100 000. NENC, North East and North Cumbria. Lock
Discussion
The NENC has the poorest healthy life expectancy compared with other areas of England. It has been suggested that these health inequalities have been worsened due to the COVID-19 pandemic. Violence is recognised as being one driver of health inequalities, therefore we set out to explore the association between the COVID-19 pandemic and admissions with violence before and after the first UK national lockdown. We have shown that although A&E attendances overall, and those for alcohol and violence dropped during the lockdown, post lockdown there has been an initial rebound of admissions for violence which, although it has subsequently declined again, seems to have been a predominant issue in males.
The healthcare system in NENC is recognised as being of the highest quality with some of the most outstanding organisations in the country (eg, https://www.cqc.org.uk/provider/RTD; https://www.cqc.org.uk/provider/RX4). However, the challenges faced by the health and social care system in NENC are immense. Attendances at A&E are consistently higher in NENC compared with England overall with the most deprived areas having the largest number of A&E attendances, and the least deprived the lowest number of attendances. During lockdown the A&E attendance numbers dropped and our study suggests have not returned to normal levels. This observation has been reported in other areas of the UK healthcare system13 14 and in all age groups15 and has been hypothesised as, at least in part, related to changes in healthcare seeking behaviour. It will be interesting to see whether the levels of attendance at A&E eventually return to pre lockdown levels and whether alternative clinical pathways such as NHS 111 might sustainably be able to take the pressure off already stretched emergency services.
The data presented here confirm that emergency admissions for alcohol-related issues were consistently higher in NENC prelockdown, and although the levels dropped during the lockdown, they have returned to pre lockdown levels, this is despite overall lower A&E attendances.
When we considered attendances for violence, prior to the pandemic these were higher in NENC compared with England and, as has been seen in other studies, higher from those living in the most deprived areas compared with the least deprived. It is therefore likely that the high levels of violence and its associated health and social consequences play some part in the high levels of health inequalities seen in NENC. Although there was a dip in attendances during the national lockdown, the worryingly higher levels seen immediately post lockdown may highlight another important impact of the COVID-19 pandemic on an already ‘stressed’ system.
Interventions are recognised that will impact positively on levels of violence in communities and over time will reduce rates and lead to more positive outcomes.16 Violence is strongly associated with social factors such as unemployment, income inequality, rapid social change and access to education; It is possible that the COVID-19 pandemic itself and/or the associated national lockdown response have either exacerbated these social factors or given visibility to issues not previously recognised. Now it is important that positive action occurs as we recognise that measures that aim to reduce inequality and address such factors may indirectly and directly impact on levels of violence. Our data suggest that considering the inequalities divide between violence levels, particularly among males and compared with the overall England rates, that targeted approaches initiated in NENC will allow the greatest reductions in both violence levels but also in health inequalities. Strategies in Wales involving multiple agencies have proven to be very effective at reducing16 presentations after violence. Evidence is available for the benefits of interventions, but investment is needed in order to develop appropriate strategies to address these significant issues in NENC.
The WHO have identified a number of effective strategies that focus on prevention and immediate response.17 None of these are quick fixes but highlight the importance of behavioural and social interventions that are needed to prevent and reduce violence levels in areas such as NENC and the role that policy and government must play in order to address these inequalities.
It is important to acknowledge that our study has a number of limitations. A more detailed exploration of the differences in the prevalence of violence by sociodemographic factors (age, gender, deprivation quintile and rural–urban status) is required to inform more targeted intervention and prevention activity. We used publically available data explore changes over time. It is important to recognise that there is inconsistent coding of HES data and that we did not perform an analysis to examine the interaction with age, gender or ethnicity. Ideally, exploring data from subsequent lockdowns could be of further interest and add to our understanding of the impact of the pandemic and associated lock downs. However, the second and third lock downs were not consistent across the country and their lifting took place in a more staged way.
In conclusion, we have shown that emergency admissions with violence have been impacted on by the COVID-19 pandemic and were initially higher than before the first national lockdown. This is in the context of overall A&E attendances which are lower post lockdown. Given that emergency admissions with violence have been consistently higher in the NENC compared with England over recent years, we suggest that positive action is required in NENCto understand more fully the role of violence in the health of those in NENC and its relationship with the COVID-19 pandemic and the associated lockdowns.
Data availability statement
Data are available in a public, open access repository. Data may be obtained from a third party and are not publicly available. The data are available publically via the Hospital Episodes Statistics and PHE Fingerprints tool. https://digital.nhs.uk/data-and-information/data-tools-and-services/data-services/hospital-episode-statistics; https://fingertips.phe.org.uk/
Ethics statements
Patient consent for publication
Ethics approval
Research ethical approval was not required for this study as all data is publicly available.
Footnotes
Contributors JLN and AB developed the hypothesis and created the concept. AB and PC performed the analysis and created the initial report. JLN is guarantor, wrote the initial draft of the manuscript and all authors reviewed and approved the subsequent drafts of the manuscript.
Funding The authors have not declared a specific grant for this research from any funding agency in the public, commercial or not-for-profit sectors.
Competing interests None declared.
Patient and public involvement Patients and/or the public were not involved in the design, or conduct, or reporting, or dissemination plans of this research.
Provenance and peer review Not commissioned; externally peer reviewed.