Article Text

Abstract
Objective This study aimed to develop a blood test for the prediction of pre-eclampsia (PE) early in gestation. We hypothesised that the longitudinal measurements of circulating adipokines and sphingolipids in maternal serum over the course of pregnancy could identify novel prognostic biomarkers that are predictive of impending event of PE early in gestation.
Study design Retrospective discovery and longitudinal confirmation.
Setting Maternity units from two US hospitals.
Participants Six previously published studies of placental tissue (78 PE and 95 non-PE) were compiled for genomic discovery, maternal sera from 15 women (7 non-PE and 8 PE) enrolled at ProMedDx were used for sphingolipidomic discovery, and maternal sera from 40 women (20 non-PE and 20 PE) enrolled at Stanford University were used for longitudinal observation.
Outcome measures Biomarker candidates from discovery were longitudinally confirmed and compared in parallel to the ratio of placental growth factor (PlGF) and soluble fms-like tyrosine kinase (sFlt-1) using the same cohort. The datasets were generated by enzyme-linked immunosorbent and liquid chromatography-tandem mass spectrometric assays.
Results Our discovery integrating genomic and sphingolipidomic analysis identified leptin (Lep) and ceramide (Cer) (d18:1/25:0) as novel biomarkers for early gestational assessment of PE. Our longitudinal observation revealed a marked elevation of Lep/Cer (d18:1/25:0) ratio in maternal serum at a median of 23 weeks’ gestation among women with impending PE as compared with women with uncomplicated pregnancy. The Lep/Cer (d18:1/25:0) ratio significantly outperformed the established sFlt-1/PlGF ratio in predicting impending event of PE with superior sensitivity (85% vs 20%) and area under curve (0.92 vs 0.52) from 5 to 25 weeks of gestation.
Conclusions Our study demonstrated the longitudinal measurement of maternal Lep/Cer (d18:1/25:0) ratio allows the non-invasive assessment of PE to identify pregnancy at high risk in early gestation, outperforming the established sFlt-1/PlGF ratio test.
- obstetrics
- gynaecology
- public health
Data availability statement
Data are available upon reasonable request. The datasets used and/or analyzed in this study are available upon request to the corresponding author.
This is an open access article distributed in accordance with the Creative Commons Attribution Non Commercial (CC BY-NC 4.0) license, which permits others to distribute, remix, adapt, build upon this work non-commercially, and license their derivative works on different terms, provided the original work is properly cited, appropriate credit is given, any changes made indicated, and the use is non-commercial. See: http://creativecommons.org/licenses/by-nc/4.0/.
Statistics from Altmetric.com
Strengths and limitations of this study
This study is among the first to employ an integrative approach to discover serological biomarkers for pre-eclampsia (PE) assessment in early gestation.
The longitudinal evaluation of biomarkers from the discovery phase confirms their potential clinical utility and increases their chances to be translated into real clinical practice.
The direct comparison between the new and existing biomarker panels in a longitudinal analysis provides additional evidence for their clinical values in assessing PE.
The sample size of the study is small.
It is a retrospective study that lacks racial heterogeneity, a larger prospective study based on more racially diverse cohort is necessary to generalise the findings into a broader population for clinical use.
Introduction
Pre-eclampsia (PE) is a disorder of the placental vasculature, affecting 5%–8% of all pregnancies worldwide. It still remains a leading cause of maternal and fetal mortality,1 accounting for 42% of all maternal deaths and 15% of preterm deliveries.2 3 It is characterised by diffused endothelial dysfunction, increased peripheral vascular resistance, hypertension, proteinuria and dysregulated coagulation. The pathogenesis of PE is complex as it progresses from asymptomatic stage in the first trimester to a symptomatic stage late in gestation. Although its aetiologies remain largely unknown, mounting evidence has revealed that placental dysfunction is integral to the development of PE.4 Pathophysiological perturbations of placental development cause incomplete remodelling of the uterine spiral arteries and poor invasion of trophoblasts into placental cells, which induces persistent placental oxidative stress and hypoxia, such as PE.5 6 From a clinical perspective, early prediction of PE (ie, within the first 16 weeks of gestation) is of critical importance as it would allow for early treatment of high-risk women, which has been proposed to reduce the occurrence of PE. Gestational interventions such as steroids to accelerate fetal lung maturity,7 magnesium for seizure prophylaxis,8 aspirin treatment and antihypertensive therapy9 are effective in reducing both maternal and fetal mortality in populations with high risks of developing PE.10 11
However, the early prediction of PE remains challenging. Traditional risk factors such as a prior history of PE, first pregnancy, multiple gestation and obesity have insufficient sensitivity and specificity (less than 60%) for the prediction of PE.12–15 An algorithm has been developed to predict early-onset PE using maternal risk factors, uterine artery Doppler, blood pressure, and maternal serum markers. It achieved a sensitivity of 95% and a false positive rate of 10%.16 There is also one blood test using soluble fms-like tyrosine kinase (sFlt-1) and angiogenic placental growth factor (PlGF). An imbalance of angiogenic and anti-angiogenic factors during pregnancy was found to disrupt the developmental homoeostasis of the placenta.17 18 Two placental-derived factors, anti-angiogenic sFlt-1 and angiogenic PlGF, were associated with the pathophysiology of PE.19 A multicentre trial demonstrated that the sFlt-1/PlGF ratio in maternal sera significantly differentiates pregnant PE from normal pregnant women after 24 weeks’ of gestation.20 21 Later studies discovered that this ratio had limited value in predicting the development of PE when examined during the first or early second trimesters.22 23 Thus, there is an unmet need to identify sensitive and specific markers to predict PE early in gestation.
Previous studies have suggested that PE is a pregnancy complication that is associated with changes of multiple systems and encompasses genetic, proteomic and metabolic factors.24–28 Recent multi-omics studies identified a number of molecular-level candidates associated with PE.29–36 One of these candidates is leptin (Lep), a secreted adipokine that affects the central regulation of energy homoeostasis, neuroendocrine function and cytoplasmic metabolism.37 Lep can be expressed by both adipose and non-adipose tissues, which, during pregnancy, not only mediates the gestational energy homoeostasis,38 but also modulates various physiological events, such as implantation, placentation and immune adaption, that are essential for fetal development.39 Our previous findings have demonstrated elevations of Lep in early gestation in PE patients.23 25 40 41 Other have also reported that sphingolipid metabolism, particularly via ceramide (Cer), acts downstream to the anorectic actions of central Lep, and played an important role in Lep-induced hypothalamic control of feeding.42–44 Furthermore, our recent findings have also illustrated the regulatory role of Cer as a metabolic messenger for the homeostatic development of normal pregnancy along gestation,45 and placental changes in cytoplasmic amount of Cer in trophoblast cells have been shown to be implicated in the pathogenesis of PE.46–48
In this study, we employed an approach to identify Lep and Cer as potential biomarker candidates for risk of impending PE. This initial omics-based discovery led to the generation of our hypothesis that the gestational profiles of Lep and Cer differ in maternal serum from women without PE compared with those with PE. We further hypothesised that the ratio of Lep and Cer can serve as a serological marker capable of predicting impending PE early in gestation. We therefore characterised the serological profiles of circulating Lep and Cer longitudinally and investigated their potential utility in predicting impending PE early in pregnancy and biological insights.
Materials and methods
Study design
The overall sample allocation, hypothesis generation, biomarker discovery, independent confirmation and panel construction workflows are illustrated in figure 1. Our study was conducted in three phases1: the discovery phase, which included both in-silico expression analysis of PE and non-PE placentas and comprehensive literature mining to generated the hypothesis that Lep and Cer might be implicated in PE pathophysiology as potential biomarkers2; the testing phase, which measured the levels of Lep and Cer in a cohort of PE and non-PE maternal sera sampled at confirmative diagnosis3; the confirmation phase, which determined the levels of Lep and Cer in an independent longitudinal cohort of PE and non-PE maternal sera sampled at different gestational ages.

Schematic diagram of the study design. Cer, ceramide; DHCer, dihydroceramide; GA, gestational age; GEO, Gene Expression Omnibus; Lep, leptin; PE, pre-eclampsia; PlGF, placental growth factor; sFlt-1, soluble fms-like tyrosine kinase.
Patient and public involvement
Patients or the public were not involved in setting the outcome measures, study design and implementation, and dissemination plans of our research.
Meta-analysis of placental gene expression
Six PE placenta expression studies from Gene Expression Omnibus (GEO) datasets49–54 were combined and subjected to multiplex analysis with the method as we previously developed.55 56 Random effects analyses were applied to calculate the meta-fold change of each gene by considering both variances within the studies and variances between the studies. For gene expression measurements, this corresponds to combining fold-changes across studies to identify a meta-fold-change that is an amalgamation of the constituent studies. The meta p values were obtained by Fisher’s method. Significant genes were selected if they were measured in six studies and the meta effect p value was less than 4.5×10⁻⁵. This effort identified Lep as the leading protein biomarker candidate. The expressions of Lep transcript between non-PE and PE women were also compared in individual datasets.
Participants
Two independent cohorts of pregnant women were assembled for this study. The testing cohort included sera from women between 25 and 31 weeks’ of gestation with or without PE collected by ProMedDX (Norton, Massachusetts, USA). Each woman had one sample collected. All PE samples were collected at the time of confirmative diagnosis. Sample collection was approved by Institutional Review Boards in qualified investigator sites. Informed consent was obtained. Samples were collected between April 2008 and February 2010. The confirmation cohort included sera from women who participated in a longitudinal study sponsored by the March of Dimes Prematurity Center at Stanford University between November 2012 and May 2016. Each woman had multiple sera collected from 5 to 29 weeks’ of gestation prior to PE diagnosis.
The diagnosis of PE was made according to the American College of Obstetricians and Gynecologists criteria57 as follows: a persistent systolic blood pressure ≥140 mm Hg, or a diastolic blood pressure ≥90 mm Hg after 20 weeks’ of gestation in a woman having a previous normal blood pressure in conjunction with one or more of the following: new-onset proteinuria, new-onset thrombocytopenia, impaired liver function, renal insufficiency, pulmonary oedema, or visual or cerebral disturbances in the absence of proteinuria. Early-onset PE was defined as PE that develops before 34 weeks’ of gestation, whereas the late-onset PE develops at or after 34 weeks’ of gestation.
ELISA
Serum concentrations of Lep, sFlt-1 and PlGF were measured by quantitative sandwich ELISA using species-specific commercial kits from R&D System (Minneapolis, Minnesota, USA). The measurements were implemented for sera from both testing and confirmation cohorts by following the protocols provided by the manufacturer. Briefly, the serum samples were appropriately diluted with the calibrator diluent into the dynamic range and seeded onto 96-well plates coated with a monoclonal antibody that was specific for the targeted protein. Following 2-hour incubation at room temperature and adequate washing steps, another monoclonal antibody conjugated with horseradish peroxidase was added to the bound protein of interest. After washing away all unbound substances, a substrate solution was added to initiate the colorimetric reaction, and the absorbance was read out at 450 nm for measurement and 540 nm for correction using a Synergy HTX multi-mode reader from BioTek (Winooski, Vermont, USA). The concentration of targeted protein was calculated by plugging the absorbance value back into the calibration curve and then multiplying the dilution factor.
PubMed meta-analysis identified Cer as the downstream metabolic messenger of Lep cascade
To discover the potential metabolic messengers downstream of Lep signalling cascade, we conducted a literature mining study based on the PubMed database. With the keyword of “Leptin; Lipid Metabolism”, 4212 publications were obtained from years of 2000 to 2020. Among 4212 publications, 78 studies were designed to investigate the biology underlying the cytoplasmic interactions between Lep and Cer at the molecular level. Afterwards, 14 and 150 publications were obtained by searching the keywords of “Ceramide; Pregnancy” and “Ceramide; Preeclampsia”, respectively, suggesting potential mechanistic implications of Cer in PE pathophysiology. Based on these results, Cer and its biosynthetic precursor dihydroceramide (DHCer) were selected as the biomarker candidates to generate our hypothesis and launched the following analyses.
Liquid chromatography-tandem mass spectrometric analysis
Serum concentrations of 16 Cers and 10 DHCers were measured by liquid chromatography-tandem mass spectrometric assay. The measurements were implemented for sera by the analytical methodology as previously described.45 In brief, 10 µL of serum was extracted with methanol containing deuterated Cers to remove the proteins. Following vigorous vortex and centrifuge, 10 µL of supernatant was injected onto a C18 reverse phase column, separated by an isocratic elution programme using a mixture of methanol and 2-propanol as the mobile phase, and detected by a TSQ Quantiva tandem mass spectrometer from Thermo Fisher (San Jose, California, USA) using selected reaction monitoring with scheduled retention time windows. The method employed 13 light Cers as reference standards and four heavy Cers as internal standards for quantitation. The matrix-matched calibration curves were established across biologically relevant concentrations using the delipidised serum for targeted Cers and DHCers, and linear regression fitting with a weighting factor of 1/×2 was applied for building the calibration. The concentrations of targeted Cers and DHCers were calculated by plugging the analyte-to-IS response ratios into the corresponding calibration curves using XCalibur V.4.0 software package from Thermo Fisher. The method was validated for the lower limit of quantitation, linearity, precision, accuracy, recovery, stability and carryover according to 2018 Food and Drug Administration bioanalytical guideline for industry.
Statistical analyses
The differentiating power of each gene in non-PE and PE placental tissues from multiple GEO datasets was combined by meta-analysis. The optimal Cer marker in women’s serum was determined by Mann-Whitney U test p value, fold change and area under the curve (AUC) in the testing cohort. AUC of Lep, the optimal Cer marker and Lep/Cer ratio in predicting PE was calculated in the confirmation cohort. Sensitivity, specificity, positive predictive value (PPV) and negative predictive value (NPV) of Lep/Cer ratio were calculated by patients. A woman was labelled as ‘PE’ if the Lep/Cer (d18:1/25:0) ratio exceeded the threshold in at least one of the serial samplings. A time-to-event analysis was performed to calculate the gap between the time of prediction and the time of confirmatory diagnosis of PE. Results were compared with a reference point sFlt-1/PlGF ratio. Statistical analyses were preformed using R packages.58
Results
Meta-analysis confirmed the significant elevation of placental Lep expression in PE placentas
To test the ability of placental Lep levels to differentiate non-PE from PE pregnancies, we performed a meta-analysis of gene expression profiles based on six PE placental studies (GSE4707, GSE10588, GSE24129, GSE25906, GSE44711 and GSE54618; see table 1). Among the 10 525 genes, Lep in PE placentas had the maximal change (3.9-fold) and the most significant difference (p<0.0001) compared with non-PE placentas (figure 2 and online supplemental appendix 1). In each study, Lep levels were higher in PE compared with non-PE placentas (p<0.05; figure 3). The overexpression of the Lep transcripts was found to be significant in all PE women (including early-onset, late-onset, and severe PE). Furthermore, in each study, Lep had a significantly higher fold change (p<0.0001) than Flt-1 between PE and non-PE (GSE4707: 1.5 vs 0.8; GSE10588: 5.0 vs 2.1; GSE24129: 3.2 vs 1.3; GSE25906: 2.1 vs 0.6; GSE44711: 8.4 vs 1.9; GSE54618: 3.5 vs 0.9). All fold changes were log2 transformed.
Supplemental material
Microarray datasets for meta-analysis on leptin levels in placentas from non-PE and PE women

Meta-analysis identified differentially expressed genes in placentas from pre-eclamptic (PE) women. Volcano plot, log2(fold changes) on the x-axis and –log10(P) on the y-axis, was used to evaluate the performance of each placental gene that differentiates PE from non-PE women.
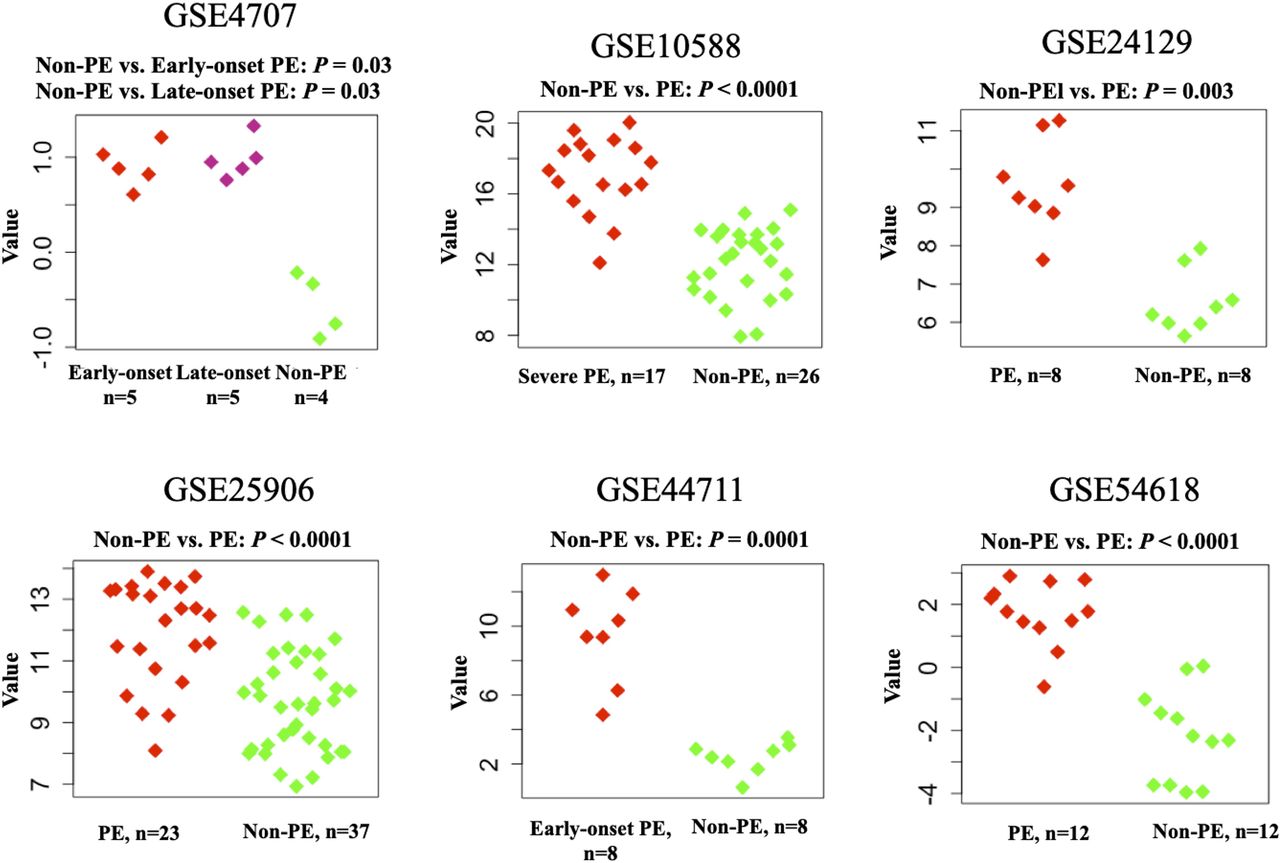
Transcriptional quantification of leptin genes: a comparison between non-PE and PE placental expressions at delivery. PE, pre-eclampsia.
Serological quantitative analysis confirmed Lep, Cer and DHCer as maternal markers for PE at diagnosis
We measured levels of circulating Lep in women from the testing cohort (testing cohort included 7 non-PE and 8 PE women; demographic data are shown in table 2). Concentrations of Lep were significantly higher in PE women than in women without PE between 25 and 31 weeks’ of gestation (p=0.02, 2.97-fold; figure 4A, online supplemental appendices 2 and 3).
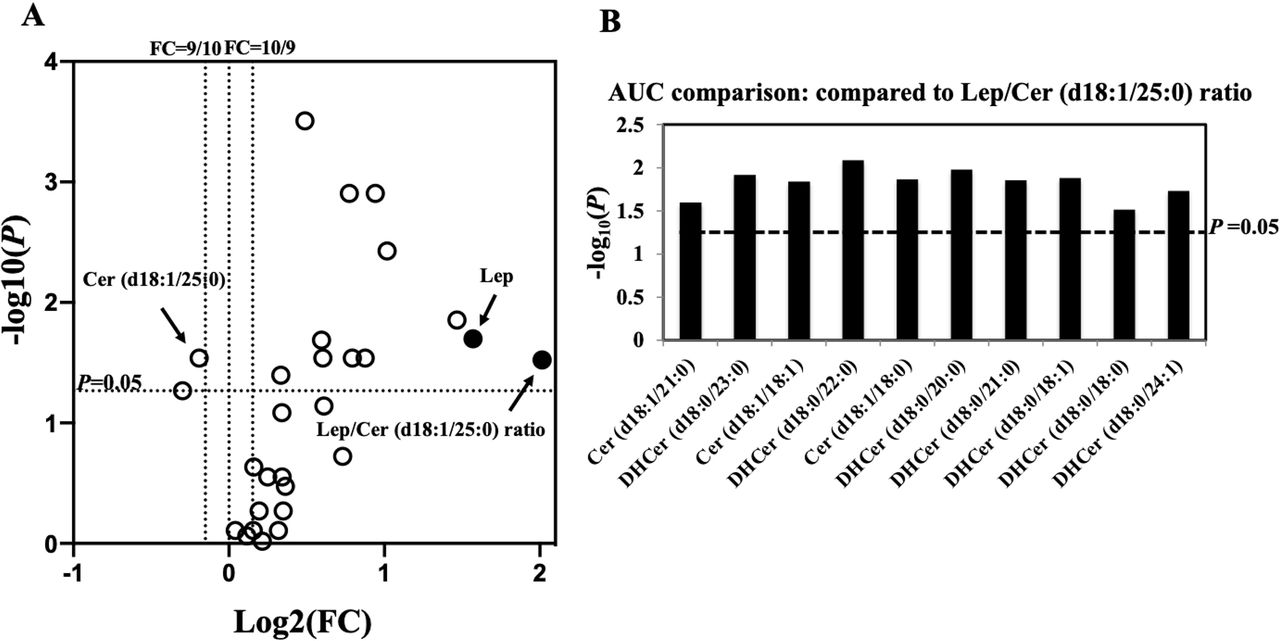
Comprehensive mass spectrometric analyses of 26 Cers/DHCers for pre-eclampsia (PE) diagnosis in the testing cohort. (A) Fold change of each analyte between non-PE and PE women. A total of 11 Cers had p<0.05. (B) Area under curve (AUC) comparison between Lep/Cer (d18:1/25:0) ratio and other 10 Lep–Cer combinations using each of the significant Cers in conjunction with Lep. DeLong test p were calculated (the y-axis). Cer, ceramide; DHCer, dihydroceramide; Lep, leptin.
Demographics of the testing cohort
We also characterised gestational profiles of 26 metabolite candidates in maternal sera, which included 16 Cers and 10 DHCers (figure 4, online supplemental appendix 2 and 3). A total of 11 candidates (4 Cers and 7 DHCers) were significantly altered in PE (p<0.05, false discovery rate <0.05; figure 4A). We calculated the AUCs of the ratios of Lep and each of the 11 candidates and found that Lep/Cer (d18:1/25:0) had the largest AUC for differentiating PE from non-PE women (online supplemental appendix 4). The AUC of Lep/Cer (d18:1/25:0) was significantly larger than other 10 ratios (p<0.05; figure 4B).
The Lep/Cer (d18:1/25:0) ratio had the largest AUC compared with other marker combinations (figure 4B and online supplemental appendix 4) for differentiating PE from non-PE women in the testing cohort. Furthermore, compared with the individual Lep and Cer (d18:1/25:0) levels, the Lep/Cer (d18:1/25:0) ratio showed a larger fold change (4.04 vs 2.97 and 0.88, respectively) and a higher AUC (0.911 vs 0.875 and 0.839, respectively; table 3 and online supplemental appendix 5).
Maternal serum leptin (Lep)/Cer (d18:1/25:0) ratio at 25–31 weeks’ GA is a strong marker of pre-eclampsia in the testing cohort
Analysis found that Lep/Cer (d18:1/25:0) ratio predicts PE early in gestation
When we evaluated the predictive performance of the Lep/Cer (d18:1/25:0) ratio in the confirmation cohort (20 women without PE with 55 samples, and 20 women with PE with 51 samples; see table 4 and figure 5), We found that among the 20 PE women, 5 and 13 had early-onset and late-onset PE, respectively. The dates of diagnosis were missing in the remaining 2 women.
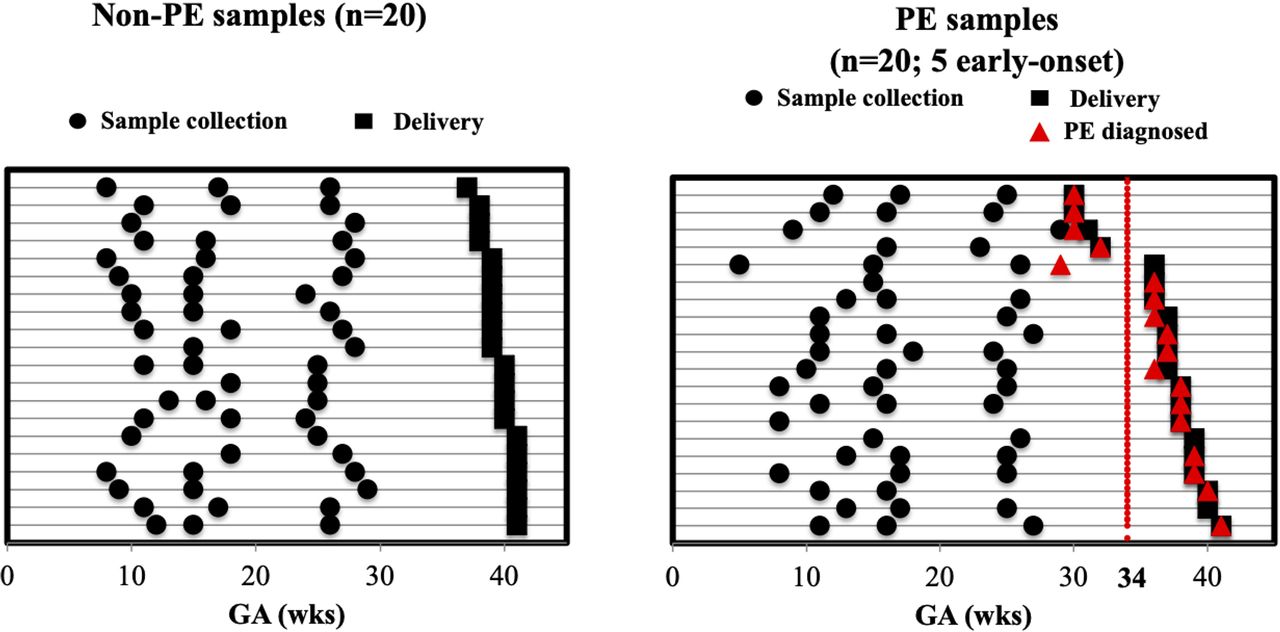
Sample collection timelines from the confirmation cohort: serial blood sampling from each non-pre-eclampsia (PE) and PE woman at different gestational ages (GAs). Times of sample collection, delivery and confirmatory PE diagnosis of each woman (denoted by each row) are represented by black circles, black squares and red-filled triangles, respectively.
Demographics of the confirmation cohort
We observed an increase in serum Lep (p<0.0001; 1.71-fold) and a decrease in Cer (d18:1/25:0) (p<0.0001; 0.70-fold) in PE women at 5–29 weeks’ of gestation (online supplemental appendix 6A and B), which resulted in an elevated Lep/Cer (d18:1/25:0) ratio (figure 6 and online supplemental appendix 6C). Most notably, this ratio was a significantly better predictor of all types of PE (AUC=0.887) than Lep (AUC=0.809; p=0.0006) or Cer (d18:1/25:0) (AUC=0.790; p=0.008) levels alone. In addition, the ratio performed well at wider gestational windows from 5 to 15 and 16 to 29 weeks (AUC=0.876 and 0.892, respectively) than the individual markers: Lep (AUC=0.868; p=0.4 and 0.824; p=0.1, respectively) and Cer (d18:1/25:0) (AUC=0.868; p=0.1 and 0.747; p=0.02, respectively). The longitudinal profiling of Lep and Cer (d18:1/25:0) levels improved the predictive performance of Lep/Cer (d18:1/25:0) ratio. Moreover, the Lep/Cer (d18:1/25:0) ratio outperformed the sFlt-1/PlGF ratio in predicting impending PE, with a higher AUC (p<0.0001; online supplemental appendix 6D). A comparison of AUC between different Cers and DHCers was shown in online supplemental appendix 7.

Comparisons of maternal serum levels between non-PE and PE pregnancies in the confirmation cohort. Left: Lep/Cer (d18:1/25:0) ratio. Right: sFlt-1/PlGF ratio. Cer, ceramide; Lep, leptin; PE, pre-eclampsia.
Time-to-event analysis at 5–25 weeks (figure 7) compared the Lep/Cer (d18:1/25:0) ratio and the sFlt-1/PlGF ratio in predicting the impending PE. Among the 18 PE women with known diagnoses dates, 83% (15/18; 5 early-onset and 10 late-onset) were identified by the Lep/Cer (d18:1/25:0) ratio 11 or more weeks prior to their clinical diagnosis. In contrast, the sFlt-1/PlGF ratio only identified 22% (4/18; 1 early-onset and 3 late-onset) of PE women 11 or more weeks prior to the diagnosis. The Lep/Cer (d18:1/25:0) ratio was able to predict impending PE a median of 23.0 (95% CI 12.8 to 30.7) weeks prior to the confirmatory diagnosis.

Comparative analysis between the ratios of Lep/Cer (d18:1/25:0) and sFlt-1/PlGF in predicting impending PE. X-axis: the duration of time (weeks) from the sampling to PE confirmatory diagnosis. Y-axis: the percentage of the PE women who were identified as high-risk within the specified duration before a confirmatory diagnosis. Cer, ceramide; Lep, leptin; PE, pre-eclampsia; PlGF, placental growth factor; sFlt-1, soluble fms-like tyrosine kinase.
As shown in figure 8, the Lep/Cer (d18:1/25:0) ratio correctly classified 85% (17/20) of women with impending PE and 90% (18/20) of pregnancies without PE at 5–25 weeks, giving a sensitivity of 85% (17/20; 5/5 early-onset, 10/13 late-onset and 2/2 unknown), a specificity of 90% (18/20), a PPV of 89% (17/19) and an NPV of 86% (18/21). In contrast, 20% (4/20; 4/20; 1/5 early-onset and 3/13 late-onset) of women with subsequent PE were correctly classified by the sFlt-1/PlGF ratio, yielding a sensitivity of only 20% (4/20), and an NPV of 56% (20/36) (figure 8). In addition, the Lep/Cer (d18:1/25:0) ratio had a higher AUC than the sFlt-1/PlGF ratio at 5–25 weeks (0.92 (95% CI 0.86 to 0.98) vs 0.52 (95% CI 0.39 to 0.64); p<0.001; online supplemental appendix 8).

Individual-level performance of the Lep/Cer (d18:1/25:0) ratio and the sFlt-1/PlGF ratio in predicting impending PE. (Top) 2×2 table. (Bottom) Sensitivity, specificity, positive predictive value and negative predictive value. Cer, ceramide; Lep, leptin; GA, gestational age; PlGF, placental growth factor; sFLT-1, soluble fms-like tyrosine kinase.
Discussion
Early prediction of PE remains a challenge in current clinical practice. Known traditional risk factors inadequately identify women who will develop PE early in gestation.12 14 22 23 To aim the discovery of novel serological markers with better predictive power for PE at early gestations, we applied a data-driven approach, integrating differentially expressed genes from placental mRNA expression multiplex analysis and sphingolipids from serological quantitative profiling, to identify novel PE biomarkers, which are Lep and Cer. By characterising the maternal serological profiles of Lep and Cer using commercial ELISA and reported LC/MS/MS assays, we validated the higher concentrations of Lep and lower concentrations of Cer (d18:1/25:0) in a testing cohort with maternal sera collected at confirmative diagnosis of PE. With a cohort of longitudinally collected maternal sera from both PE and non-PE women, we further assessed the PE-predictive power of the Lep/Cer (18:1/25:0) ratio early in gestation. Our results validated this ratio as a better serological predictor of impending PE than the established sFlt-1/PlGF ratio. Our findings demonstrated that the use of the Lep/Cer (d18:1/25:0) ratio can identify women at high risk of developing PE at a substantially earlier time window during pregnancy (at 5–25 weeks) than the sFlt-1/PlGF ratio (after 25 weeks). An interesting observation that the Lep/Cer (d18:1/25:0) ratio worked for a mixed of early and late onset PE women which suggests common pathways. The clinical utility of the Lep/Cer ratio of early and late onset PE women shall be validated in a prospective cohort of a sample size with sufficient statistical power. The biology, underlying Lep/Cer ratio’s ability to predict both early and late PEs, may have potentially different aetiology and will need additional exploration of its mechanism of action. Moreover, our results showed that, compared with the sFlt-1/PlGF ratio, the Lep/Cer (d18:1/25:0) ratio has better sensitivity (20% vs 85%) and NPV (56% vs 86%). Therefore, early in gestation, the Lep/Cer (d18:1/25:0) ratio outperforms the established sFlt-1/PlGF ratio and is a predictor of impending PE. The fact that the Lep/Cer (d18:1/25:0) ratio increases early in gestation in pregnant women who later develop PE offers an opportunity for predicting PE prior to the onset of clinical signs and symptoms. Integration of the ratio into a high-risk screening tool might allow patient identification at a presymptomatic stage. In addition, the concept of integrating a transcriptomic approach in placenta tissue with a sphingolipidomic approach in serum is novel, as it combines the merits of studies in tissue which focuses more towards the pathogenesis and pathophysiology with those study in serum which focuses more towards the clinical translation. Taking the candidates obtained from the discovery phase to the confirmation phase makes the findings of this study translatable into clinical practice.
Previous studies have suggested that placental trophoblast cells are a leading source of circulating Lep in pregnancy,38 where Lep increases progressively in the first and second trimesters, peaks in the third, and returns to pre-pregnancy levels prior to parturition.59 60 In early gestation, Lep may play a critical role in modulating essential biological activities such as proliferation, protein synthesis, invasion and apoptosis of trophoblast cells.61 62 Failure of trophoblastic invasion might result in incomplete remodelling of the maternal spiral arteries and inadequate placental perfusion to the embryo,63–65 leading to various disorders of reproduction and gestation such as intrauterine growth restriction,66 PE,67 gestational diabetes mellitus68 and recurrent miscarriage.69 Other recent studies documented significant elevations of Lep expression in placentas with PE.70–74 In the current study, we found a significantly higher concentration of Lep in maternal sera of PE women, which is consistent with previous reports.69–73
The gestational dysregulation of Cer metabolism is believed to induce the aberrant de novo synthesis and lysosomal breakdown of Cer, which leads to trophoblast cell autophagy, dysfunctional development of placenta and eventually pregnancy complications like PE.46 48 75 Cer (d18:1/25:0) is an unusual odd-chain species of the Cer family that is generated by de novo synthesis based on 25:0 fatty acid. Such odd-chain fatty acids are mainly from dairy products and meat from ruminant animals.76 Cer (d18:1/25:0) was previously described as a potential urinary marker of inflammation-induced alcoholic liver disease.77 Recently, an elevation of the Cer (d18:1/25:0) was also identified as a serum prognostic marker to predict various acute diseases, including cardiovascular death, myocardial infarction and stroke in patients with acute myocardial infarction within an ensuing 12-month period.78 Our results suggested the pathological implications of Cer (d18:1/25:0) in the development of pregnancy complicated by PE, which might provide additional insights into the mechanistic roles of Cer (d18:1/25:0) and other odd-chain Cer species in PE pathophysiology.
An association between Lep and Cer has been reported in several studies. Lep was shown to exert its anorexigenic action by promoting mitochondrial lipid oxidation in both adipose and non-adipose tissues to alleviate ectopic accumulation of lipotoxic Cer via the activation of AMP-activated protein kinase (AMPKK/AMPK).79 80 The de novo synthesis of Cer was found to play prominent roles in modulating downstream signalling of central Lep’s activity via mediation of malonyl-CoA, carnitine palmitoyl transferase-1c and serine palmitoyl transferase.42–44 Persistent elevation of circulating Lep also appears to induce resistance at the level of the Lep receptor, which accounts for attenuated potency of Lep to alleviate the accumulated cytotoxic Cer.42–44 Our data suggest a crosstalk between Lep’s activity and de novo Cer synthesis. Lep functions well as a predictor of PE early in gestation, while Cer (d18:1/25:0) performs better at mid-gestation. The Lep/Cer (d18:1/25:0) ratio has a better predictive performance than Lep or Cer (d18:1/25:0) levels alone. Our findings revealed a correlation between the biological patterns of the two markers during PE progression, which might add value to existing knowledge about the Lep–Cer relationships.
Our study has several limitations. First, the comparative analysis was of small sample size and not racially balanced. All control samples in the confirmation cohort came from white women, while case samples were collected from mixed racial groups. Thus, the generalisability of the results awaits larger and more racially diverse study populations. Second, clinical information, such as body mass index, proteinuria, blood pressure, medication, concurrent medical condition, pregnancy history and smoking history, were not available for control samples in the testing cohort. Information of proteinuria, blood pressure and medication were missing for samples in the confirmation cohort. Third, we did not measure the Lep/Cer (d18:1/25:0) ratio in non-pregnant women or women after delivery so that ratio expression baseline can be determined. Fourth, we need to validate the performance of the Lep/Cer (d18:1/25:0) ratio in early gestation in a prospective study. Finally, we did not investigate the exact tissue of origin, where Lep is overexpressed in PE women. By using a conditional knock-in placental Lep transgenic mouse model, it may be possible to elucidate the mechanistic role of placental Lep in the pathogenesis of PE early in pregnancy.
Conclusions
The disruptions of gestational homoeostasis involving placenta-related biological networks are important factors contributing to the pathophysiology of PE. Lep, an endocrine regulator of body energy repletion, and Cer (d18:1/25:0), a bioactive metabolic messenger downstream of Lep, were identified to be significantly increased and decreased in the maternal circulation of women with PE. The Lep/Cer (d18:1/25:0) ratio was demonstrated to provide augmented predictive power in differentiating PE from a pregnancy without PE before a confirmatory diagnosis can be made. The maternal Lep/Cer (d18:1/25:0) ratio, with an earlier elevation in gestation, is a superior prognostic marker than the sFlt-1/PlGF ratio. If validated as a laboratory developed test or in vitro diagnostics, the deployment of the Lep/Cer ratio test to assess PE and proactively manage asymptomatic early pregnancies should have profound impact on PE care.
Data availability statement
Data are available upon reasonable request. The datasets used and/or analyzed in this study are available upon request to the corresponding author.
Ethics statements
Patient consent for publication
Ethics approval
This study was approved by ethics committees at Stanford University with an IRB of 21956 starting from 30 September 2011. Written informed consent was obtained from all participants.
Acknowledgments
We thank our colleagues in the March of the Dimes Prematurity Research Center at Stanford University and Pediatrics Proteomics Group for critical discussions.
References
Supplementary materials
Supplementary Data
This web only file has been produced by the BMJ Publishing Group from an electronic file supplied by the author(s) and has not been edited for content.
Footnotes
QH, SH and JY are joint first authors.
Twitter @blackwpcenter
Correction notice This article has been corrected since it was first published. The author byline and affiliation section has been updated.
Contributors XBL is the guarantor. XBL, KGS and HJC contributed to concept development and design. JY, RJW and DKS contributed to the acquisition of data. QH, SH, XY, JY, ZL, JS, ZL, ST, WL, XZ, LM, SL, SRD-B, HZ, DF, RJW, GMS, DKS, JCW and DBM contributed to the analysis and interpretation of data. QH and SH drafted the manuscript. XY, JY, ZL, JS, ZL, ST, WL, XZ, LM, SL, SRD-B, HZ, RJW, GMS, DKS, HJC, JCW, DBM, KGS and XBL critically revised the manuscript. All the authors gave final approval of the version to be submitted and agreed to be accountable for all aspects of the work.
Funding The authors have not declared a specific grant for this research from any funding agency in the public, commercial or not-for-profit sectors.
Competing interests None declared.
Provenance and peer review Not commissioned; externally peer reviewed.
Supplemental material This content has been supplied by the author(s). It has not been vetted by BMJ Publishing Group Limited (BMJ) and may not have been peer-reviewed. Any opinions or recommendations discussed are solely those of the author(s) and are not endorsed by BMJ. BMJ disclaims all liability and responsibility arising from any reliance placed on the content. Where the content includes any translated material, BMJ does not warrant the accuracy and reliability of the translations (including but not limited to local regulations, clinical guidelines, terminology, drug names and drug dosages), and is not responsible for any error and/or omissions arising from translation and adaptation or otherwise.