Article Text

Abstract
Objective To rank and score 180 countries according to COVID-19 cases and fatality in 2020 and compare the results to existing pandemic vulnerability prediction models and results generated by standard epidemiological scoring techniques.
Setting One hundred and eighty countries’ patients with COVID-19 and fatality data representing the healthcare system preparedness and performance in combating the pandemic in 2020.
Design Using the retrospective daily COVID-19 data in 2020 broken into 24 half-month periods, we applied unsupervised machine learning techniques, in particular, hierarchical clustering analysis to cluster countries into five groups within each period according to their cumulative COVID-19 fatality per day over the year and cumulative COVID-19 cases per million population per day over the half-month period. We used the average of the period scores to assign countries’ final scores for each measure.
Primary outcome The primary outcomes are the COVID-19 cases and fatality grades in 2020.
Results The United Arab Emirates and the USA with F in COVID-19 cases, achieved A or B in the fatality scores. Belgium and Sweden ranked F in both scores. Although no African country ranked F for COVID-19 cases, several African countries such as Gambia and Liberia had F for fatality scores. More developing countries ranked D and F in fatality than in COVID-19 case rankings. The classic epidemiological measures such as averages and rates have a relatively good correlation with our methodology, but past predictions failed to forecast the COVID-19 countries’ preparedness.
Conclusion COVID-19 fatality can be a good proxy for countries’ resources and system’s resilience in managing the pandemic. These findings suggest that countries’ economic and sociopolitical factors may behave in a more complex way as were believed. To explore these complex epidemiological associations, models can benefit enormously by taking advantage of methods developed in computer science and machine learning.
- COVID-19
- epidemiology
- statistics & research methods
- public health
Data availability statement
Data are available in a public, open access repository. The data used for this analysis were from publicly available sources. The data, codes, and algorithms are available upon request by emailing RCH.
This is an open access article distributed in accordance with the Creative Commons Attribution Non Commercial (CC BY-NC 4.0) license, which permits others to distribute, remix, adapt, build upon this work non-commercially, and license their derivative works on different terms, provided the original work is properly cited, appropriate credit is given, any changes made indicated, and the use is non-commercial. See: http://creativecommons.org/licenses/by-nc/4.0/.
Statistics from Altmetric.com
Strengths and limitations of this study
Applying unsupervised machine learning method to reveal hidden patterns in COVID-19 data.
Comparing the results with classical epidemiological methods used in other published studies.
Comparing the results among countries within similar area and population size groups.
Potential misclassification of COVID-19 cases and fatality numbers due to lack of a unified definition, case finding method and diagnostic procedure.
Lack of any validation study against a gold standard in preparedness and disease management measures.
Introduction
After centuries of confronting international public health emergencies, world health authorities have accumulated an enormous amount of experience and knowledge regarding countries’ preparedness for pandemics. The potential transnational spread of infectious diseases makes it imperative that all countries are prepared to an adequate level. Preparedness is a complex construct to measure due to its multifactorial predictors at every level of a country’s structure and functionality. Previous efforts to assess countries’ pandemic preparedness, such as the WHO Joint External Evaluation (WHO-JEE)1 and the RAND pandemic preparedness project,2 were based on available data reflecting countries’ attributes and expert opinions.
In the 58th World Health Assembly in 2005, the assembly adopted the International Health Regulations resulting in the development of the JEE taskforce to assess countries’ preparedness for infectious outbreaks. The JEE developed a questionnaire tool targeting three capacity domains including prevention, detection and rapid response to public health threats.1 The JEE evaluation emphasised the importance of countries’ voluntary participation, a multisectoral approach, evaluation by both external experts and countries’ internal self-assessment, data transparency and information sharing. Countries’ preparedness improvement was envisioned as a continuous effort towards preset international targets through recurring assessments every 5 years. Each JEE capacity domain has an indicator score ranging from ‘1’ (implementation has not occurred) to ‘5’ (implementation has occurred, been tested, reviewed and exercised and that the country has a sustainable level of capability for the indicator). For each domain, a country receives a single score based on their current capacity level.
In 2016, the International Security and Defense Policy Center of the RAND National Defense Research Institute created the Infectious Disease Vulnerability Index, a data-driven tool incorporating seven domains that influence countries’ vulnerability to outbreaks. Domains include demography, healthcare, public health, disease dynamics, domestic policies, international policies and economy.2 The RAND research team used available data, including WHO and World Bank databases, along with experts’ opinion to calculate the Indexed Vulnerability Scores (IVS) for each country. Scores range between 0 (most vulnerable to infectious disease outbreaks) and 1 (most resilient). One hundred and eighty-eight countries were evaluated and ranked by overall IVS and the seven domain scores. In an empirical analysis of the vulnerability algorithm using Zika (2015–2016) and Ebola (2014–2015), the final report concluded that the IVS tool did not predict success or failure in outbreak response.3 From December 2019 when COVID-19 was first identified in Wuhan, China, to 11 March 2020, when the WHO declared a pandemic, there were 118 000 confirmed COVID-19 cases in 114 countries.4 By the end of 2020, there were 83 872 473 confirmed cases and 1 826 809 deaths, worldwide.5 World health authorities provided guidelines and leadership to contain the virus, yet countries’ responses to the virus varied. Containing an outbreak and adopting strategies to slow the spread of a virus requires a high level of public health emergency preparedness and coordination. The total number of cases relative to the population in a country can serve as a proxy for the country’s preparedness and a performance measure reflecting how effectively the systems function. Fatality, however, can be a proxy measure for crisis management with respect to healthcare system capacity and flexibility to offer targeted care.
This paper applies hierarchical clustering analysis (HCA) to rank and score 180 countries according to COVID-19 cases and fatality in 2020. We also compare our results to WHO-JEE and RAND predictions and outcomes generated by standard epidemiological scoring techniques.
Methods
Data
In this retrospective observational study, we used three data sources. The number of countries with full data varied across sources.
COVID-19 data: we used the Oxford COVID-19 Government Response Tracker to obtain COVID-19 cases per day and fatality for 180 countries from 1 January to 31 December 2020.6
RAND data: we used the overall IVS and seven domain scores for 195 countries.3
WHO-JEE data: we used the Ready Score and four subscores (prevent, detect, respond, and other) for 98 countries.7
Patient and public involvement
This study was solely by using publicly available data, and there was no patient or public involvement in any part of the study or final report.
Clustering analysis
In machine learning, most algorithms can be broadly divided into two categories: supervised and unsupervised algorithms. While supervised algorithms aim to learn the relationship between input data and the response variable, unsupervised algorithms provide a way to uncover hidden structure within a dataset. Cluster analysis is a set of unsupervised algorithms that aim to group n observations into K groups (clusters), where intragroup observations are similar and intergroup observations are more distinct. There are several popular clustering algorithms, including K-Means and HCA. Our analysis uses HCA to cluster similar countries into groups. We used agglomerative hierarchical clustering as it is more popular and intuitive than divisive hierarchical clustering. We broke the year into 24 half-month periods and clustered countries into K=5 groups within each period according to their cumulative COVID-19 fatality per day over the year and cumulative COVID-19 cases per million population per day over the half-month period. By clustering on a half-month basis, the scoring process accounts for time-related factors shared by countries. In each period, each observation represents a country with roughly 15 measurements.
Country categories
Country size influences population-adjusted rankings of COVID-19 outcomes. To provide a fair comparison, we divided countries into three categories based on population and land area. We did this via hierarchical clustering with the Euclidean measure between observations’ distance and the Ward criterion for forming the clusters.8 The variables used were the z-score standardised logarithmic transformation of population and land area (in km2). Four clusters initially categorised countries into micro, small, medium and large sizes. The micro and small countries were combined to form a larger group of small countries. The resulting categories were small (n=58), medium (n=60) and large (n=62). Clustering of cumulative fatality and cumulative cases per million population was performed separately on each subcategory.
Half-month cases per million population
We calculated the cumulative COVID-19 new cases per million population for each day in half-month periods. We used cumulative case counts to have a picture of changes in the overall case rate trend within a 2-week period (half a month) and avoid the random variation of the daily new case count. This measure is set back to zero at the beginning of each half-month period. As we lived through the pandemic, more information was provided, and various policies were implemented, hence resetting the case count helps explore the impact of time on each country. By using the per million population unit in the denominator, incidence numbers were comparable across countries with different population sizes. Cluster analysis was performed as described previously. Each country was given a score based on the assigned cluster, with a score of 1 presenting a cluster with the highest and 5 the lowest average cases per million population. Due to the low number of COVID-19 cases in the first half of January, these data were omitted during the clustering process. The analysis included 23 half-month period clustering results for cases per million population (mid-January to December).
Half-month cumulative fatality
We calculated the cumulative fatality per day for each country by taking the ratio between the cumulative COVID-19 deaths and cumulative COVID-19 cases on each day. Clustering and scoring were performed as described previously, where a score of 1 indicating the group with the highest fatality. Due to the low number of COVID-19 deaths in January, we omitted these data when performing the clustering analysis. The resulting analysis yielded 22 half-month period clusters for fatality (from February to December). It is conventional to standardise the data (by subtracting each measure from the mean and dividing by the SD) before performing clustering to avoid unequal contribution due to uneven scales. Even though uneven scales in our variables are unlikely, we performed scaling as a sanity check. We conducted the same analysis with scaled data and discovered no significant difference, hence the unscaled version is presented.
In contrast with the cumulative cases, the cumulative fatality was not reset to zero at the beginning of each half-month period. Deaths are independent that implies that an individual’s death does not change the risk of other cases to die. The case counts, however, are dependent measures: the higher number of new cases results in the higher likelihood of contracting the disease. Consequently setting the cumulative case counts back to zero enables us to detect countries’ other time-dependent factors such as shifting in public health policies.
Final scores, quarterly scores and grades
Our primary analysis yielded 22 fatality and 23 case scores for each country. We used the average of the period scores to assign countries final scores for each measure. We normalised the final scores such that all scores are within the range of 0–1. For each final score Xi, the normalised version is (Xi – Xmin) / (Xmax – Xmin), where Xmin and Xmax are the minimum and maximum final scores for fatality and cases. Normalisation was done separately for each of the three country size categories, and normalised final scores are presented.
To assess the evolution of clusters from a broader perspective, we repeated our primary analysis using 3-month periods and assigned quarterly scores. No averaging was done for this subanalysis.
We translate results into A, B, C, D and F grades, where A is excellent and F is the worst grade in performance. Quarterly grades are equivalent to the clusters, while overall 2020 grades are based on five equal segments of the normalised final scores (ie, scores from 0 to 0.19 are F, from 0.20 to 0.39 are D and so on.)
Comparison points
For comparison with standard epidemiological methods, we present both case and fatality ‘naïve averages’ as well as 31 December values. Naïve averages were calculated by first averaging COVID-19 cases per million population and cumulative fatality values for 22 and 23 half-month periods, respectively, for each country. Then half-month averages were averaged into a final value for each country and measure combination. December 31 values reflect the total numbers of COVID-19 cases per million population and cumulative fatality over the year.
Patient and public involvement
Patients or the public were not involved in the design, conduct, reporting or dissemination plans of our research.
Results
Figure 1 presents two sets of world maps, one for COVID-19 case final scores and one for COVID-19 fatality final scores. Each set is broken down into three groups of small, medium and large countries. Table 1 presents the list of countries with C, D and F grades for COVID-19 cases, both by quarter and for 2020. Among the small countries, Andorra, Bahrain, Luxembourg, Panama, Qatar and San Marino received an F for 2020. Among the medium countries, Belgium, Israel, Oman, Switzerland, Sweden and United Arab Emirates were graded F for 2020. Finally, among the large countries, Spain and the USA received an F for 2020. Looking at the quarterly breakdown, all the countries with an overall F grade had C, D or F in at least one quarter.

Hierarchical cluster analysis scores based on country size. 0 reflects worst scores, 1 reflects best scores.
Quarterly and the year C, D and F grades of COVID-19 cases in 2020
Table 2 presents the list of countries with C, D and F grades of COVID-19 fatality, both by quarter and for 2020. Among the small countries, Bermuda, Gambia, Guyana, Ireland, San Marino and Puerto Rico ranked F. In the medium countries, Belgium, Ecuador, Hungry, Liberia, Netherlands and Sweden ranked F. Among the large countries, only Yemen received F for 2020 and in most quarters (online supplemental file provides the score ranks for the 180 countries).
Supplemental material
Quarterly and the year C, D and F grades of COVID-19 fatality in 2020
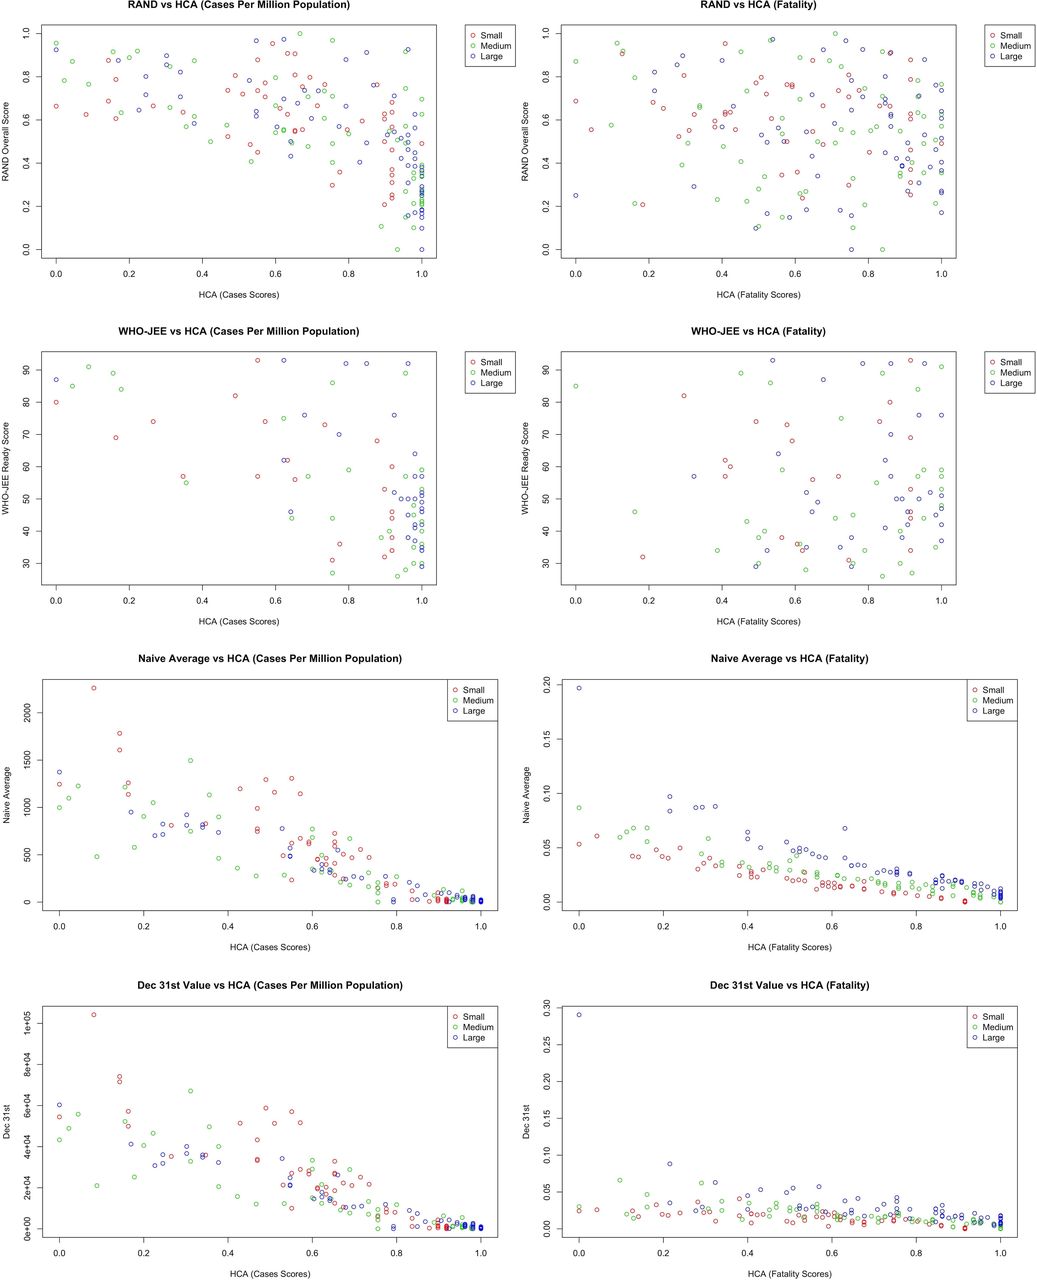
Figure 2 shows the scatter plots of the RAND, WHO-JEE, naïve average and 31 December score distributions against HCA scores. The pandemic preparedness scores calculated by RAND and WHO-JEE had no relationship with COVID-19 cases or fatality measures. In correlation analysis (details in web reference), there was consistently an inverse relationship between the WHO-JEE and RAND scores with the HCA scores. The closest correlation between RAND and HCA was −0.10 for fatality in large countries. For WHO-JEE, the closest correlation was 0.05 for fatality in small countries. Among the RAND subcategory domains, disease dynamic had the highest correlation with the HCA scores, with a value of 0.10 for fatality in small countries. For JEE, the closest correlation was 0.17 for fatality for small countries in the detect subcategory. Both naïve averages and 31 December values have closer alignment with HCA scores. For naïve averages, correlations range from 0.88 to 0.97 for cases and 0.92 to 0.97 for fatality. For 31 December values, correlations range from 0.88 to 0.97 and 0.64 to 0.80 for cases and fatality, respectively (the HCA values were inversed to follow the same direction as averages).
Scatterplot comparisons between RAND, WHO-JEE, naive average, 31 December and hierarchical cluster analysis (HCA).
Discussion
With 83 872 473 confirmed cases and 1 826 809 deaths due to COVID-19 in 2020, there is a growing need to examine countries’ performance in controlling the virus and managing infected cases. The assessment of health policies and preventive interventions needs to be based on a robust performance evaluation methodology. In classic epidemiology, different measures of normalised counts such as averages, and rates are common methods of scoring performances. These measures either present the central tendency (ie, arithmetic mean, mode or median) or the peripheral distribution (ie, SD or percentiles) and fall short in capturing the behaviour of data over time and relative to other data points. In terms of the COVID-19 pandemic and ranking countries’ performance, there are several epidemiological characteristics that need to be considered in evaluation studies. Knowledge about COVID-19 transmission and pathophysiology was an emerging phenomenon and as a result guidelines and policies were updated continuously over time. Some countries prioritised their economy over complete shutdown and chose herd immunity over transmission prevention, whereas others enforced more restrictive policies, such as sheltering in place and closing non-essential businesses. The waves of COVID-19 cases and deaths varied among continents, regions and countries, while factors such as countries’ proximities, international transportation routes and economic treaties influenced COVID-19 transmission and violated the data independency assumption among countries. The complex situation of the COVID-19 pandemic calls for more sophisticated methods in performance evaluation than averages and rates. An ideal performance evaluation method will assess the changes of COVID-19 cases and fatality over time and relative to other countries. In a paper published by Jamison et al9 the authors proposed the use of COVID-19 cases and death doubling time to avoid the inadequacy of cumulative deaths per million population. Although doubling time may provide a more informative measure, it still falls short in providing a dynamic approach to compare countries with their own performance and others’ over time.
Our methodology enabled us to account for countries’ performance over time by analysing COVID-19 cases and fatality in half-month periods, while HCA allowed us to construct hierarchies of similarly performing countries. To our knowledge, no other reports present 2020 world performance based on cluster analysis in a dynamic setting. However, there are several studies that use basic cluster analysis on COVID-19 data. Papers from India10 11 Brazil12 and Indonesia13 assess number of confirmed cases and deaths on local scales. Nascimento12 was the only study to use additional factors in their clustering, including population, land area, gross domestic product, population density and the Human Development Index. They performed clustering analysis on a weekly basis from 3 April to 8 August, while the other local level studies performed clustering using single day data. In a study of COVID-19 cases of the 50 states in the USA from 21 December to 31 July, James and Menzies14 applied HCA method and developed a mathematical framework to compare the trajectories of month-by-month new case counts as a mean of determining effective pandemic responses. They found that there was always three clusters, a big and two smaller clusters of case counts. The stability of the cluster structure over the time gave them a way to look at time-dependent factors and their relation to the states’ cluster switching. For example, New York and New Jersey switched from a big to a smaller cluster of the new case counts in May 2020, as they introduced face mask mandates.
On the global scale, Zarikas et al15 applied hierarchical clustering on 30 countries, using data from 22 January to 4 April 2020. Mahmoudi et al16 employed fuzzy clustering on seven countries, including France, Germany, Iran, Italy, Spain, the UK and the USA. They focused on daily confirmed cases and deaths and the cumulative cases and deaths. In another related work, Pasin17 used K-means clustering on total cases and deaths per million, on 191 countries based on the cumulative data as of 22 October 2020. A more interesting approach that uses statistical dimension reduction techniques along with clustering algorithms was proposed by Ramadan et al.18 Their analysis focused on 30 March, 15 April and 25 April data points, including 56, 82 and 91 countries, respectively. They first applied principal component analysis on several COVID-19 related measures, then performed clustering using the Partition around Medoid algorithm. To our knowledge, the only study that explored the emergence of COVID-19 clusters over time, by James and Menzies,19 used 4 months of daily COVID-19 data for 208 counties. They used a combination of K-means clustering and HCA, with the goal of discovering any critical periods with major policy shifts in the studied countries. However, unlike our method, the number of clusters varied per day, which made it difficult to compare countries’ ranking over time.
The results of our retrospective analysis of the COVID-19 pandemic stand in contrast to pandemic preparedness predictions by RAND and WHO-JEE. In RAND’s published final report, 22 of the 25 countries most vulnerable to a pandemic are located in sub-Saharan Africa. The other three countries were Haiti, Afghanistan and Yemen. A similar profile of poor access to resources, poor governance and weak health systems was considered as lack of pandemic preparedness.3 We found no African country being worse than average for COVID-19 cases, but several countries such as Guyana, Gambia and Liberia received the worst grades in COVID-19 fatality. We believe that poor access to resources, poor governance and weak health systems play crucial role in pandemic management resulting in higher fatality, yet the reasons why African countries ranked better than average in COVID-19 cases calls for more research.
The 25 least vulnerable countries in the RAND evaluation had normed scores ranging from 0.82 (Italy) to 1.0 (normed maximum value, for Norway). Overall, 15 of these 25 countries ranked average or worse in our COVID-19 cases analysis. France, Italy and the UK were worse than average in both COVID-19 cases and fatality. We found that countries such as the United Arab Emirates and the USA had excellent outcome in keeping the COVID-19 fatality low; however, their preparedness in controlling the spread of the disease was among the worse in their groups. The interaction between pandemic preparedness and countries’ political atmosphere, such as democratic versus authoritarian governments, is addressed elsewhere20 and needs to be examined in future research. Meanwhile, we believe that access to the state-of-the-art medical technology, well-trained medical personnel and economic power to provide free of charge COVID-19 patient care could be among some of the important factors in keeping the fatality low in countries like the USA. To explore the complex epidemiological associations between countries’ political, social and economic factors, models can benefit enormously by taking advantage of methods developed in computer science and machine learning.
Like RAND and WHO, there are other organisations aiming to develop preparedness measures. For example, The Global Health Security Index,21 supported by the Bill & Melinda Gates Foundation and the Robertson Foundation, got together 21 experts from 13 countries to create 140 questions, in six categories, and 34 indicators to assess a country’s pandemic preparedness. The index uses open-source information available from the world countries. The average of the global health security index among 195 countries is 40.2 out of a possible 100, and the high-income countries score an average of 51.9. In general, the index follows the similar pattern as WHO and RAND results, but it is striking that GHI shows that countries worldwide are not prepared for a globally catastrophic biological event indicating most countries lack foundational health systems capacities vital for epidemic and pandemic response.
Finally in 2019, Oppenheim et al22 published an Epidemic Preparedness Index to assess 188 countries for national-level preparedness. The index consists of five subindices measuring each country’s economic resources, public health communications, infrastructure, public health systems and institutional capacity. Similar to the RAND’s, their index had a high correlation with the WHO-JEE scores (0.85), and they found that the most prepared countries were concentrated in Europe and North America, while the least prepared countries were clustered in Central and West Africa and Southeast Asia. Their methodology was similar to RAND’s approach, using publicly available data such as WHO and World Bank Data, and expert opinion through Delphi’s method.
This study suffers from several limitations. The diagnosis and definition of COVID-19 changed over time and varied across countries.23 For example, some countries included only cases confirmed by PCR tests, while others included presumptive cases when patients displayed clinical symptoms. The fatality may be overestimated or underestimated across the countries depending on the criteria to identify death due to COVID-19 when a patient had other serious comorbidities.24 25 Although we compared countries within their population and area sizes intentionally, one may argue that we should also adjust for other factors such as countries’ economic and sociopolitical situation. We did not explore the impact of those adjustments, as this analysis focuses on unadjusted COVID-19 outcomes across the world. Perhaps, Yemen with F in COVID-19 fatality and years of war and human tragedy would benefit from such adjustment. Finally, there is no ascertainment of under-reporting or over-reporting of COVID-19 cases or fatality data by countries. Although this may cause a systematic error in the ranking results, the methodology remains robust to apply when more accurate dataset generated in future.
Conclusion
This paper is the first to present a COVID-19 performance report for the world through 2020. Our results are in line with those generated by standard epidemiological scoring techniques (naïve average and 31 December values); however, our analysis goes beyond those methods, such as WHO and RAND, to account for countries’ behaviour over time and relative to other countries. Existing pandemic preparedness indexes failed to predict the COVID-19 world performance accurately. The complexity of preparedness construct and lack of powerful computational methods may contribute to the shortcoming of existing models, suggesting the need for more work in that area. Future work should also focus on assessing how socioeconomic, political, social and geographic factors, resource availability and policy adoption impacted outcomes.
Data availability statement
Data are available in a public, open access repository. The data used for this analysis were from publicly available sources. The data, codes, and algorithms are available upon request by emailing RCH.
Ethics statements
Patient consent for publication
Acknowledgments
The authors would like to dedicate this study to the millions of health workers fighting COVID-19 across the globe who put themselves and their families at risk to treat patients and contain the spread of this disease.
References
Supplementary materials
Supplementary Data
This web only file has been produced by the BMJ Publishing Group from an electronic file supplied by the author(s) and has not been edited for content.
Footnotes
Contributors RCYC and BS contributed to the study design, data analysis and manuscript preparation. MH contributed to the data preparation, result interpretation and manuscript preparation. RCYC is responsible for the overall content as the guarantor.
Funding The authors have not declared a specific grant for this research from any funding agency in the public, commercial or not-for-profit sectors.
Map disclaimer The inclusion of any map (including the depiction of any boundaries therein), or of any geographic or locational reference, does not imply the expression of any opinion whatsoever on the part of BMJ concerning the legal status of any country, territory, jurisdiction or area or of its authorities. Any such expression remains solely that of the relevant source and is not endorsed by BMJ. Maps are provided without any warranty of any kind, either express or implied.
Competing interests None declared.
Provenance and peer review Not commissioned; externally peer reviewed.
Supplemental material This content has been supplied by the author(s). It has not been vetted by BMJ Publishing Group Limited (BMJ) and may not have been peer-reviewed. Any opinions or recommendations discussed are solely those of the author(s) and are not endorsed by BMJ. BMJ disclaims all liability and responsibility arising from any reliance placed on the content. Where the content includes any translated material, BMJ does not warrant the accuracy and reliability of the translations (including but not limited to local regulations, clinical guidelines, terminology, drug names and drug dosages), and is not responsible for any error and/or omissions arising from translation and adaptation or otherwise.