Article Text

Abstract
Objective Non-pharmaceutical interventions (NPIs), including wearing face covering/masks, social distancing and working from home, have been introduced to control SARS-CoV-2 infections. We provide individual-level empirical evidence of whether adherence reduces infections.
Setting and participants The COVID-19 Infection Study (CIS) was used from 10 May 2020 to 2 February 2021 with 409 009 COVID-19 nose and throat swab tests nested in 72 866 households for 100 138 individuals in the labour force aged 18–64.
Analysis ORs for a positive COVID-19 test were calculated using multilevel logistic regression models, stratified by sex and time, by an index of autonomy to abide by NPIs, adjusted for various socioeconomic and behavioural covariates.
Results Inability to comply with NPIs predicted higher infections when individuals reported not wearing a face covering outside. The main effect for inability to comply was OR 0.79 (95% CI 0.67 to 0.92), for wearing face covering/masks was OR 0.29 (95% CI 0.15 to 0.56) and the interaction term being OR 1.25 (95% CI 1.07 to 1.46). The youngest age groups had a significantly higher risk of infection (OR 1.52, 95% CI 1.28 to 1.82) as did women in larger households (OR 1.04, 95% CI 1.02 to 1.06). Effects varied over time with autonomy to follow NPIs only significant in the pre-second lockdown May–November 2020 period. Wearing a face covering outside was a significant predictor of a lower chance of infection before mid-December 2020 when a stricter second lockdown was implemented (OR 0.44, 95% CI 0.27 to 0.73).
Conclusion The protective effect of wearing a face covering/mask was the strongest for those who were the most unable to comply with NPIs. Higher infection rates were in younger groups and women in large households. Wearing a face covering or mask outside the home consistently and significantly predicted lower infection before the 2020 Christmas period and among women.
- COVID-19
- health policy
- public health
Data availability statement
Data may be obtained from a third party and are not publicly available. This work contains statistical data from Office of National Statistics (ONS) which is Crown Copyright. The use of the ONS statistical data in this work does not imply the endorsement of the ONS in relation to the interpretation or analysis of the statistical data. This work uses research datasets which may not exactly reproduce National Statistics aggregates. The Covid Infection Study (CIS) data are available via a formal request to the ONS Secure Research Service for accredited researchers.
This is an open access article distributed in accordance with the Creative Commons Attribution Non Commercial (CC BY-NC 4.0) license, which permits others to distribute, remix, adapt, build upon this work non-commercially, and license their derivative works on different terms, provided the original work is properly cited, appropriate credit is given, any changes made indicated, and the use is non-commercial. See: http://creativecommons.org/licenses/by-nc/4.0/.
Statistics from Altmetric.com
Strengths and limitations of this study
The first large-scale study that links individual-level and household-level adherence to non-pharmaceutical interventions plus their autonomy to adhere with actual measured infections.
This representative population-based study went beyond the use of aggregated population-wide case data or individual self-reporting of SARS-CoV-2 to use individual throat and swab SARS-CoV-2 positivity testing.
Our measure of infection captured those who might be asymptomatic or whose infections are relatively mild.
Although the dataset is the most representative to date, some groups such as ethnic minorities (termed BAME (black, Asian and minority ethnic) in the UK) are still under-represented in the sample.
Participation in the study is voluntary and thus self-selection bias may affect the results.
Introduction
Although most countries have introduced non-pharmaceutical interventions (NPIs) to lower the spread of infectious diseases such as SARS-CoV-2, there is limited empirical research on the relationship of adherence to NPIs with infections or how an individual’s autonomy or ability to follow NPI measures relates to infections.1 To form evidence-based health policy, it is crucial to have empirical evidence that tests whether adherence to NPIs effectively reduces infection. The lack of compliance to NPIs has been generally positioned as an attitude or choice,2 but it may be related to the inability to follow measures and thus exacerbate existing health inequalities. This includes employment that does not accommodate working at home, the necessity to take public transport or being in workplaces or households where recommended social distancing is not possible.
Due to data limitations, existing research examining the effects of NPIs on COVID-19-related outcomes has almost exclusively used aggregated data to model the correlation between the timing of various national, state or regional level NPIs with COVID-19 case rates.1 3–6 These types of studies risk producing an ecological fallacy, since the interpretation of statistical data about individuals is deduced from an inference for the group to which those individuals belong.1 In the early stages of the pandemic in 2020, some simulations also estimated the potential ebb and flow of infections in relation to the introduction of various NPIs and how this might impact healthcare demands.7 There have been various systematic reviews and meta-analyses, some with mixed results, but generally demonstrating the protective nature of NPIs.8 9 Other studies examining the effectiveness of face coverings and masks have been largely carried out in health settings examining N95 or surgical masks, with critiques that findings cannot be transferred to community settings or do not properly control for confounders.9
Although a handful of individual-level studies more directly examined the relationship between individual adherence to NPIs and individual-level case data of infections, they were carried out in the early stages of the pandemic, had small samples (100010 or 1500 cases11), and used very general NPI measures. A previous review concluded that although many studies have assessed NPIs, few were able to directly examine or quantify their impact.12 We aimed to measure the association between COVID-19 infections and the autonomy to follow NPIs, key sociodemographic factors and changes over time, using individual-level and household-level data in a large nationally representative sample in the UK collected over almost 1 year from May 2020 to February 2021.
Methods
Study design and participants
The COVID-19 Infection Study (CIS) is one of the largest regular surveys of coronavirus infections and antibodies.13 The CIS has been used to examine multiple aspects of the pandemic and to monitor community prevalence of SARS-CoV-2 infection.14 Samples, demographic information and a short questionnaire are collected from individuals aged 2 and older living in private households in England, randomly selected from address lists and the Office of National Statistics (ONS) surveys. It is a repeated household survey with additional serial sampling and longitudinal follow-up. Data include a questionnaire and nose and throat swabs. If multiple household members agreed to participate, a home visit was made to collect information. Following the first visit, participants who agree are visited every week for the first 5 weeks and then receive optional monthly visits. All study protocol and questionnaires are available online (https://www.ndm.ox.ac.uk/covid-19/covid-19-infection-survey).
A positive COVID-19 test was determined from nose and throat swabs using the TaqPath RT-PCR COVID-19 kit (Thermo Fisher Scientific, Waltham, Massachusetts, USA), analysed using UgenTec Fast Finder 3.300.5 (TaqMan 2019-nCoV assay kit V2 UK NHS ABI 7500 v2.1; UgenTec, Hasselt, Belgium), described in detail in the sources listed above. Tests are considered positive when at least one gene is present—N, ORF1ab or both—but could be accompanied by the gene for S protein (detection of S protein alone is not considered reliable).14 For the analyses in this study, the CIS from 10 May 2020 to 2 February 2021 was used with 409 009 valid COVID-19 tests from nose and throat swabs nested in 72 866 households for 100 138 individuals in the labour force aged 18–64 years.
Measurement of autonomy
Autonomy to adhere to NPIs is measured by summing conditions that might limit their ability to comply. Each question was asked at every visit to each participant. We assigned points to these conditions which were then summed into one index that measures autonomy. The measures are that the respondent reports that they: (1) work outside the home at least 1 day per week (1 point); (2) find it ‘easy to maintain 2 metres’ distance in workplace (0 point); (3) find it ‘relatively easy to maintain 2 metres’ distance in the workplace (1 point); (4) find it ‘difficult to maintain 2 metres, but can be 1 metre’ in the workplace (2 points); (5) ‘very difficult to be more than 1 metre away’ in the workplace (3 points); (6) are at a main working location that is ‘somewhere else (not your home)’ (1 point); (7) find it common to go to and from work/school by bus, coach or minibus (1 point); and (8) engage in work that involves direct contact with patients, clients, residents, service users or customers on a day-to-day basis (1 point). We included transportation by bus, coach or minibus only since sensitivity analyses that included other means of transportation such as underground, tram or motorbike, scooter, or car all showed a reverse correlation with other autonomy items and reduced the reliability of our autonomy index.
The autonomy index passed the Cronbach’s alpha test with the reliability coefficient of 0.73. Exact questions used for the construction of the measurement of autonomy can be found in the supplemental materials (online supplemental table s1). Spearman correlation among each item and the final autonomy score is documented in the supplemental materials (online supplemental table s2).
Supplemental material

Timeline of key restrictions in England by COVID-19 cases (left) and deaths (right), 1 January 2020 to 8 March 2021. JCVI (Joint Committee on Vaccination and Immunisation); AZ (AstraZeneca). Graph produced by authors using policy data for England,17 18 and official UK Government data on COVID-19 cases and deaths,19 smoothed into 14-day rolling means. Deaths are in red (read from right axis) and cases in blue (read from left axis) with magnitudes representing smoothed 14-day rolling means and not cumulative figures. The restrictions shown here are for England and we note there was some variation in the detail of some policies and slight variation in timing in Scotland, England, Wales and Northern Ireland.

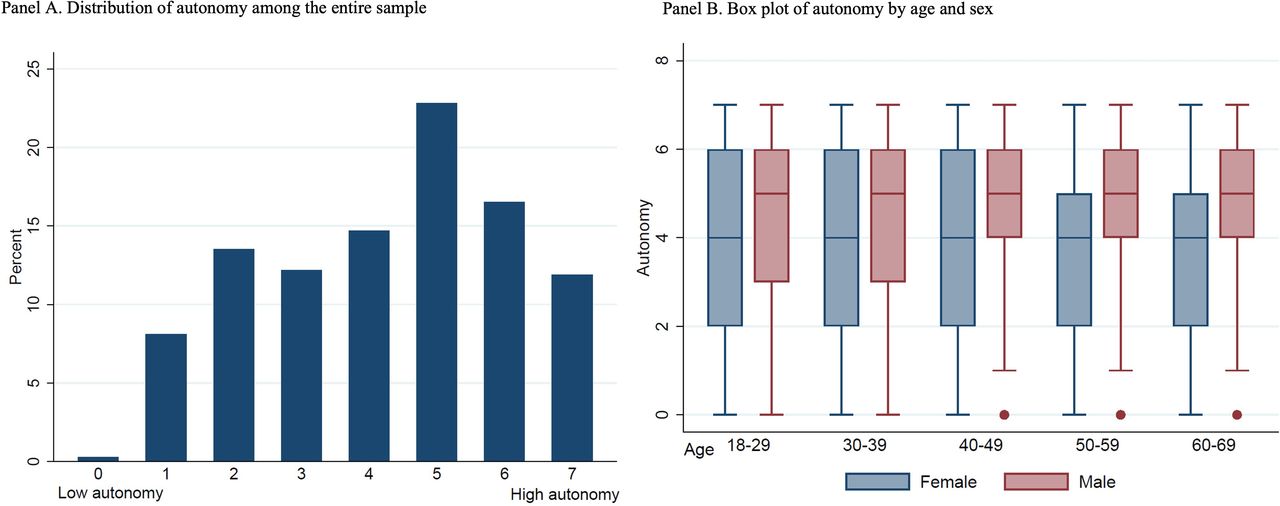
Distribution of the measure of autonomy within the sample (Panel A) and by sample subgroups (Panel B).
To interpret the index, we consider an example. A person who reports working outside home for 5 days a week (+1), in a job where it is difficult to maintain 2 metre distancing, but can maintain 1 metre (+2) and whose main work location is not home (+1) and does not take public transportation of a bus (0), but works directly with people (+1) will score 5 in autonomy. After summing the scores, we reverse coded the autonomy variable so that a lower score indicates low autonomy (ie, more situations that limit the individuals’ ability to comply) and a higher autonomy score indicates a higher ability to comply with NPIs. The range for the autonomy score is from 0 to 7, with the person described in the previous example scored as 2 given reverse coding.
Statistical analysis
We estimated the likelihood of testing positive for SARS-CoV-2 from nose and throat swabs using three-level multivariate multilevel logistic regression models, also stratified by sex and time period. The outcome is a positive SARS-CoV-2 test, with the main predictors of sex, black, Asian and minority ethnic (BAME), age group, visit date, household size, smoking status, region, occupation, days since contact with any COVID-19 positive person, compliance with wearing a face covering or mask and autonomy to comply with NPIs.
Mixed-level logistic regression models were estimated with COVID-19 tests (level 1) nested within individuals (level 2) nested within households (level 3) with the outcome variable of COVID-19 positive infections. The main model estimates sex, ethnicity, age group, reporting to wear a face covering or mask, our autonomy to comply index and additional control variables. Model 2 adds an interaction term between autonomy to adhere and wearing a face covering or mask. Model 3 is the same as model 2 but only includes females. Model 4 is the same as the main model but only includes males. We estimated sex-specific models since when we added the interaction term for men only in the model, the interaction terms were not significant, the model fit did not increase, and the main effect also disappeared. We therefore consider the interaction terms in the male model as an unnecessary control and only reported the main models for men. Next, we stratified the models by three periods that broadly reflect the various phases of restrictions in the UK of (1) 10 May–4 November (pre-lockdown 2), (2) 5 November to 19 December (lockdown 2 ‘light version’), and (3) 20 December to 2 February (lockdown 2 stricter) (see figure 1). These periods follow the general guidelines, which varied somewhat across the four nations of England, Scotland, Wales and Northern Ireland. For the first periods, we were able to fit the model with the interaction term, and for the second and third period, we fit the main model without the interaction term for the same reason mentioned above in relation to sex. Occupation was not included in the models by time periods due to the small sample sizes in each category.
Patient and public involvement
Patients and the public were not involved in the development of research questions, design of the study, recruitment, and conduct of the study, or dissemination of the study results.
Results
The autonomy score ranges from 0 to 7 (mean=4.21, SD=1.82), with a higher score indicating more autonomy. The distribution of the autonomy score for the entire sample and by sub-groups is presented in figure 2. The autonomy score follows a normal distribution. Men, and particularly men above 40 years of age, report more autonomy than women and younger counterparts.
We find that the level of autonomy to adhere to NPIs does not predict COVID-19 infection alone, but rather the risk of infection is diminished when individuals wear face covering/masks (figure 3 or online supplemental table s3). For example, the main effect model in figure 3 and model 1 in online supplemental table s3 shows that with one higher score in autonomy (ie, one more condition that limited the respondents’ ability to comply to NPIs), there is a 3% lower likelihood of testing positive for SARS-CoV-2 (OR 0.97; 95% CI 0.95 to 0.99). The coefficient is, however, marginally statistically significant, and the magnitude is small.

Three-level logistic regression models of COVID-19 positive tests, 10 May 2020–2 February 2021 by key fixed-effect predictors and interaction effects (see supplemental materials for full tables), ONS COVID-19 Infection Study. BAME, black, Asian and minority ethnic; ONS, Office of National Statistics.
In figure 3 (also see online supplemental table s3, model 2), we add interaction terms between autonomy and compliance of wearing face covering/mask. We found that the protective effect of wearing a face covering/mask is stronger when autonomy is low. We visualise this interaction effect based on model 3 (online supplemental table s3) in figure 4. The interaction effect is the most pronounced among females.

Association between infection and autonomy by level of compliance to wearing face covering/masks (estimates from model 3).
The youngest 18–29 year old age groups have a significantly higher odds of infection (OR 1.52, 95% CI 1.28 to 1.82), with living in a larger household only related to a significantly higher odds of infection for women (OR 1.04, 95% CI 1.02 to 1.06). Male smokers had a significantly lower risk (OR 0.84, 95% CI 0.74 to 0·94). This is in line with a recent review of 17 studies that also found that current smokers had a reduced risk of testing positive for COVID-19.15
To test whether our core predictors change in relation to key policy restrictions put in place to restrict infections, hospitalisation and deaths (figure 1), we divided the analysis into three policy periods (available in our data) of (1) 10 May 2020–4 November 2020 (first lockdown to pre-second lockdown), (2) 5 November–19 December (second lockdown and pre-Christmas period of ‘lockdown light’), and (3) 20 December–2 February (stricter second lockdown with schools closed and introduction of tier 4). Figure 1 illustrates the clear time-lag between infections leading to deaths, with growing evidence that this link is disrupted by vaccinations as time elapses. BAME groups were more likely to be infected, especially during the second lockdown (5 November–19 December) (OR 1.36, 95% CI 1.04 to 1.79) (online supplemental figure s1 or table s4).
Effects varied over the year with autonomy to follow NPIs only significant in the pre-second lockdown period (May–November 2020). Wearing a face covering or mask outdoors was a significant predictor of a lower chance of infection before 19 December 2020 (OR 0.44, 95% CI 0.27 to 0.73) when a stricter second lockdown was implemented. One possible explanation is that the percentage of people not wearing face covering/masks was low and declined from 2% to 1% from May 2020 to February 2021. The variable may also be capturing both the social environment (ie, wearing a face covering may be influenced by the level of individuals wearing masks around you) and the correlated health behaviours (ie, those who wear face coverings are more cautious in other ways).
In the full models, the random effects variance estimates were larger at the household level than at the individual level OR 3.34 (95% CI 3.05 to 3.63) versus OR 1.02 (95% CI 0.78 to 1.26), suggesting that more unexplained variation in infection risk exists at the household level (online supplemental table s3). This difference was smaller or non-existent in the sex-stratified models, with the residual intraclass coefficients also reflecting a loss of household information.
Discussion
Using multivariate multilevel logistic regression models, we examined the relationship between individual adherence to NPIs and COVID-19 infection, controlling for key sociodemographic, behavioural and time-related policy changes. We found that an individuals’ autonomy to comply with NPIs predicts higher infections when individuals do not engage in other protective measures of wearing a face covering or mask outside their home. Our results suggest that engaging in protective behaviours such as wearing face coverings can reduce the unequal effects of exposure to COVID-19, noted in previous literature reviews.9 Our findings emphasise the need to move to more complex models beyond comparing aggregated percentages of general population compliance to a more nuanced understanding that stratifies groups in meaningful ways to develop tailored health policy interventions and communications. We found that women living in larger households had a significantly higher risk of infection, reflecting more domestic and care duties and time in the household, but also multiple individuals leaving and returning the home from diverse environments.
The 18–29 year old age group had a significantly higher risk of infection, suggesting that this is an important group to consider given that many countries have been engaging in age-related vaccine rollouts. Effects varied over the year with autonomy to follow NPIs only significant in the pre-second lockdown period (May–November 2020). This was a period where initially many UK governments were reluctant to introduce certain policy interventions, such as the relatively late introduction of face coverings for the general public in late June or July 2020, first in public transport only.2
Wearing a face covering or mask outside the home was a significant predictor of a lower chance of infection before 19 December 2020 when a stricter second lockdown was implemented. BAME groups are more likely to be infected, especially during the second lockdown (5 November–19 December). We note, however, that although we see some period variation, given the overlap in CIs and the fact that we are not strictly testing a difference between the coefficients in our model, they are not statistically different.
A strength of our study is that it is to our knowledge the first large-scale study that links the reporting of individual-level and household-level adherence to NPIs and their ability or challenges to adhere with actual measured infections. This representative population-based study went beyond the self-reporting of SARS-CoV-2 to use throat and swab SARS-CoV-2 positivity testing opposed to population-wide case data, which is subject to significant selection bias. This is also an advantage over other measures such as hospitalisation or death, which only pick up the most severe cases. By measuring infections in this manner, we are also able capture those who might be asymptomatic or whose infections are relatively mild. Given the multilevel design based on a sample that was designed to be a random sample of households stratified by gender and time period, we also avoid problems in interpretation over this period due to changes in testing practice. Another advantage is that we have longitudinal, regularly collected data over this period which allows us to examine changes in behaviour over time.
Our study is also subject to several limitations. Although the dataset is the most representative to date, some groups such as ethnic minorities (termed BAME in the UK) remain under-represented in the sample. Whereas we have 7% BAME, among the UK population, around 14% are from a minority ethnic background. Therefore, our estimates may not reflect the full range of the population. Future work may incorporate our individual- and household-level approach with the aggregate-level approach5 16 together to analyse population scale NPIs and risk attitudes/behaviours. The number of tests in the lockdown 2 ‘stricter version’ period is much smaller, meaning that we may not have the power to detect some effects. Participation in the study is voluntary and thus self-selection bias may affect the results. In addition, as others have noted, we are unable to determine the sensitivity and specificity of the PCR test, but it is likely close to 100%.17 Finally, the mixed logit models assume linearity between the continuous predictors and the log odds of the outcome of interest. Violating linearity can affect prediction and inference. Since most of our predictors are categorical/binary and we only include three continuous predictors—visit date, autonomy and household size—in the analyses, it is unlikely that the linearity assumption is severely violated. The plot of the logit for continuous predictors (online supplemental figure s2) also alleviates the concern.
Conclusion
Many countries introduced multiple NPIs to control COVID-19 infections, hospitalisation and deaths and continue to implement or reintroduce them during spikes in infections even during vaccine rollout. There have been limited empirical studies using individual-level data to examine how individual adherence to NPIs predicts infections by sociodemographic factors, individual autonomy to abide by NPIs and how these relationships change over time in relation to different restrictions.
We move beyond aggregated figures showing macro correlations of NPI policy stringency with national-level COVID-19 outcomes, to produce individual-level and household-level models that properly control for confounders, key sociodemographic and behavioural factors and changes in policy interventions over time. Using the COVID-19 Infection Study (CIS) in the UK with almost 1 year of data from 10 May 2020 to 2 February 2021, with 409 009 valid COVID-19 tests nested in 72 866 households for 100 138 individuals aged 18–64 years, we estimate multivariate multilevel logistic regression models, stratified by sex and time period. We create a novel index measuring individual autonomy to abide by NPIs index (ie, ability to work at home and number of days at home, ability to maintain physical distancing at work, travel to work requires public transport or work involves direct contact).
Although autonomy or inability to abide by NPIs is a significant predictor of higher infection rates among certain groups, it does not predict infection alone. Wearing a face covering or mask outside the home can reduce the unequal effects of exposure to COVID-19 due to individual and employment circumstances. Autonomy to follow NPIs was only a significant predictor of infection risk from May to November 2020 but those who reported wearing a face covering or mask outdoors significantly had lower rates of infection for individuals with lower level of autonomy between 10 May and 4 November and for all people between 5 November and 19 December 2020.
The results we present here summarise key parts of the analyses we presented to senior decision makers in the UK over February–March 2021, in a context with rapidly evolving information, vaccine deployment and other relevant policies. As the pandemic evolves, new variants of concern emerge and vaccines are rolled out across the world, experts, politicians and civil servants will continue to make difficult decisions on lifting or reinstating NPIs. This study provides novel and nuanced empirical evidence of the relationship of autonomy to follow NPIs with infection, how this varies and where support or public communication could be directed.
Data availability statement
Data may be obtained from a third party and are not publicly available. This work contains statistical data from Office of National Statistics (ONS) which is Crown Copyright. The use of the ONS statistical data in this work does not imply the endorsement of the ONS in relation to the interpretation or analysis of the statistical data. This work uses research datasets which may not exactly reproduce National Statistics aggregates. The Covid Infection Study (CIS) data are available via a formal request to the ONS Secure Research Service for accredited researchers.
Ethics statements
Patient consent for publication
Ethics approval
Participants provided informed consent when they took part in the CIS study. More information can be found here: https://www.ons.gov.uk/surveys/informationforhouseholdsandindividuals/householdandindividualsurveys/covid19infectionsurveycis/howtotakepart
Acknowledgments
This work was supported by the Leverhulme Trust, Leverhulme Centre for Demographic Science (grant number N/A) and ERC Advanced Grant (835079). We thank C. Rahal for his assistance in the time-varying graphic.
References
Supplementary materials
Supplementary Data
This web only file has been produced by the BMJ Publishing Group from an electronic file supplied by the author(s) and has not been edited for content.
Footnotes
Twitter @melindacmills
Contributors MCM, XD and DMB designed the study and MCM wrote the report, to which all authors contributed. MCM, XD and DMB designed the models. XD and DMB prepared the data and ran the models. MCM designed the time-varying graphic. MCM is responsible for the overall content as the guarantor. All authors read and approved the final article.
Funding Funding is provided by the Leverhulme Trust (LCDS) and ERC Advanced Grant (835079) to MCM.
Disclaimer The funders had no role in study design, data collection, analysis, interpretation, or writing.
Competing interests MCM is a participant of the UK Scientific Advisory Group for Emergencies sub-groups SPI-B (behavioural insights), ethnicity and Vaccines Science Coordination Group and member of the Royal Society’s SET-C (Science in Emergencies Tasking – COVID) group, all which respond to requests from government departments and the Government Office for Science.
Provenance and peer review Not commissioned; externally peer reviewed.
Supplemental material This content has been supplied by the author(s). It has not been vetted by BMJ Publishing Group Limited (BMJ) and may not have been peer-reviewed. Any opinions or recommendations discussed are solely those of the author(s) and are not endorsed by BMJ. BMJ disclaims all liability and responsibility arising from any reliance placed on the content. Where the content includes any translated material, BMJ does not warrant the accuracy and reliability of the translations (including but not limited to local regulations, clinical guidelines, terminology, drug names and drug dosages), and is not responsible for any error and/or omissions arising from translation and adaptation or otherwise.