Article Text

Abstract
Objective Estimate the prevalence/incidence/number of major lower extremity amputations (MLEAs) in the UK; identify sources of routinely collected electronic health data used; assess time trends and regional variation; and identify reasons for variation in reported incidence/prevalence of MLEA.
Design Systematic review and narrative synthesis.
Data sources Medline, Embase, EMcare, CINAHL, The Cochrane Library, AMED, Scopus and grey literature sources searched from 1 January 2009 to 1 August 2021.
Eligibility criteria for selecting studies Reports that provided population-based statistics, used routinely collected electronic health data, gave a measure of MLEA in adults in the general population or those with diabetes in the UK or constituent countries were included.
Data extraction and synthesis Data extraction and quality assessment using the Joanna Briggs Institute Critical Appraisal Instruments were performed by two reviewers independently. Due to considerable differences in study populations and methodology, data pooling was not possible; data were tabulated and narratively synthesised, and study differences were discussed.
Results Twenty-seven reports were included. Incidence proportion for the general population ranged from 8.2 to 51.1 per 100 000 and from 70 to 291 per 100 000 for the population with diabetes. Evidence for trends over time was mixed, but there was no evidence of increasing incidence. Reports consistently found regional variation in England with incidence higher in the north. No studies reported prevalence. Differences in database use, MLEA definition, calculation methods and multiple procedure inclusion which, together with identified inaccuracies, may account for the variation in incidence.
Conclusions UK incidence and trends in MLEA remain unclear; estimates vary widely due to differences in methodology and inaccuracies. Reasons for regional variation also remain unexplained and prevalence uninvestigated. International consensus on the definition of MLEA and medical code list is needed. Future research should recommend standards for the reporting of such outcomes and investigate further the potential to use primary care data in MLEA epidemiology.
Systematic review registration PROSPERO CRD42020165592.
- vascular surgery
- general diabetes
- epidemiology
Data availability statement
Data are available upon reasonable request.
This is an open access article distributed in accordance with the Creative Commons Attribution Non Commercial (CC BY-NC 4.0) license, which permits others to distribute, remix, adapt, build upon this work non-commercially, and license their derivative works on different terms, provided the original work is properly cited, appropriate credit is given, any changes made indicated, and the use is non-commercial. See: http://creativecommons.org/licenses/by-nc/4.0/.
Statistics from Altmetric.com
Strengths and limitations of this study
The study methods in the form of a protocol have been peer reviewed and published.
Outcome measures investigated have been clearly defined and referenced.
A comprehensive search strategy was employed in both peer-reviewed and grey literature searches.
Included article methods and populations were not directly comparable and so it was not possible to pool data.
This study only investigated data sources in the UK; thus, results may have limited use outside of this population.
Introduction
Peripheral artery disease (PAD) is the leading cause of all major lower extremity amputations (MLEAs) with diabetes, smoking, increasing age, hypertension increasing risk.1 2 While diabetes is a risk factor of PAD, diabetes without PAD is also a cause of MLEA. With the global rise in diabetes prevalence and an ageing population, incidence of MLEA has become a key indicator of health service performance and used for international comparisons.3–6 Monitoring incidence globally, nationally and regionally is essential to determine the success of implemented prevention services.
In the UK, the incidence and trends in incidence of MLEA are debated with variations reported.7–9 Significant differences in regional estimates have also been reported.8–10 The reasons for these disparities are unclear, although a recent review suggested differences in calculation methods may provide some explanation.11
Electronic health data are widely used for epidemiological research. Variation exists in the way individual databases collect, administer and report data, and therefore, differences between databases may also explain variation in reported MLEA statistics. There are many additional challenges to using such data; one notable but improving issue is coding errors.12–15 Including poor quality data with errors in incidence studies may affect the apparent trends in disease incidence.15 Using different sets of MLEA codes and/or data may also account for some of the variation observed.
This systematic review aimed to ascertain the current UK incidence of MLEA, establish trends over time, report regional variation and review which routinely collected electronic health databases were used. The review also aimed to explain the reasons for variation in the reporting of MLEA epidemiology.
Methods
This review followed the Preferred Reporting Items for Systematic reviews and Meta-analyses (PRISMA) guidelines for systematic reviews.16–18 A protocol was published and registered in the PROSERO database (CRD42020165592).19
Search strategy
Searches were initially performed in December 2019 and rerun in August 2021.
Electronic databases Medline, Embase, EMcare, CINAHL, The Cochrane Library, AMED and Scopus were searched using keywords, thesaurus terms (indexing systems) and validated UK geographic filters where available.20 21 The search was developed in Medline and then adapted for other databases (online supplemental file 1).
Supplemental material
Grey literature (non-peer-reviewed articles) was identified using www.opengrey.eu, openDoar.org, openAire.eu, base-search.net, eTHOS, https://biblioboard.com/opendissertations/, www.gov.co.uk, www.parliament.uk, www.vvappg.com, www.digital.nhs.uk, www.QResearch.org and www.CPRD.com using the key word ‘amputation’/‘amput*’.
Inclusion criteria
Included reports presented: population-based statistics; used routinely collected electronic health data; were written in English; and gave a measure (prevalence/incidence/number) of MLEA in the general population or in persons with diabetes in England, Scotland, Wales, Northern Ireland or the UK.
Studies published from 2009 onwards were included to ensure results were reflective of recent trends. This review aimed to focus on PAD and diabetes-related MLEA as these may be preventable, and only a small percentage of MLEA occur due to other aetiologies.22 Analysis and any resulting care service improvements would therefore need to be based on vascular, diabetes and podiatric care. Studies of adults that included MLEA due to cancer and trauma were included in the study, but this information is explicitly stated where available. Studies of children were excluded in order to exclude studies that did not focus on PAD and/or diabetes-related amputations; however, studies that included both adults and children were included.
No agreed definition of ‘major’ lower extremity amputation exists. Therefore, we did not define MLEA, and all studies that reported MLEA were included with individual study definition of MLEA extracted.
For studies that reported for both minor and major lower extremity amputation, only data for major lower extremity amputation were included.
Screening and extraction
Identified reports were imported into EndNote X9, and duplicates were removed. Initially, titles and abstracts were screened for inclusion by two reviewers independently (AM and JSMH). Of the selected reports, two reviewers independently screened the full texts with exclusion reasons recorded (AM plus JSMH or ATON).
Data extraction was performed by two reviewers independently using a pretested tabulated form. Disagreements at any stage were resolved by discussion. Where data items were not reported, data were requested from authors.
Data extracted:
Author, title and publication date.
Data source.
Epidemiological measure of MLEA - prevalence/incidence/number including any CI, SE and variance presented.
Definition of MLEA.
Population studied (country, diabetic/non-diabetic, age limits, date limits, comorbidities or reasons for amputation excluded, eg, cancer/trauma).
Regional results.
Standardisation methods.23
MLEA code lists.
Reporting guidelines used.
Quality assessment
The Joanna Briggs Institute (JBI) Critical Appraisal Instruments, either for studies reporting prevalence data or for cohort studies, were used to assess reporting quality.24–26 Two reviewers (AM plus JSMH or ATON) independently appraised included reports and resolved any disagreement. Additionally, use of appropriate reporting guidelines such as Strengthening the Reporting of Observational Studies in Epidemiology (STROBE) and Reporting of Studies Conducted Using Observational Routinely-collected Data (RECORD) will be noted.
Data synthesis
Data were converted, where possible, to provide consistent statistics across reports (eg, percentages converted to per 100 000 population). Where multiple incidence values for an individual study were reported, the most recent figure was extracted.
Extracted data were corrected where errors in terminology or calculations were identified using the following definitions (where populations refers to the population specified by the individual study)27 28:


Data were tabulated and synthesised narratively to investigate incidence/prevalence and time trends. Meta-analysis of incidence/prevalence and meta-regression of time trends using a random effects model were planned but not performed as extracted data were not suitable for pooling.19
Patient and public involvement
Patients or the public were not involved in the design, or conduct, or reporting, or dissemination plans of our research.
Ethics approval
Ethics approval was not applicable for this study as it is a systematic review of published data.
Results
Search results
Titles and abstracts of 3722 peer-reviewed reports and 1728 grey literature reports were screened (figure 1). Twenty-seven reports were included, 13 of which were identified through grey literature searches.4 7–10 22 29–49 Included grey literature consisted of reports from national healthcare quality improvement programmes, government healthcare department agencies and government-associated healthcare audits.22 32–36 40 41 43 46–49 Corresponding authors for nine reports were contacted for additional data; only one author responded.44 45

PRISMA flow diagram of the screening process. PRISMA, Preferred Reporting Items for Systematic Reviews and Meta-Analyses.
Quality assessment
Overall reporting was poor to moderate with errors in key aspects such as statistic definition and calculations and poor reporting including the lack of descriptive statistics of their study population and denominator population descriptions (online supplemental file 2). Six reports passed only 33% of the JBI prevalence study criteria, while the remaining 19 passed between 33% and 67%. The two reports assessed by the JBI cohort study guidelines used more robust methodology and reporting and passed on 80%–100% of the applicable criteria. Use of appropriate reporting guidelines such as STROBE and RECORD guidelines, where available, was unclear.50 51 Only one report stated the use of STROBE guidelines.37 RECORD guidelines were published in 2015; none of the included reports published after this date stated the use of these guidelines.
Supplemental material
Outcome measures and synthesis
A variety of MLEA statistics were reported by included reports (table 1). Where available, standardised outcome measures were presented along with the CI where available, SE or variance were not provided by any included reports. Seventeen (63%) reports provided a calculated statistic,4 7–10 29 31–37 41 43–45 while the remaining eight provided an absolute number.22 30 38–40 42 46–49 Fourteen (52%) reported an incidence proportion.4 7 10 29 32–38 43–45 Two reported an incidence rate.8 31 The statistic presented for one report was unclear.41 None presented prevalence.
Table showing the method details and outcomes extracted from the included articles
Due to heterogeneity between study designs and reporting and the inability to accordingly recalculate outcomes homogeneously owing to a lack of available data (discussed further in the results and discussion sections), data pooling was not possible; results have been tabulated and narratively synthesised. An examination of the study method differences is explained in the ‘Sources of outcome measure variation’ section.
Incidence proportion for the general population in England (not including reports for the population without diabetes) ranged from 8.2 to 51.1 per 100 000 population and from 70 to 291 per 100 000 for the population with diabetes in England.
Time trends
Time trends were investigated by six reports (figure 2).4 7 37 42 44 45 Differences in populations and methods mean that a direct comparison of trends could not be made.

Reported time trends in incidence proportion of MLEA for: (A) the general population and (B) the population with diabetes. MLEA, major lower extremity amputation.
One report investigated time trends in total number of amputations; they did not calculate a proportion or rate statistic. They reported a statistically significant 9.4% decrease in MLEA between 2000 and 2019 (5418 in 200 vs 4907 in 2019: 95% CI −49.6 to −12.5, p=0.003). However, as this does not take into account any changes in population and the methods used to account for multiple amputations per person were unclear, it was not possible to compare this trend with those of the other included reports.
For those that reported an incidence proportion, results were mixed, with some reports finding non-significant decreasing trends; however, there was some evidence of a statistically significant decrease in MLEA in England over time for both the general population and for those with type 1 diabetes.44 45 One report found evidence of a statistically significant increase in MLEA for those with type 2 diabetes.45 One possible explanation for the extreme differences in values seen in figure 2 is the application of standardisation methods; reports that used these methods are labelled.
The report for Scotland reported a statistically significant (p<0.001) decrease in the incidence of MLEA for those with diabetes.37
For the studies that reported on a frequent basis, that is, the National Diabetes Audit (NDA) and National Vascular Registry (NVR) reports, trends in incidence of MLEA over time could not be assessed as the NDA reports differ in frequency, study length and calculation methods, and the NVR reports have overlapping study periods.
Regional trends
Four reports provide regional data.8–10 41 Public Health England (PHE) Fingertips provided regional estimates for those with diabetes by the 207 clinical commissioning groups.41 For the period of 1 April 2017–31 March 2020, the regions with the highest and lowest incidence proportion per 100 000 population were Bradford City (in Northern England) (270/100 000) and Lewisham (in Greater London) (34/100 000). The report also gives values by the 42 Sustainability and Transformation Plan areas where incidence proportions per 100 000 population were highest in Cornwall and the Isles of Scilly (in South Western England) (117/100 000) and lowest in South East London (82/100 000); however, the time period these values cover is unclear. Holman et al8 studied MLEA incidence rates in those with and without diabetes by commissioning area (with different boundaries to those in the PHE Fingertips report) but did not provide any extractable area level data. They observed a 16-fold variation in incidence rate between areas for the population without diabetes and a 10-fold variation in incidence rate between areas for those with diabetes.
The two reports providing comparable data showed regional variation was statistically significant (p<0.001).9 10 Incidence was highest in the North of England and lowest in the South of England (figure 3).

Sources of outcome measure variation
Database differences
Healthcare database use differed by country. All but one report ascertained cases of MLEA using only secondary care data with the remaining report using a combination of both primary and secondary care data.31 Details of these databases are summarised in table 2. Importantly, case ascertainment of MLEA in the NVR compared with HES is low in the NVR compared with HES (48%–74% between 2014 and 2018).52 Additionally, Clinical Practice Research Datalink (CPRD) primary care data does not cover the whole UK population.
Characteristics of databases used to ascertain cases of MLEA by included reports
Population differences
Study populations varied widely between reports with differences in country, exclusion criteria and MLEA definition and study period (table 1).
Reports varied in how multiple procedures per person were dealt with. Nine reports made no reference to this.4 7 9 10 29 30 38 41 42 Four used the highest level of amputation.8 37 44 45 Reports varied in how contralateral amputation during the same admission were counted. Two reports, the cohort studies, included the first procedure.31 39 The NDA reports implied each person was only included once no matter how many operations were performed although they do not specify which (first or highest) was included.32–36 43 The NVR 2015 report looked at unilateral amputations; no other information is given.46 The NVR 2016–2019 reports excluded bilateral amputations and those associated with a bypass.22 47–49 The NVR 2020 makes the same exclusions as the NVR 2016–2019 reports but does, however, report the numbers of these excluded amputations.40 Repeated amputations were not mentioned. None of the reports included revision specific procedures.
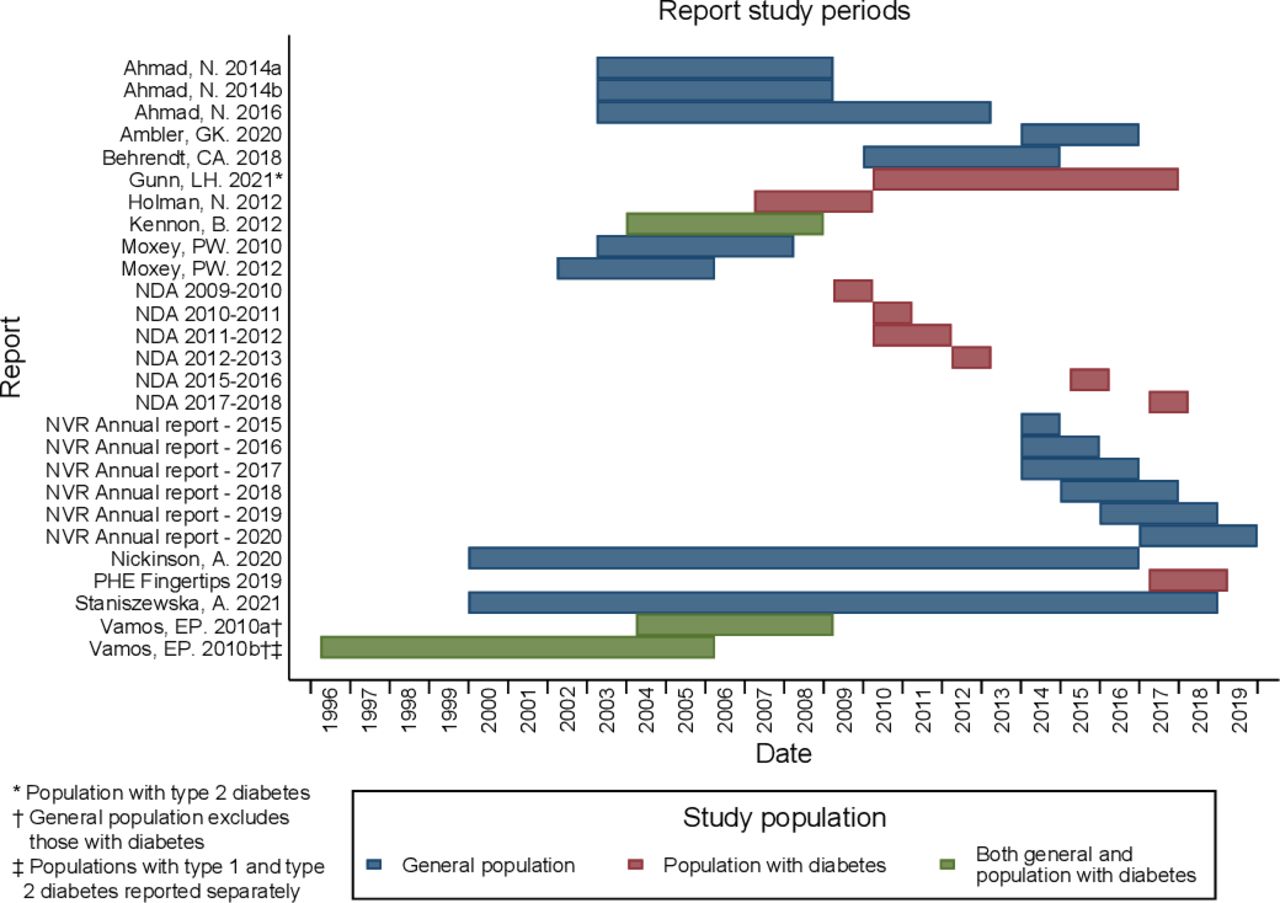
Study periods ranged from one to 19 years between the years 1996 and 2019 (figure 4). No two reports with comparable populations covered the same period. Reports providing whole study estimates of incidence over a number of years generally reported higher incidence than those that reported for yearly incidence, as would be expected. This can be seen in the NDA reports in table 1.

Included article study periods by population type.
Coding differences
Seventeen reports provided code lists (online supplemental file 3 and table 1), all of which ascertained cases in Hospital Episode Statistics (HES) or HES-linked CPRD and used Operation Procedure Codes version 4 codes apart from one that used the International Classification of Diseases 10th Revision Procedure Coding System (ICD-10-PCS).4 7–10 29 31–36 39 41 43–45 One report ascertained cases in CPRD in addition to HES using CPRD GOLD medcodes; these are listed under table 1 in online supplementary file 3.31 There were inconsistencies between the definition of MLEA used and the code lists, and one report included an ICD-10-PCS code that does not exist while not including an expected code.4
Supplemental material
For those that reported for the population with diabetes only, differences were found in the case ascertainment methods of those with diabetes (online supplemental file 3 and table 2).
Outcome measure calculation differences
Statistics were inconsistently reported. Some reports used ‘prevalence rate’ or ‘period prevalence’ when actually stating an incidence proportion.7 10 29 32–36 Five reports used the terms ‘incidence’ and ‘amputation rate’ when reporting incidence proportion.4 9 37 44 45 The term ‘amputation rate’ was also used by one other study; however, in this study, an incidence rate was calculated.31 One report did not clearly define the statistic used.41
Six reports used standardisation methods and only presented standardised results; these reports did not present enough information to be able to calculate crude (unstandardised) outcome measures.7 10 29 32 41 45 These reports varied in method and variables used to perform standardisation. Three reports standardised by age only,7 10 29 two by age and sex32 45 and one by age and ethnicity.41 Only one included report provided both standardised and crude outcome measures.32 In this case, the effect of age and sex standardisation to reflect the national population was a greater than threefold increase in incidence proportion (crude: 87/100 000, standardised: 290/100 000).
Denominators were poorly reported with few reports providing the inclusion/exclusion criteria, and calculation methods for incidence rate denominators were not described. One report stated the population country as the UK; however, the cases were ascertained using HES, which only covers England, and the denominator population was taken from Office for National Statistics population statistics for England and Wales.4 Another report misreported incidence proportion as number of MLEAs per 100 000 population; the calculated figures were actually reported per 10 000 population.9 As the population data were available to do so, correct recalculated statistics were presented in this review.
Discussion
Principle findings
Reported values of incidence proportion for the general population and population with diabetes varied with approximately a sixfold and fourfold difference, respectively.
Despite mixed reports of a decreasing trend in MLEA in England, it is encouraging that there is no evidence for an increasing trend in the general population considering the increase in prevalence of type 2 diabetes.49 Some reports found evidence of an increase in the incidence of minor lower limb amputations that may partly explain this.7 However, there is evidence of a statistically significant rise in the number of amputations in those with type 2 diabetes from one report.45 This increasing trend was seen over the 1996–2005 period; with no more recent studies, it is unclear as to whether this trend is continuing.
Although two reports agree that incidence proportion is higher in the North of England compared with the South England, this difference remains unexplained by demographic (including deprivation) or risk factors.8–10 Additionally, another report found incidence to be highest in Cornwall and the Isles of Scilly in the South West, contrary to the trend of being highest in northern areas.41 It is unclear as to whether this report agrees with the others that, on the whole, incidence is higher in the North of England. All reports on regional trends used different geographic scales making comparisons difficult. Differences in geographic scale use may have an effect on epidemiology outcome measures.53 One suggested explanation of regional variation in incidence is the difference in care provided, for example, areas where multidisciplinary preventative care services are available may have reduced regional incidence compared with other areas.8 54
Two main sources of variation were found in reported MLEA incidence between reports. First, there were considerable differences in the methodology used across reports including differences in country, study period, case and population (denominator) exclusions, MLEA definition (and coding), data source, standardisation and statistic. For example, with Moxey et al9 and Ahmad et al10, the slightly different study period and differences in age exclusions, standardisation methods, denominator populations and MLEA codes contributed to a twofold difference in reported incidence proportion. Second, there were reporting quality issues including inconsistent terminology and poorly reported denominators. It was not possible to further determine reasons for or the effect of the variation as reports did not include enough information to be able to clarify this. Adherence to reporting guidelines would have aided in clarifying variation sources and effects however, adherence was low within included reports. Specifically, reports often failed to include: both crude (unstandardised and/or adjusted) and standardised whole study population outcome estimates; raw numerator and denominator values; both case and population (denominator) inclusion/exclusion criteria; and referencing and detailing standardisation methods and data source. In addition to including details listed in RECORD guidelines, it would be of particular use in this case for reports to provide a breakdown of how many times an individual is included in the analysis to aid in interpretation and understanding of multiple procedure incidence.
Database use has an effect on MLEA epidemiology reporting. All studies ascertained cases using secondary care databases such as HES and the NVR, which contain event-based data, and so only events within the study period can be analysed. Historical MLEA performed outside of the study period cannot be gained from these examples of event-based databases. This explains the finding that prevalence of MLEA has not been investigated. It is also not possible to obtain population (/control) data for analysis from these databases; this would limit the ability to explain the regional variation found in some reports that is currently unexplained by the available population demographic (including deprivation) and risk factor data sourced externally to secondary care databases. Another option would be to use primary care data, which contains the whole medical history of each registered patient and so prevalence could potentially be calculated and more detailed control data obtained for use in analysis. However, current primary care databases in the UK do not contain data on the whole population and are therefore only a population sample.55–57 One report did use primary care data from CPRD alongside HES to ascertain cases of MLEA; however, it was not clear how many cases were ascertained using primary care data. In addition to the loss of events due to population coverage of CPRD GOLD, this report excluded those with previous amputations and only counted one (the first) amputation per included individual further reducing the number of MLEA events counted. Another example of the effect database choice has on MLEA reporting is seen when considering the low case ascertainment of the NVR compared with HES. Although none of the reports using NVR calculated incidence proportion, using this database may underestimate MLEA incidence and could infer a potentially false increasing trends as case ascertainment improves. The lack of established linkages to the NVR and limited amount of patient data compared with HES may mean it could also be of limited use in further analysis.
Some reports ascertained cases in secondary care data and linked this to patient data in primary care records.32–36 39 43 This obtains additional case patient information but does not aid in calculating prevalence or gaining population/control data.
Comparison with other studies
A systematic review by Davies et al11 found many similar issues regarding denominator populations, MLEA coding and definition and general method differences. They state that ‘prevalence of MLEA ranges from 0.7 to 332.4 per 100 000 in the diabetic population and 3.0 to 76.1 per 100 000 in the general population’, a 480-fold and 25-fold difference, respectively. This review differed in inclusion criteria to Davies et al11 by excluding reports that included ‘minor’ amputations, including only studies that use routinely collected electronic health data, excluding studies only reporting regional data and by excluding subgroup data from the main review outcome. These review method differences resulted in a considerable reduction in the magnitude of variation. However, the magnitude is still large, and this review found additional sources of variation within the inclusion/exclusion criteria of reports, in multiple procedure counting and in standardisation techniques and data source. This review also included grey literature, investigated regional variation and discussed the effect of database use on MLEA epidemiology reporting.
As lower extremity amputation is a key healthcare quality indicator globally, national incidence of lower extremity amputation is an increasing topic of research in many countries.53 58–60 Systematic reviews and reports on the national and international incidence of lower extremity amputation have found similar problems with report comparisons as found in this review, that is, population differences, lower extremity amputation definitions, database characteristics and calculations methods.4 5 53 58–60
Implications for clinical practice and further research
Being unable to accurately estimate the UK incidence of MLEA has important implications for clinicians and policy makers who will be unable to gauge trends and allocate resources appropriately. This will impact on national service configuration of vascular, diabetes and rehabilitation services. Additionally, unexplained regional differences in incidence mean that any resources allocated to specific areas may not be directly targeted at the cause. It also leads to inequalities in healthcare access and outcomes, inefficiency in resource allocation and uncertainty of the effect of preventative measures.
As MLEA definitions varied and were often not consistent with medical code lists, to aid in comparisons of future research, an internationally agreed definition of MLEA, alongside a corresponding medical coding list, should be agreed on. Additionally, the appropriate reporting guidelines (STROBE, and more specifically, RECORD) should be strictly adhered to. Reports (particularly peer reviewed) will, by nature, differ in research question, but by adhering to reporting guidelines, the data should be able to be unpicked so that sources of variation and their effect are more easily identified.
The use of primary care databases for ascertaining case and population data should be explored further to establish whether it is possible to estimate MLEA prevalence and explain the reasons for regional variation. Furthermore, current trends in MLEA in those with type 2 diabetes need to be investigated to ascertain whether the evidence of an increase trend found by one report continues.
Strengths and limitations
The main strength of this review is the extensive search strategy including a comprehensive grey literature search. Although not peer reviewed, the included grey literature reports were found to be of no lesser quality, on the whole, than peer-review research and so were analysed alongside peer-review reports. Other strengths include the clarification of epidemiological calculations and population definitions, the adherence to the PRISMA reporting guidelines and the peer-reviewed protocol.19
This systematic review was limited to reports on MLEA, so reports that did not distinguish between major and minor amputations were excluded. Only reports published since January 2009 were included. Outcome measures from these reports prior to 2009 were included in the narrative synthesis so may not be reflective of current trends. Some reports published prior to 2009 with data available from 1996 may be available but excluded due to publication date. Although UK grey literature sources were searched thoroughly, international sources (eg, WHO websites, etc) were not, and thus, there may be additional international reports fitting the criteria that were missed.
Moreover, this review was limited by the lack of reports with comparable methods, which led to the inability to statistically pool data. It was also limited by data availability. Notably, the majority of the data is from England; some reports included cases from Wales and Northern Ireland; however, none focused on these countries specifically. Additionally, the event-based nature of the databases used by the included reports meant that determining and defining multiple amputations per patient and therefore also prevalence was problematic. This limitation is not restricted to the UK and has been a finding of reports globally.4 5 53 58–60
Ranges in reported incidence were sensitive to the inclusion of particular reports, for example, removing the report that analysed only PAD-related MLEA (excluding many who experienced MLEA related to diabetes who had no PAD-associated diagnoses) would reduce this to a twofold difference in the general population.4 Removing the report where the application of standardisation methods inflated incidence proportion by over three times the crude value would result in a reduction to a twofold difference in reported MLEA incidence proportion in the population with diabetes.32
Conclusions
The UK incidence and trends in MLEA remain unclear with estimates varying widely. There has been no research into the prevalence of MLEA. Encouragingly, there is no evidence of an increase in MLEA over time in the general population despite the national increase in diabetes type 2 diagnoses. There is, however, dated evidence of an increase in MLEA in those with type 2 diabetes. Variation in reporting is due to differences in populations, methods and MLEA definitions, inaccurate calculations and terminology. There is evidence for regional variation in incidence; however, the reasons behind this are unexplained. This review highlights the need for improved MLEA epidemiology reporting with adherence to RECORD reporting guidelines. Importantly, an internationally agreed MLEA definition and code list is required. It also highlights the restrictive event-based nature of secondary care data on analysis and the potential for further research of MLEA epidemiology using primary care data that could provide a prevalence estimate and the reasons behind the regional variation in MLEA in the UK.
Data availability statement
Data are available upon reasonable request.
Ethics statements
Patient consent for publication
Acknowledgments
We would like to thank George Davies and the George Davies Charitable Trust for the charitable donation that help fund this work. This project was supported by the National Institute for Health Research (NIHR) Applied Research Collaboration East Midlands.
References
Supplementary materials
Supplementary Data
This web only file has been produced by the BMJ Publishing Group from an electronic file supplied by the author(s) and has not been edited for content.
Footnotes
Contributors AM, RDS and LJG conceived and designed the study. CJP and AM created and performed the search. AM, JSMH and ATON screened, extracted data and undertook quality assessment. AM analysed the data, supervised by LJG and RDS. AM drafted and revised the manuscript, which was reviewed by all authors. All authors approved the final draft. The corresponding author attests that all listed authors meet authorship criteria and that no others meeting the criteria have been omitted.
Funding AM, JSMH and ATON are funded through the George Davies Charitable Trust (Registered Charity Number 1024818). RDS is part funded through this Trust.
Disclaimer The views expressed are those of the author(s) and not necessarily those of the NIHR or the Department of Health and Social Care.
The funders had no role in the design and conduct of the study, the collection, analysis and interpretation of the data, or the preparation, review or approval of the manuscript.
Competing interests Competing interests: All authors have completed the ICMJE uniform disclosure form at www.icmje.org/coi_disclosure.pdf and declare: RDS reports grants from George Davies Charitable Trust during the conduct of the study and is Chair of the Vascular CRG for NHS England. All other authors declare no competing interests or activities that could appear to have influenced the submitted work.
Provenance and peer review Not commissioned; externally peer reviewed.
Supplemental material This content has been supplied by the author(s). It has not been vetted by BMJ Publishing Group Limited (BMJ) and may not have been peer-reviewed. Any opinions or recommendations discussed are solely those of the author(s) and are not endorsed by BMJ. BMJ disclaims all liability and responsibility arising from any reliance placed on the content. Where the content includes any translated material, BMJ does not warrant the accuracy and reliability of the translations (including but not limited to local regulations, clinical guidelines, terminology, drug names and drug dosages), and is not responsible for any error and/or omissions arising from translation and adaptation or otherwise.