Article Text

Abstract
Objectives To analyse the relationship between health need, insurance coverage, health service availability, service use, insurance claims and out-of-pocket spending on health across Indonesia.
Design Secondary analysis of nationally representative quantitative data. We merged four national data sets: the National Socioeconomic Survey 2018, National Census of Villages 2018, Population Health Development Index 2018 and National Insurance Records to end 2017. Descriptive analysis and linear regression were performed.
Setting Indonesia has one of the world’s largest single-payer national health insurance schemes. Data are individual and district level; all are representative for each of the country’s 514 districts.
Participants Anonymised secondary data from 1 131 825 individual records in the National Socioeconomic Survey and 83 931 village records in the village census. Aggregate data for 220 million insured citizens.
Primary outcome measures Health service use and out-of-pocket payments, by health need, insurance status and service availability. Secondary outcome: insurance claims.
Results Self-reported national health insurance registration (60.6%) is about 10% lower compared with the insurer’s report (71.1%). Insurance coverage is highest in poorer areas, where service provision, and thus service use and health spending, are lowest. Inpatient use is higher among the insured than the uninsured (OR 2.35, 95% CI 2.27 to 2.42), controlling for health need and access), and poorer patients are most likely to report free inpatient care (53% in wealth quintile 1 vs 41% in Q5). Insured patients spend US$ 3.14 more on hospitalisation than the uninsured (95% CI 1.98 to 4.31), but the difference disappears when controlled for wealth. Lack of services is a major constraint on service use, insurance claims and out-of-pocket spending.
Conclusions The Indonesian public insurance system protects many inpatients, especially the poorest, from excessive spending. However, others, especially in Eastern Indonesia cannot benefit because few services are available. To achieve health equity, the Indonesian government needs to address supply side constraints and reduce structural underfunding.
- health services administration & management
- health policy
- health economics
Data availability statement
Data are available in a public, open access repository. The data management and analysis files in Stata format (.do files) are available in the senior author’s research repository at https://doi.org/10.7910/DVN/2Q37XL. While the paper reports data at the regional level, in the repository we provide data for each of Indonesia’s 514 districts in Supplementary tables, as well as in more easily downloadable Excel format. These are made available by the authors under a CC0 licence, though in view of the work that goes in to this type of data integration, we would appreciate full citation by anyone re-using these resources.The data management and analysis files in Stata format (.do files) are available in the senior author’s research repository at https://doi.org/10.7910/DVN/2Q37XL. While the paper reports data at the regional level, in the repository we provide data for each of Indonesia’s 514 districts in Supplementary tables, as well as in more easily downloadable Excel format. These are made available by the authors under a CC0 licence, though in view of the work that goes in to this type of data integration, we would appreciate full citation by anyone re-using these resources.
This is an open access article distributed in accordance with the Creative Commons Attribution Non Commercial (CC BY-NC 4.0) license, which permits others to distribute, remix, adapt, build upon this work non-commercially, and license their derivative works on different terms, provided the original work is properly cited, appropriate credit is given, any changes made indicated, and the use is non-commercial. See: http://creativecommons.org/licenses/by-nc/4.0/.
Statistics from Altmetric.com
Strengths and limitations of this study
Our study brings together four large, data sets, representative at the level of each of the country’s 514 districts, allowing for exploration of diversity, and for triangulation between data sources.
Our analysis pays particular attention to geographical differences in insurance coverage, service availability and health spending in one of the world’s largest single payer health insurance systems.
Our study is limited by lack of granular information on health needs and outcomes.
We were unable to link service access measures at the village or subdistrict level because geographical identifiers were not made available.
Introduction
In 2014, Indonesia, the world’s fourth most populous nation, introduced a national health insurance scheme, Jaminan Kesehatan Nasional (JKN). Politicians set an ambitious target: to sign up all Indonesians, and thereby achieve Universal Health Coverage (UHC) by 2019.1–3 Although the target was missed, great strides have been made towards it, at least in terms of participant registration. The scheme reports over 220 million participants (31 July 31st, 2020), 82% of the national population of 268 million,4 making JKN one of the world’s biggest single-payer health insurance schemes. In accordance with the WHO’s vision for UHC,5 one of the goals of JKN was to increase equitable access to health services without risk of impoverishment, across the nation. However, the limited availability of health services means that registration of participants may not translate into effective ‘coverage’.
Participation is compulsory, with premiums paid by employers. The state, which covers premiums for its employees, the poor and the near-poor—pays 69% of all premiums.4 Non-poor Indonesians in unsalaried jobs—some 30 million people—should pay their own premiums. In practice, many do not.4 6 7 For the first 4 years of the programme, monthly premiums started at IDR25 500 (US$1.80), rising to IDR80 000 (US$5.52) for first class service.8
Over 2300 hospitals, 1700 of them private, accept JKN-funded patients.9 Broadly, JKN pays for primary care (inpatient and outpatient) through capitation, while hospital care is reimbursed against diagnostic codes.10–12 Many sophisticated and/or expensive treatments such as hip replacements and heart septal surgery are covered at all premium levels.13 The combination of low premium and generous coverage has produced annual deficits since the programme’s inception.14 15 The cumulative deficit was 51 trillion rupiah (US$3.7 billion) at the end of 2019.15
In a bid to reduce the deficit, premiums were approximately doubled in January 2020, but the Constitutional Court ruled that the increase in contributions violated the right to health, and it was reversed, underlining the politically charged landscape in which health reform takes place.8 16 In May 2020, the government again increased the premium.17 By September 2020, the insurer’s Director General told the press 1.5 million people had opted to lower their premium class.18 19
Achieving affordable access to quality health services nationwide is a particular challenge given Indonesia’s exceptional diversity. Over 60% of the population lives in Java, just 6% of the land mass. There are a further 7000 inhabited islands, with population density ranging from 10/km2 in Papua and North Kalimantan provinces to 1400/km2 in West Java.20 Income and health needs are similarly diverse; for example, 43% of children in East Nusa Tenggara are stunted, compared 9% in Jakarta province.21
The Government’s most recent Health Sector Review, published 5 years into the JKN programme, observed that the supply of health services remains a major constraint in many areas.22 Studies in Indonesia and other countries suggest that healthcare cumulates in areas with higher income and fewer critical health needs.2 23 24 This study looks at the relationship between health need, service availability, insurance status and financial protection across Indonesia.
We merge four nationally representative data sources to undertake that analysis. If JKN enables equitable health service access while protecting against impoverishment, we would expect areas with highest health needs to have highest levels of service use and high insurance claims, with limited variation in out-of-pocket (OOP) spending nationwide. However, given the supply constraints reported in the national health review,22 we hypothesised that we would find a more complex relationship, as illustrated in figure 1. At the aggregate level, we expect areas with more services to report higher claims. At the individual level, we expect that insured service users would spend less OOP compared with uninsured service users.
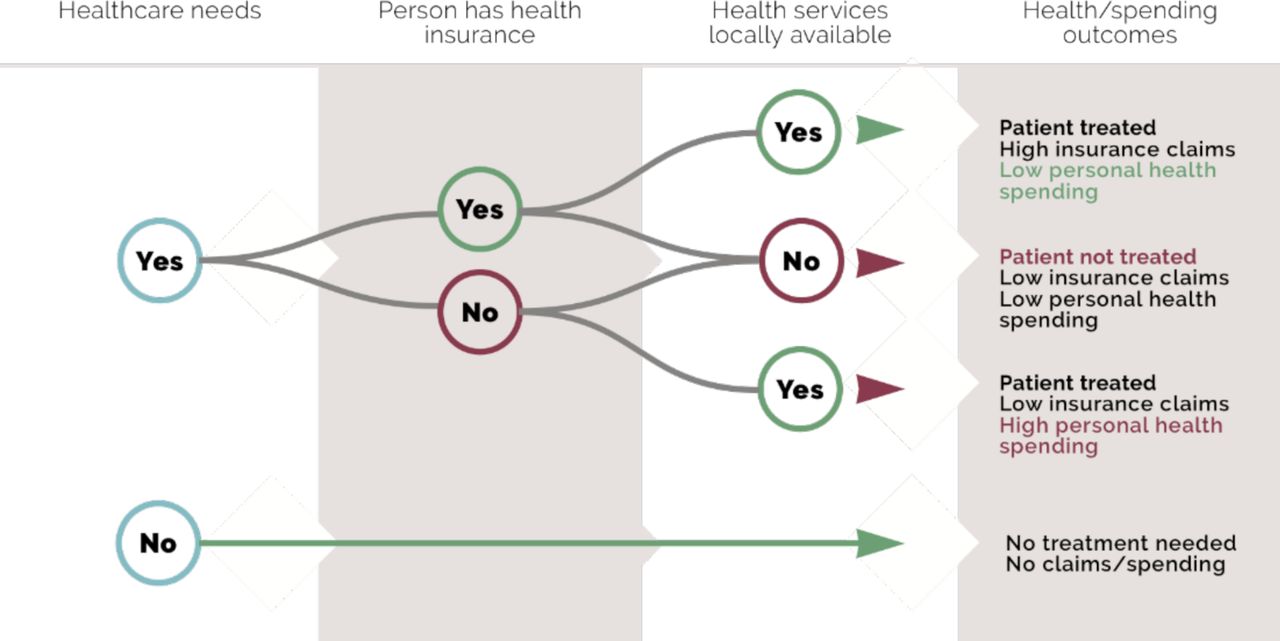
Expected relationship of insurance claims and out-of-pocket spending with health need, insurance status and service availability.
Methods
Data
We used four different datasets, all referring to year-end 2017 or mid 2018. They are:
A National Socioeconomic Survey or Survey Sosial Ekonomi Nasional (SUSENAS) 2018, a cross-sectional household survey, statistically representative of all districts in Indonesia: 1 131 825 individual records.
A national census of villages or Survei Potensi Desa (PoDes) 2018, a census of all villages in Indonesia: 83 931 village records.
A Population Health Development Index or Indeks Pembangunan Kesehatan Masyarakat 2018, a compound indicator of health status calculated at the district level, based on data collected in the national health survey (RisKesDas), statistically representative of all districts in Indonesia: 514 district records.
National insurance records from the Social Security Agency for health or Badan Penyelenggara Jaminan Sosial Kesehatan (BPJS) end 2017, reported at the district level: 514 district records.
In addition, geographic information system data from Statistics Indonesia, with 2017 administrative boundaries, were used to generate district and province maps.
Further information about these sources, and the data derived from each, is given in online supplemental file 1. Online supplemental file 2 shows the steps followed to merge these different data sets for analysis. All online supplemental materials, as well as data management and merge codes for reuse, are provided at https://doi.org/10.7910/DVN/2Q37XL.
Supplemental material
Supplemental material
Measures
Health need
We derived a proxy for health need from the Ministry of Health’s 2018 Public Health Index. The index (0–1) includes reproductive, maternal and child and environmental health elements, disease prevalence and service access. Higher values indicate better community health. We recalculated the index excluding service access, and inverted it (100 – (100×Public Health Index) to indicate district health need.
Insurance status
In SUSENAS 2018, individuals self-report health insurance by type: JKN (subsidised or non-subsidised), district public health insurance scheme, private insurance or supplementary work place insurance. In the analysis reported here, we classified people as insured if they reported at least one form of health insurance, and also calculated those reporting any public insurance (JKN or district health insurance). We calculated insurer-reported coverage by dividing registered participants by district population.
OOP payments
In SUSENAS 2018 data, we calculated OOP for health by summing household payments to formal health service providers and spending on medicines and medical supports, for example, prostheses. Insurance premiums are excluded. We estimated per capita health spending by dividing all household spending on health by number of household members. Per capita spending on inpatient care was calculated by dividing inpatient spending over the previous 12 months by the number of household members reporting inpatient care in the previous 12 months.
Health service access
We constructed a proxy for restricted physical access to health services at district level using village census data. In PoDes, village heads are asked whether various health services were present in the village, and if not, how easy each was to reach. We classified access to each as restricted if the nearest facility was reported as ‘hard’ or ‘very hard’ to reach, and as easy if it was ‘easy’ or ‘moderately easy’ to reach, or present in the village. For each district, we then calculated the percent of villages which have no easy access to: (1) a hospital, (2) any inpatient services and (3) any one of: any inpatient services, primary health centre, private clinic, private doctor, maternity waiting home, registered midwife, pharmacy. In addition, we used SUSENAS data to capture actual realisation of access as self-reported utilisation in inpatient care in the preceding 12 months and outpatient care in the preceding month.
Region
We grouped provinces into four regions which also share broad economic characteristics, as shown in table 1 and mapped in online supplemental file 3a (see the Results section). From west to east the regions are Sumatera and western islands; Java and Bali; West Nusa Tenggara (NTB), Kalimantan, Sulawesi; and East Nusa Tenggara (NTT), Malukus, Papuas.
Supplemental material
Demographic and health-related characteristics, by Indonesian region, 2018
Statistical analysis
We used STATA/MP V.16.1 for Mac to perform data management, analysis, and maps configuration. In collapsing data from the individual-level dataset (SUSENAS), we used individual sample weights. For spending variables, we calculated median values by district/province/region. For binary variables, we calculated the percentage by district/province/region. No weights were used in collapsing the village level data, since PoDes is a census. When collapsing BPJS data and for population totals, we summed district totals to derive province and regional totals.
We performed descriptive and bivariate analysis of categorical variables, looking first at individual areas of interest (health need, insurance status, service use, insurance claims and OOP spending). We then proceeded through the associations in the logical framework illustrated in figure 1, building up a regression model using all salient variables and investigating factors associated first with use of services, then with OOP spending on health (individual level), and with per capita insurance claims (district level). Analysis files are provided at https://doi.org/10.7910/DVN/2Q37XL .
Patient and public involvement
No members of the public or patients were involved in this study.
Results
Indonesia’s regional diversity in terms of population, health indicators, service use and insurance coverage is illustrated in table 1. The far eastern region (covering the provinces of NTT, Maluku, North Maluku, West Papua and Papua) stands apart from the others in having the smallest population and the lowest expenditure (including health expenditure) while scoring highest on health needs. The Java/Bali region, in contrast, is most populous, richest, scores lowest on health needs, but has the highest OOP spending on health.
While the following section reports data at the regional level, tables giving the same data at a district level are provided separately, which can all be found at: https://doi.org/10.7910/DVN/2Q37XL. We also provide the data underlying the district-level tables in Excel format, which may be imported into statistical software for reuse.
Health status
The index of health need (excluding measures of access) ranges from 23.4 in Gianyar, Bali, to 63.5 in Paniai, Papua. Papua is home to 15 of the 20 districts with poorest health status (see online supplemental file 3b). Yet Papuans are less than half as likely to report recent symptoms of illness compared with people in Java and Bali; there is a weak inverse relationship between the Ministry of Health’s index of health need and self-reported recent illness (online supplemental file 4).
Supplemental material
Insurance coverage
We have two sources of data on insurance coverage: individual reports and number of members reported by the insurer. The discrepancies between these will be reported in detail elsewhere. Overall, the insurer reported coverage of 71.1%, compared with 60.6% JKN membership reported by the population. Since people’s perception of their own insurance cover is more likely to influence health seeking behaviour, we here restrict our analysis to self-reported insurance status, which are reported in table 2. Online supplemental file 3c shows the diversity at the district level, by most generous cover (4.4% of Indonesians report more than one source of health insurance). People in poorer households (by non-health consumption) are most likely to say that they are uninsured compared with richest household (42.4% and 26.9%, respectively). However, poorest household quintiles are also most likely to report state-subsidised insurance: 51.8%, compared with 25.8% in the richest households (online supplemental file 5).
Supplemental material
Insurance coverage, claim and out of pocket, 2018
Availability of health services and service use
Availability of health services and service use varies widely across the country. In 5% of Indonesia’s districts, no village has easy access to a hospital, while in 17% of districts all villages have easy access. In household surveys, 4.7% of Indonesians reported using inpatient services in the previous year. At the provincial level, a low of 2.6% of Papuan residents (in the far East) reported using inpatient services, rising to 6.7% in Aceh, in the far West (table 3, online supplemental file 3d and 3e).
Availability of health services and inpatient service use, by region, 2018
Insurance claims and OOP spending
As table 2 and online supplemental file 3f show, insurance payments were higher in Java and Bali than in Eastern Indonesia, both on a per-claim and per-participant basis (using the insurer’s count of registered participants). In all regions, total claims were between 4.2 and 5.3 times higher in districts classified as cities (kota, n=98) compared with largely rural districts (kabupaten, n=416).
On the aggregate level, OOP spending on health was highest in areas where insurance claims were also high (online supplemental file 6). Median household expenditure on health (excluding insurance premiums and transport) was 180% higher in Java and Bali than in the eastern provinces. Total OOP health spending was higher among the insured than the uninsured (table 2). Some uninsured people reported paying nothing for their inpatient care, which in some districts is free to all district residents at public facilities. However, the insured were nearly twice as likely to receive free inpatient care; bills for those who did pay were on average 20% lower than those faced by the uninsured.
Supplemental material
Figure 2 and online supplemental file 3g show the numbers receiving inpatient care, and per capita spending per inpatient, by insurance status and wealth (non-health consumption level). Wealthier households are more likely to access inpatient services than poorer households; the difference is most marked among the insured. Proportionately, the rich are less likely to pay nothing for those services, but also less likely to pay high amounts relative to other household consumption. In absolute terms, insured people from wealthy households are the largest consumers of free inpatient care in Indonesia.

Numbers reporting inpatient service use, by insurance status, non-health consumption quintile and percentage of household consumption spent on inpatient services.
Online supplemental file 7 summarises the data given in tables 1–3. The radar graph illustrates inequalities between the different regions using all indicators. The prosperous region Java/Bali with lowest health needs, moderate insurance coverage, and best access to healthcare services, consumes most healthcare, and has the highest OOP spending and insurance claims per capita. In contrast, the poorer provinces of Eastern Indonesia (NTT, Malukus, Papuas) have the highest health needs and insurance coverage, but lowest access to healthcare services, and thus the lowest service use, OOP spending and insurance claims.
Supplemental material
Regression model
Our regression model followed the pathway indicated in figure 1 for dependent variables including service use, OOP spending and aggregate insurance claims, looking separately at inpatient and outpatient services.
Compared with the districts with the highest health status, districts with lower health status generally have lower odds of using inpatient service, lower spending on inpatient and outpatient services, and lower insurance claims. Results for using outpatient service are less pronounced.
Being insured is associated with higher OOP spending on health services. Use of inpatient services, household and insurer spending on both inpatient and outpatient services are highest in districts with higher health status, controlling for both insurance status and access to services (table 4). Having health insurance is associated with 135% higher odds of using inpatient services compared with the uninsured after controlling for district health status and access to services, while among those reporting symptoms in the last month, the odds of using outpatient services increase by a quarter.
Use of health services, out-of-pocket spending and aggregate insurance claims—regression model including district health needs index and access to services, and personal insurance status
Restricted geographical access to inpatient services is independently associated with lower hospitalisation in districts where more than 20% of villages report restricted access to such services; there is a linear reduction in spending by households and insurers with increasingly constrained access. In districts with poorest access, the odds of using inpatient services are around 40% lower than in the best served districts; OOP spending and insurer spending on inpatient care per registered participant are 46% and 71% lower, respectively. Monthly spending on outpatient care among those reporting symptoms shows a similar pattern, but dollar amounts are small.
Table 5 shows the same model, with the addition of socioeconomic status measured by non-health consumption. Household wealth does not greatly influence use or spending outcomes for outpatient care. While insurance remains associated with higher service use, its independent association with higher OOP spending disappears for inpatient care. Spending rises sharply with wealth, for both inpatient and outpatient services. Restricted geographical access to inpatient services continues to predict low service use and spending in districts where over 20% of villages report restricted access.
Use of health services and out-of-pocket (OOP) spending—regression model including district health needs index and access to services, personal insurance status and household wealth
Discussion
Our study for the first time integrated data from several large-scale representative surveys, censuses and administrative records collected by national authorities to investigate Indonesia’s progress towards UHC through a mandatory national health insurance scheme, JKN. The integrated data from 2018 allowed us to look at the relationship between health needs, insurance status, health service use and insurer and patient spending at the level of Indonesia’s 514 district in JKN’s fourth year. While the insurer reported that 71% of the population were JKN members, only 61% of citizens in a nationally representative household survey reported being insured by JKN. Surprisingly, 26% of respondents in the richest quintile reported state-subsidised insurance, suggesting that subsidised premiums could be better targeted. Further, self-reported insurance coverage falls with socio-economic status (from 76% in the highest wealth quintile to 62% in the lowest). Many of the 38% of the people in poorest households who report being uninsured likely qualify for subsidised insurance. Possibly, the government is paying premiums for some poorer people without their knowledge. Additionally, people may report being uninsured simply because insurance is not of any use to them, because there are no health services within easy reach. Even in the self-reported data, however, JKN coverage is highest in the NTT, Maluku, Papua region, where it correlates inversely with physical access to services. In this eastern part, only 27% of villages have easy access to a hospital in contrast with 93% in Java and Bali. These findings mirror those of Nandi et al, who reported that poorer areas of India have higher insurance enrolment compared with wealthier areas, but on the contrary lower availability of hospitals.24 These data call into question the use of participant registration as a measure of UHC, and raise the possibility that equating registration with coverage is more useful for political optics than for effective programme evaluation.25
Our findings confirm empirically the assertion in the national health review20 that limited service provision constrains the utility of national health insurance for citizens in parts of the country, particularly in poorer Eastern regions where health needs are greatest. While self-reported possession of health insurance was generally associated with increased use of services, multivariable analyses suggest that in districts where over 20% of villages have restricted access to services, this constrained service availability is associated with lower service use, lower insurer spending and lower OOP spending on health, especially for inpatient services. In short, more money is spent (by both the insurer and patients) in places where there are more health services to spend it on. These are also the areas with the lowest health needs, probably in part because of the access to services. Studies in other low and middle income countries report similar findings.26–29 Our study is also in line with earlier work in Indonesia, showing that JKN claims per capita for non-communicable diseases are consistently higher in Jakarta province (the national capital) than in largely rural NTT,30 31 a difference attributed to differences in supply.30
The radical decentralisation undertaken by Indonesia since 2001 aimed to empower district governments in these more remote areas to apportion funding (including for health) in ways that better meet local needs,32 thus reducing inequity. Pre-JKN academic estimates of the cost of meeting basic health needs show significant variation by area (ranging from US$15 in Yogyakarta to US$48 in rural North Maluku).33 JKN, however, reverts to a largely centralised ‘one-size-fits-all’ reimbursement model.1 In Eastern Indonesia restricted service availability appears to restrict spending, leading to low reimbursement and leaving the premia paid on behalf of the poorest citizens in those areas available to subsidise healthcare for citizens in richer areas, where health services are more plentiful.
Having said that, it appears that for many poorer families who can access services and who are insured, JKN provides effective protection against impoverishing spending. Hospitalisation was far more common among the insured than the uninsured at all income levels, suggesting that insurance removed a significant barrier to use of inpatient services. Despite this, OOP spending remained higher among the insured, as was the case in pre-JKN days.27 34 35 Controlling for access to health services and district health index, the insured spent 9% more on inpatient services and 15% more on outpatient services than the uninsured. It is likely that newly insured patients may be emboldened to seek services which are not fully covered, sometimes because healthcare providers seek profit by promoting ‘off-plan’ services, including those not covered by the scheme, including branded medicines, laboratory tests and consultation with specialist doctors without referral.36–38 This ‘gateway effect’ has been seen in other countries embarking on scale-up of insurance, including China, Ghana, Kenya and India.28 39–41 In addition, patients may prefer to pay OOP for outpatient services, in particular, since they are relatively affordable, perceived as higher quality, and less burdensome in terms of queuing and paperwork.41–44
Findings from other low-income and middle-income countries about the financial protection provided by national health insurance schemes are mixed.36 44 Using spending of 10% of a household’s monthly per capita non-health budget on inpatient care as a measure of the ‘catastrophic’ spending health insurance is designed to avoid, Indonesia appears to be performing relatively well, at least for those who use services. (Like insurance registration, low out of pocket spending is not a measure of financial protection in areas where there are no services to spend money on). Looking just at those who reported using inpatient services, 87% of insured inpatients in the poorest income quintile spent less than 10% of their non-health budget on hospitalisation, and for over half, the care was completely free. This compares with the national health insurance in Zimbabwe, also around 87% in the poorest quintile protected from catastrophic health expenditure.45
Implication for research and practice
Indonesia has made great strides since 2014 in setting up a public health insurance system. By 2018 it was effectively protecting many poor families from excessive spending on inpatient care. However, its benefits remained limited for the millions of Indonesians—especially those living in areas with greatest health needs—who were unable to benefit from their health insurance because they have extremely limited access to formal health services.
A greater focus on equity in both supply and health financing would help Indonesia achieve the true aims of UHC: to ensure that all citizens have fair access to basic health services without being pushed into poverty. This would require greater investments in health overall. Compared with other countries in the region Indonesia’s public investment in health is relatively low, at 2.9% of gross domestic product compared with 3.8% in Thailand and an average of 5% in East Asia and Pacific (not including high income countries).46 If the government had the fiscal space to investment the regional average, a shift to financing public health provision out of general taxation (as suggested by Yates47 and Fenny et al48) might be feasible. However, given Indonesia’s inefficient tax system and low tax yield, more sustainable solutions might include hypothecated taxes on luxury goods, or reverting to an earlier system which made greater use of local government subsidies in wealthier areas.49 50 Our study, which shows a substantial increase in out of pocket spending by wealth, suggest that progressive contributions based on income, suggested by Reeves et al,50 may also be a viable approach. Finally, the politically unpalatable option of prioritising reimbursement to meet the most urgent needs of the poorest citizens could be considered.
Health equity can not be achieved only by finding a sustainable financing model to pay for service provision. Indonesia also needs to invest substantially in improving the supply of services in many areas of the country. The directly elected district governments responsible for service provision could be incentivised to invest more in this area, since it may be a viable way of generating political popularity, while providing opportunities for local patronage.1 But success in providing wider access to necessary services will be a double-edged sword: fulfilling unmet demand will increase claims on JKN, which is already deeply in deficit.
Limitations
Detailed analysis of merged data collected by Indonesian government agencies could help further inform decision making. Our study is limited by lack of granular information on health needs and outcomes. In addition, the statistics agency was unwilling to release geographical identifiers at levels lower than district for the household survey data, so we were unable to link service access measures at the village or subdistrict level. Our dataset nonetheless allows for the most granular analysis to date across a wide range of health service use and spending-related measures in one of the world’s most diverse nations. It suffers from the common constraint of using secondary, quantitative data—the inability to explain outliers, or to pinpoint the political, economic and social factors that explain why more has not yet been done to address inequity within JKN.
Future research
Our analysis was cross-sectional, so does not reflect the dynamism of the situation. However, two of the datasets —SUSENAS and JKN claims data—are available annually, so many elements of this analysis could be repeated in an investigation of trends over time. We believe this might provide insights into which elements of inequity are temporal and which are structural. The data could also be used in studies exploring in greater detail the differences in service use between public and private providers, particularly in relation to insurance status and OOP spending.
Conclusion
Successful progress of JKN is shown by the number of insured people. However, healthcare access is deterred due to supply-side constraints. Insured individuals have higher OOP than uninsured. However, among individuals using inpatient care, the insured incur lower OOP. The priority concern of the government to bring UHC forward should focus on policies and efforts on providing equitable access to those districts without access.
Data availability statement
Data are available in a public, open access repository. The data management and analysis files in Stata format (.do files) are available in the senior author’s research repository at https://doi.org/10.7910/DVN/2Q37XL. While the paper reports data at the regional level, in the repository we provide data for each of Indonesia’s 514 districts in Supplementary tables, as well as in more easily downloadable Excel format. These are made available by the authors under a CC0 licence, though in view of the work that goes in to this type of data integration, we would appreciate full citation by anyone re-using these resources.The data management and analysis files in Stata format (.do files) are available in the senior author’s research repository at https://doi.org/10.7910/DVN/2Q37XL. While the paper reports data at the regional level, in the repository we provide data for each of Indonesia’s 514 districts in Supplementary tables, as well as in more easily downloadable Excel format. These are made available by the authors under a CC0 licence, though in view of the work that goes in to this type of data integration, we would appreciate full citation by anyone re-using these resources.
Ethics statements
Patient consent for publication
Ethics approval
The study involved no primary data collection. We obtained permission to use the data for research from national agencies: Statistics Indonesia (SUSENAS and PoDes) and from the Health Social Security Agency (JKN data). All data were anonymised before being provided to us.
Acknowledgments
This study was funded by Netherlands Universities Foundation for International Cooperation (NUFFIC). ABP received funding from Indonesia Endowment Fund for Education (LPDP). We thank D.L. Dick Willems and R.S. Padmawati for valuable input and support.
References
Supplementary materials
Supplementary Data
This web only file has been produced by the BMJ Publishing Group from an electronic file supplied by the author(s) and has not been edited for content.
Footnotes
Twitter @PratiwiAgnes12, @TrynkeHoekstra, @ElizabethPisani
Contributors ABP, EP, MOK and AGM conceptualised the study. EP and HS performed the data cleaning and management. ABP, EP, HS and TH performed the data analysis. EP and HS designed the figures. AGM and MOK supervised the project. ABP, EP, HS, MOK and TH contributed to drafting the manuscript, with input of AGM. All authors have approved the final manuscript.
Funding Netherlands Universities Foundation for International Cooperation (NUFFIC). Grant number NICHE/ IDN/ 226: CF 9900. ABP received funding from Indonesia Endowment Fund for Education (LPDP) number 201909222915503.
Map disclaimer The inclusion of any map (including the depiction of any boundaries therein), or of any geographic or locational reference, does not imply the expression of any opinion whatsoever on the part of BMJ concerning the legal status of any country, territory, jurisdiction or area or of its authorities. Any such expression remains solely that of the relevant source and is not endorsed by BMJ. Maps are provided without any warranty of any kind, either express or implied.
Competing interests None declared.
Provenance and peer review Not commissioned; externally peer reviewed.
Supplemental material This content has been supplied by the author(s). It has not been vetted by BMJ Publishing Group Limited (BMJ) and may not have been peer-reviewed. Any opinions or recommendations discussed are solely those of the author(s) and are not endorsed by BMJ. BMJ disclaims all liability and responsibility arising from any reliance placed on the content. Where the content includes any translated material, BMJ does not warrant the accuracy and reliability of the translations (including but not limited to local regulations, clinical guidelines, terminology, drug names and drug dosages), and is not responsible for any error and/or omissions arising from translation and adaptation or otherwise.