Article Text

Abstract
Objectives It is unclear what is driving rising colorectal cancer (CRC) treatment costs in China, whether an adjustment in drug prices changes use and total cost. This study aims to estimate trends in drug use, prescribing patterns and spending for antineoplastic drug therapies for CRC in major cities of China.
Methods Information from 128 811 antineoplastic drug prescriptions in CRC was retrospectively collected from the Hospital Prescription Analysis Cooperative Project. The prescriptions extracted included demographic information of patients, the generic name and the price of antineoplastic drugs. The Mann-Kendall and Cochran-Armitage trend test was used to estimate the trends of antineoplastic agent usage.
Results The number of antineoplastic prescriptions ranged from 18 966 in 2015 to 34 219 in 2019. Among the prescriptions collected in this study, the annual cost of antineoplastic drugs increased by 117.2%, and average prescription cost increased by 20%. Throughout the study period, the most prescribed antineoplastic drugs were capecitabine, oxaliplatin, fluorouracil and irinotecan, representing 49%, 27%, 21% and 9% of (per cent of visits (PV)). The PV of bevacizumab and cetuximab increased by 494% and 338% (from 1.8% and 1.3% in 2015 to 10.7% and 5.7% in 2019). In prescribing patterns of antineoplastic agents, monotherapy gradually decreased, while combination therapy, especially three-drug combination, increased significantly from 1.35% to 7.31%.
Conclusion This study estimated recent trends of antineoplastic drug use and expenditure for Chinese patients with CRC. These results would inform CRC treatment decisions, including health insurance negotiation, precision therapy access, allocation of research funding and evaluation of the financial burden of CRC drug treatment.
- oncology
- epidemiology
- chemotherapy
Data availability statement
Data are available upon reasonable request. Data are available from the Second Affiliated Hospital of Zhejiang University Data Access/Ethics Committee for researchers who meet the criteria for access to confidential data. I may be contacted for all interested readers to request the data.
This is an open access article distributed in accordance with the Creative Commons Attribution Non Commercial (CC BY-NC 4.0) license, which permits others to distribute, remix, adapt, build upon this work non-commercially, and license their derivative works on different terms, provided the original work is properly cited, appropriate credit is given, any changes made indicated, and the use is non-commercial. See: http://creativecommons.org/licenses/by-nc/4.0/.
Statistics from Altmetric.com
Strengths and limitations of this study
This study used hospital prescription records from 88 hospitals in the Hospital Prescription Analysis Cooperative Project to present the first analysis of the trend of antineoplastic agent usage in patients with CRC in eight major cities in China.
We used time-series analysis to estimate changes in drug utilisation and expenditure in different drug classes, subclass and specific drugs, over the last 5 years. Current identifying practice might help interpret existing cost-effectiveness and guide future cost-effectiveness of drugs.
This study only assessed the overall use of antineoplastic drugs in patients with CRC and did not distinguish the disease stage, individual patient factors or regional factors.
We looked at all of the antineoplastic drugs during the study period, some of these drugs are used to treat other concurrent cancers.
Introduction
Cancer has become a leading cause of death in China, with an increasing burden of cancer incidence and mortality observed over the past half century.1 The 2018 China Cancer Statistics Report showed that the incidence and mortality of colorectal cancer (CRC) in China ranked third and fifth among all malignant tumours, with 376 000 new cases and 191 000 deaths, respectively. Furthermore, the incidence and mortality of CRC in China have maintained an upward trend.2 Medical expenditures for CRC diagnosis and treatment in China are substantial and have increased rapidly.3 What accounts for the increase in CRC drug expense in China is not yet fully understood. We suppose that both patient and drug factors may significantly affect the costs.
Antineoplastic drug treatment is an important aspect of CRC therapy. At present, the antineoplastic drugs of CRC mainly include chemotherapy and targeted therapy. Overall, chemotherapy drugs cost less than targeted therapy. The mainstream cytotoxic chemotherapy drugs include fluoropyrimidine derivatives, oxaliplatin and irinotecan.4 5 There were seven fluoropyrimidine derivatives marketed in China during the study period, all of which had CRC indications. However, only fluorouracil (5-FU) and capecitabine are recommended by the guidelines.6–8 Trends in the use of fluoropyrimidine derivatives in CRC are noteworthy in the context of different indications and guideline recommendations. CRC chemotherapy regimens usually consist of one to three cytotoxic drugs. Monotherapy is usually used in patients who cannot tolerate combination therapy. Standard CRC combination chemotherapy regimens include folinic acid (LV)/5-FU/OX (FOLFOX), LV/5-FU/irinotecan, capecitabine/oxaliplatin, LV/5-FU/oxaliplatin/irinotecan, oxaliplatin/irinotecan (IROX).
Since 2004, a variety of antineoplastic drugs for the targeted treatment of CRC have been available overseas.9 Two years later, cetuximab became available in China as the first CRC-targeted drug approved by China National Medical Products Administration. With better efficacy and safety, the role of target therapy has become increasingly prominent for advanced or metastatic CRC (mCRC).10 Targeted agents can be used as a monotherapy, or in combination with chemotherapy or other targeted agents. The introduction of targeted therapies has also introduced additional testing costs to identify patients who will benefit from these targeted therapies.11 12 Currently, determination of tumour gene status for V-KI-RAS2 Kirsten rat sarcoma viral oncogene homolog (KRAS)/Neuroblastoma RAS viral oncogene homolog (NRAS) and B-Raf serine-threonine kinase mutations as well as human epidermal growth factor receptor 2 amplification and microsatellite instability (MSI)/ the DNA mismatch repair (MMR) status is recommended for patients with mCRC. Targeted drugs for CRC are mainly composed of monoclonal antibodies and protein kinase inhibitors (PKIs). Currently recommended monoclonal antibodies for CRC include cetuximab, bevacizumab and immune checkpoint inhibitors (ICIs) in China.8 Up to 40% of patients with CRC have RAS mutations.13 Patient with RAS mutation should not be treated with cetuximab. Bevacizumab has no genetic limitations.
The immune system substantially impacts CRC progression, which plays a crucial role in eliminating tumour cells. MSI-H incidence in Chinese patients with CRC is about 4.5%–15%.14 Patients with CRC with MSI-H responded well to ICIs treatment regardless of monotherapy or combination therapy, palliative, adjuvant or neoadjuvant therapy.15–19 ICIs work by blocking checkpoint proteins from binding with their partner proteins. Three ICIs have been approved by the Food and Drug Administration for patients with mCRC with MMR-D or MSI-H. Pembrolizumab and nivolumab work by inhibiting the immune checkpoint component programmed cell death-1 protein (PD-1). Ipilimumab, a fully humanised monoclonal antibody, blocks cytotoxic T-lymphocyte-associated protein 4.20 However, affected by marketing policies and other factors, some CRC therapeutic drugs (such as panitumumab, ipilimumab, aflibercept, ramucirumab, etc) have not been listed in China. Similarly, some CRC treatment drugs that have been marketed in China (such as fruquintinib, etc) have not yet been marketed in other countries.
Many factors affect the prescribing patterns of antineoplastic agents for CRC, such as the location of the primary tumour, the results of genetic testing, availability of medicines, adverse reactions, insurance coverage and patient socioeconomic status.5 21–24 Among these factors, economic factors are particularly influential in China. For example, British economic analysis showed that the incremental cost-effectiveness ratio (ICER) of some clinical study populations with cetuximab plus FOLFOX was ¥2.07 million per quality-adjusted life year (QALY) in relation to chemotherapy alone in 2015/2016.25 Treatment with cetuximab plus FOLFOX-4 resulted in an ICER of ¥0.84 million to ¥1.08 million per QALY according to different cost-effectiveness study used data of TAILOR trial (ClinicalTrails. gov identifier: NCT01228734) in China in 2018.26 27Although the ICER of cetuximab in China is lower than in the UK, the imbalance of regional economic level makes the willingness to pay (WTP) the cost gap larger. The commonly used WTP threshold per QALY in the UK is ¥0.49 million, and the commonly used WTP in China is about ¥0.18 million. An exchange rate of Chinese Yuan Renminbi to English pound (9.7:1, 31 December 2015) and US dollar (6.6:1, 30 June 2018) was used.
China’s basic medical insurance is mainly government medical insurance. There are two independently managed projects, namely ‘urban employee insurance’ and ‘resident insurance’. According to China’s Sixth National Survey on Health Services by the National Statistics Bureau, the government insurance coverage rate reached 96.8% in 2018. The participation rate of urban and rural residents in basic medical insurance was 96.1% and 97.6%, respectively.28 29 Within insurance coverage, the reimbursement rate varies from 35% to 90%, depending on the type of insurance, the regional disparity and hospital status. However, the targeted anticancer drugs were not included in the national medical insurance catalogue until bevacizumab in July 2017, followed by cetuximab and regorafenib in the second half of 2018.
The high price of targeted antineoplastic drugs and the lack of national health insurance coverage might severely affect the use of new drugs in patients with CRC. There were some reports on patients with cancer in China.30–33 However, real-world trends in antineoplastic drug use in Chinese patients with CRC have not been fully assessed yet. Besides, the significant price reduction and inclusion of three classic CRC-targeted drugs (cetuximab, bevacizumab and regorafenib) in national health insurance following national negotiations might significantly affect the use of these drugs in patients with CRC. This study used a large clinical prescription database to explore changes in patterns of antineoplastic drug prescriptions and related expenditures of patients with CRC in China from 2015 to 2019.
Methods
Study design and data source
This study was a retrospective study based on national multicentre prescription information collected from the Hospital Prescription Analysis Cooperative Project (HPACP). The HPACP database has been established since 1997,34 and all participating hospitals were collected prescriptions normally during the study period. Specific prescription information was extracted from the HPACP database, where 10-day prescription data were randomly extracted in each hospital each quarter.34 Multiple hospital admissions or visits by the same patient were recorded as independent data. In this study, prescription data were collected as described from 88 hospitals. Online supplemental table 1 provides the descriptive information for these 88 hospitals. All these cities are the most economically developed areas in the local area.
Supplemental material
Prescription inclusion and information collection
Prescriptions containing at least one antineoplastic agent for patients who had a diagnosis of bowel cancer were included. Inclusion criteria were unrestricted to diagnostic criteria and staging of CRC. The study period was from January 2015 to December 2019. Prescription information, including prescription code, sex, age, location, diagnosis, hospital status (inpatient or outpatient) and the generic name and price of the antineoplastic drugs, was extracted from the HPACP database. Prescriptions with incomplete information were removed. Prescription coding was used to deidentify patients’ information to protect patient identity. Prescription extraction was approved by the ethics committee at each hospital.
Drug classes
In order to understand the overall picture of antineoplastic drug treatment for patients with CRC in China, we had included all antineoplastic agents in the initial statistics. According to the WHO anatomical therapeutic chemical (ATC) classification system (https://www.whocc.no/atc_ddd_index/), antineoplastic drugs were divided into six classes. L01A-alkylating agents, which act by inhibiting the transcription of DNA into RNA and thereby stopping the protein synthesis (eg, cyclophosphamide).35 L01B-antimetabolites, which are structurally similar to require cellular metabolites, but the cells cannot use them in a productive manner (eg, 5-FU, capecitabine, raltitrexed).36 L01C-plant alkaloids and other natural products, which include vinca alkaloids and analogues, podophyllotoxin derivatives, taxanes, topoisomerase 1 inhibitors and other plant alkaloids and natural products (eg, paclitaxel). L01D-cytotoxic antibiotics and related substances include actinomycines, anthracyclines and other cytotoxic antibiotics (eg, doxorubicin). L01E-PKIs is a type of enzyme inhibitor that can block the action of protein kinases. According to different drug targets, the drugs in the L01E class are divided into eight subclasses. Regorafenib, fruquintinib and vemurafenib belong to different subclasses of L01E, respectively. L01X-other antineoplastic agents, including platinum compounds (e.g., oxaliplatin), monoclonal antibodies (e.g., cetuximab, bevacizumab) indicated for the treatment of cancer, and antineoplastic agents that cannot be classified into other classes. The specific drug classification is shown in online supplemental table 2.
Supplemental material
In the analysis process, the first step was to analyse the prescriptions of each class of antineoplastic agents according to the ATC classification. In the second step, we further analysed the subclasses contained in the three antineoplastic drug categories (L01B-antimetabolites, L01E-PKIs and L01X-other antineoplastic agents) with the most prescriptions in the first step. Finally, we estimated the use of specific drugs in the most used drug subclasses and recommended by guidelines. We extracted the price of each antineoplastic drug on each prescription from the HPACP database. The drug cost was calculated by adding the price of all analysed drugs in the Chinese Yuan. Drug expenditure was just costs as reported during each year.
Statistical analyses
Treatment visits and the cost of antineoplastic agents for patients with CRC were analysed. A visit was defined as one prescription containing antineoplastic agents, regardless of inpatient or outpatient status. The per cent of visits (PV) was the proportion of a specific class, subclass or drug prescriptions in the total number of antineoplastic drug prescriptions. The drug cost was the sum of all the antineoplastic drugs. The average cost per visit was calculated by the cost of total antineoplastic agents divided by the total visit number of patients. Overall trends in each class and the use of some specific antineoplastic agents were evaluated over the 5-year observation period. Monotherapy and combination therapy were analysed as prescribing patterns.
Since the antineoplastic drug treatment of patients with CRC is less affected by seasonal factors, and China’s drug policy is usually adjusted annually, trends were analysed at the annual level. The Mann-Kendall test was used to estimate the statistical significance of overall trends for the number and expenditure of total prescriptions.37 The statistical significance of prescribing trends of antineoplastic drugs and drug classes was analysed using the Cochran-Armitage trend test R V.3.3.0 (http://www.R-project.org).38 Statistical significance was identified as a p value less than 0.05.
Patient and public involvement
The study design was a secondary data analysis and did not directly involve patients or the public.
Results
Descriptive statistics of total prescriptions
A total of 129 098 antineoplastic prescriptions for patients with CRC were extracted. However, 287 prescriptions with incomplete information were excluded. The remaining 128 811 of these were collected in this study. The demographic characteristics of the included patients for the prescriptions are shown in table 1. Prescriptions for male patients with CRC made up 62.2% of the sample for 5 years. The population with bowel cancer aged below 40 and over 79 years was small, with a total of approximately 10% each year. Among them, the number of prescriptions for patients in the 50–89 age group had increased significantly (z=2.2045, p=0.027). The proportion of male patients’ prescriptions was on the rise, increasing from 61.20% to 63.45% (z=2.2045, p=0.027), the annual per cent change (APC) was 0.56% (95% CI 0.14 to 1.00). These trends are similar to the previously reported increase in the incidence of CRC in men than in women in recent years.2
The population demographic characteristics of included prescriptions from 2015 to 2019
Overall trends in antineoplastic drugs and cost
The overall trend in antineoplastic drug prescriptions was determined by clinic visits and cost data, as indicated in figure 1A. For the antineoplastic drugs included in the present study, the yearly visits for patients with bowel cancer in sample hospitals increased by 80.4% (from ¥18 966 in 2015 to ¥34 219 in 2019, p<0.05). During the same period, the annual expenditure of antineoplastic drugs increased by 117.2% (from ¥58.7 million in 2015 to ¥127.4 million in 2019, p<0.05), as shown in figure 1B. The average cost of antineoplastic drugs per visit for patients with CRC was also calculated. Although it ranged from ¥3 095 to ¥3 723 in 5 years, the difference was non-significant (p=0.22).

Total visits and cost trends of anti-tumour drugs for colorectal cancer patients from 2015 to 2019. (A) Total visits; (B) total and average drug cost.
Trends by drug subclass in the most widely used antineoplastic agent classes
According to WHO ATC classification, a total of 6 classes, 26 subclasses and 79 antineoplastic drugs were included. Further analysis was conducted according to the WHO ATC classification of drugs for antineoplastic prescriptions. A list of drugs is shown in online supplemental table 2. Online supplemental figure 1A shows the annual trends in each class of antineoplastic drug during the study period. We further analysed the drug class L01B-antimetabolites, L01X-other antineoplastic agents and L01E-PKIs.
Supplemental material
The PV for antimetabolites was 82.6% in 2015, then gradually decreased to 79.5% in 2019 (Z=−11.479, p<0.05, APC 0.8%, 95% CI −4.78 to 4.46). Figure 2A shows trends in the PV and expenditures for the three subclasses of antimetabolites. Pyrimidine analogues were the top subclass of antimetabolites; the PV was only slightly less than that for antimetabolites, and it decreased during the 5-year period (Z=−15.461, p<0.05, APC −1.2%, 95% CI −4.6 to 4.1). The antimetabolites, which cost ¥148.7 million over a total 5 years, ranked second in all six classes of antineoplastic drugs. The cost of pyrimidine analogues increased from ¥24.6 million in 2015 to ¥32.4 million in 2019. The PV of folic acid analogues was 0.9% in 2015, increasing to 2.4% in 2019 (Z=12.551, p<0.05, APC 0.4%, 95% CI −0.2 to 0.9), with a cost from ¥0.69 million in 2015 to ¥2.49 million in 2019.

Prescriptions trends and drug cost of subclasses for antimetabolites and other antineoplastic agents (L01X). (A) Antimetabolites; (B) other antineoplastic agents (L01X); (C) protein kinase inhibitors. BRAF, B-Raf serine-threonine kinase; HER2, human epidermal growth factor receptor 2; PKIs, protein kinase inhibitors; PV, per cent of visits; TKIs, tyrosine kinase inhibitors; VEGFR, vascular endothelial growth factor receptor.
The PV of other antineoplastic agents (L01X) increased relatively fast, ranging from 35.3% to 48.2% in the space of 5 years (Z=26.932, p<0.05, APC 3.3%, 95% CI 1.32 to 6.48). The drug expenditure for L01X also increased. For 2015–2019, ¥264.7 million was spent on this drug class, making it the highest in the total (online supplemental figure 1B) and average prescription costs (online supplemental figure 1C). L01X mainly consists of three subclasses in this study, as shown in online supplemental table 2. The trends in use and cost of this class of drugs are shown in figure 2B. Among these subclasses, platinum compounds were the most widely used. The PV for platinum compounds was 26.2% in 2015 and gradually increased to approximately 29.5% in 2019 (Z=8.654, p<0.05, APC 0.8%, 95% CI −1.32 to 3.55), and the cost increased from ¥12.3 million in 2015 to ¥26.5 million in 2019. The PV of monoclonal antibodies increased almost fourfold over 5 years (Z=48.214, p<0.05, APC 3.3%, 95% CI 0.23 to 7.87), with the annual drug cost ranging from ¥14.5 million to ¥44.1 million. The PV for the subclass of other antineoplastic agents (ATC code name L01XX) was 7.8% in 2015 and gradually rose to 12.6% in 2019 (Z=16.132, p<0.05, APC 1.2%, 95% CI 0.33 to 2.47). The cost grew from ¥6.0 million in 2015 to ¥15.0 million in 2019.
PKIs were used in 0.1% visits in 2015, which increased to 2.5% in 2019 (Z=21.164, p<0.05, APC 0.6%, 95% CI −0.02 to 1.78). The drug expenditure of PKIs was ¥8.6 million during the study period (figure 2C). This study collected nine subclasses of PKIs. Among them, multitarget PKIs and vascular endothelial growth factor receptor tyrosine kinase inhibitors are the most commonly used, the PV of which increased by more than 300 (Z=22.391, p<0.05, APC 0.4%, 95% CI 0.0017 to 1.6404) and 50 times (Z=5.152, p<0.05, APC 0.1%, 95% CI 0.0045 to 0.1371), respectively. The cost of multitarget PKIs was ¥24 267 in 2015 and increased to ¥5.0 million in 2019. Other subclasses of PKIs were mainly used for other cancer with multiple primary tumours.
Because patients with CRC may receive multiple drug combinations of antitumor therapy, the sum of PV of different class drugs may exceed 100%, which may also be the case for drug subclass analysis and specific drug analysis.
Trends in specific drugs in the most widely used drug classes
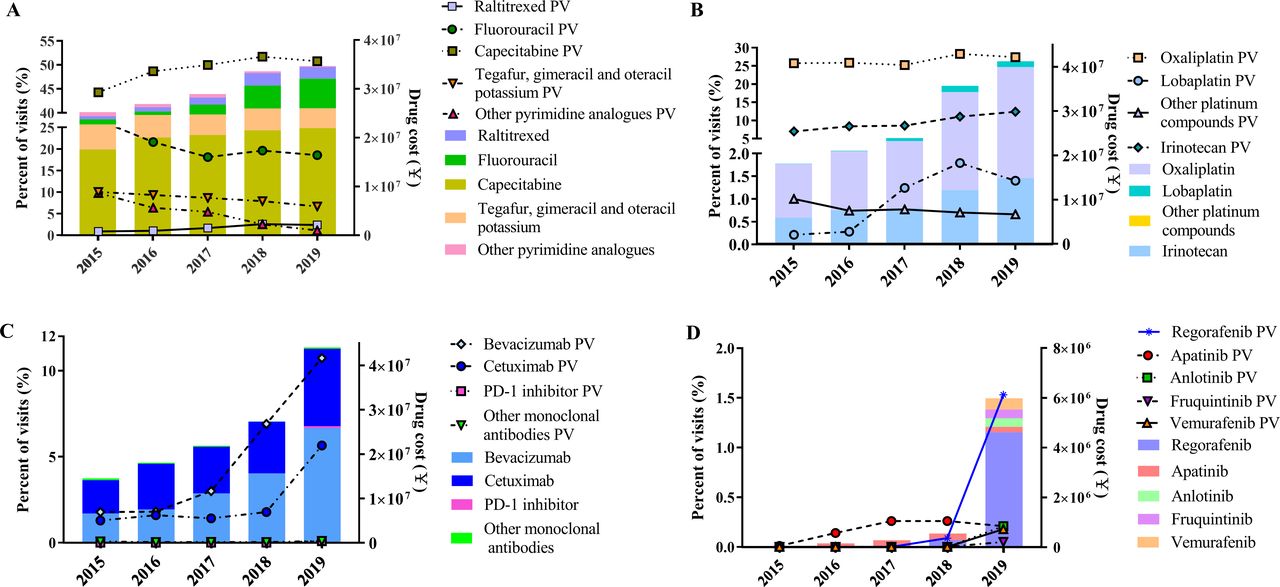
The prescribing trends for specific drugs in antimetabolites, L01X and PKIs were analysed. Eight fluoropyrimidine drugs were found in our study. The results shown in figure 3A indicated that capecitabine, fluorouracil (5-FU) and the compound fluorouracil derivatives tegafur, gimeracil and oteracil potassium were the top three most frequently prescribed antimetabolite drugs, representing 49.1%, 20.6% and 8.5% of the 5-year average PV, respectively. The APC in PV of these three drugs was 1.6% (Z=11.13, p<0.05, 95% CI −0.92 to 4.38), −1.6% (Z=−12.974, p<0.05, 95% CI −3.49 to 1.50) and −0.8% (Z=−11.13, p<0.05, 95% CI −1.21 to −0.67), respectively. The annual cost of these three drugs was ¥17.6 million, ¥1.1 million and ¥5.2 million in 2015, respectively, and ¥22.0 million, ¥6.1 million and ¥4.1 million in 2019, respectively. The sum of the PV values for the other five 5-FU analogues (fluorouracil deoxynucleoside, doxifluridine, tegafur, carmofur and uracil tegafur) declined from 9.8% in 2015 to 1.1% in 2019 (Z=−38.835, p<0.05, APC −2.16%, 95% CI −3.43 to −0.91).

Trends in visits and drug cost of specific drugs of antineoplastic drugs from 2015 to 2019. (A) Trends of raltitrexed and pyrimidine analogues; (B) trends of irinotecan and platinum compounds; (C) trends of monoclonal antibodies; (D) trends of protein kinase inhibitors. PD, programmed cell death; PV, per cent of visits.
As shown in figure 3B, oxaliplatin was the most commonly used platinum compound in our study. From 2015 to 2017, the PV for oxaliplatin was approximately 25%, which slightly increased to approximately 28% in 2018–2019 (Z=5.183, p<0.05, APC 0.4%, 95% CI −0.91 to 3.08). The PV of lobaplatin in patients with CRC was 0.2% in 2015, and it ranged between 1.2% and 1.8% since 2017 (Z=13.441, p<0.05, APC 0.3%, 95% CI −0.39 to 0.96). The PV ratio of oxaliplatin to irinotecan was 3.7 in 2015. With the increase in the use of irinotecan (Z=17.771, p<0.05, APC 1.4%, 95% CI 0.18 to 2.51), that ratio gradually decreased to 2.2 in 2019. The PV of the combined use of oxaliplatin and irinotecan also grew from 0.1% in 2015 to 1.2% in 2019.
Bevacizumab and cetuximab were the most prescribed monoclonal antibodies, as shown in figure 3C. In 2015, bevacizumab and cetuximab were used in 1.8% and 1.3% of visits, accounting for 11.3% and 12.8% of antineoplastic drug costs, respectively. In 2019, the PV for these two drugs increased to 10.7% and 5.7%, accounting for 20.3% and 13.7% of the total antineoplastic drug cost, respectively. ICIs were not used in patients with bowel cancer until 2019 in our study. In 2019, three PD-1 inhibitors were used in 0.1% of visits. The total cost for PD-1 inhibitors was ¥0.4 million in 2019, accounting for 0.1% of the annual antineoplastic drug expenditure.
Compared with 2015, the cost of PKIs in 2019 had increased by 33 times (figure 3D). The use of PKIs increased rapidly as well (Z=21.164, p<0.05). Regorafenib was the most widely used PKI, contributing nearly 61.2% of all PKIs prescribed in 2019.
Trends in prescribing patterns
Drugs with different pharmacologies are used in combination for CRC treatment. Trends in prescribing patterns for monotherapy, dual combination, triple combination and quadruple or more combination are shown in online supplemental figure 2. The percentage of monotherapy decreased from 73.4% in 2015 to 66.7% in 2019 (Z=−17.403, p<0.05, APC −1.7%, 95% CI −7.23 to 1.46). Percentage of dual combinations ranged from 23.0% in 2015 to 27.2% in 2019 (Z=2.98, p<0.05, APC 0.1%, 95% CI −1.84 to 4.20). Percentage of the three drug regimens was 1.4% in 2015 and increased significantly to 7.3% in 2019 (Z=32.476, p<0.05, APC 1.5%, 95% CI 0.17 to 2.89). Combinations of four or more drugs increased from 0.1% in 2015 to 0.5% in 2019 (Z=9.056, p<0.05, APC 0.1%, 95% CI 0.02 to 0.30).
Supplemental material
Discussion
In this study, real-world trends in the prescription patterns of antineoplastic drugs for patients with CRC in China are described herein for the first time. During the study period, the number of antineoplastic drug prescriptions showed an increasing trend, which may be related to the rising number of patients with CRC and the growing number of admissions/clinical visits per patient.1 3 At the same time, the total amount of antitumor drug prescriptions increased significantly.
The total amount of medications spent in 2019 was 2.17 times that of 2015. The annual average prescription amount changed slightly. Compared with 2015, the single prescription amount only increased by 20%, and there was no statistical difference in p for trend. In terms of drug use, the proportion of cytotoxic drugs was in line with the guidelines. The treatment regimens are mainly composed based on fluorouracil or its derivatives and substitutes, combined with oxaliplatin or irinotecan, or IROX. The proportion of drug prescriptions of fluorouracils was higher than oxaliplatin and higher than irinotecan. Cytotoxic antitumor drugs without CRC indication accounted for less than 1% and were mainly used to treat other diseases. Compared with high-income countries, more than 70% of patients received biologics at any line of treatment,39 40 our study showed that the use of targeted drugs may be significantly lower.
The increase in spending on antineoplastic drugs may be related to several factors, such as patient or drug factors, and they can affect each other. Consistent with previous epidemiological results,1 the proportion of prescriptions for male patients in our study continues to rise slightly. The higher male proportion may lead to changes in mean weight or BSA, which will probably result in higher costs for weight or BSA-based therapies.
Our study shows that the proportion of targeted drugs in antitumor drug prescriptions increases (PV of monoclonal antibodies increased from 3.2% in 2015 to 16.6% in 2019). The drug price of target medications is significantly higher than that of cytotoxic drugs. The use of costly target agents increases the average drug expense per prescription. But the impact of increased costs from targeted drugs is not constant. As drug prices continue to fall, the average annual prescription cost of cetuximab decreased gradually from ¥30 768 in 2015 to ¥21 689 in 2018 and significantly declined to ¥9 020 in 2019. On the other hand, the cost per visit of PKIs dropped in 2017 after national negotiations in 2016, but it increased again in 2018 and 2019 as the use of non-negotiated drugs such as regorafenib, anlotinib and vemurafenib increased. Therefore, to accurately evaluate the overall impact of high-priced drugs on drug costs, a comprehensive calculation should be made based on total drug costs, the number of prescriptions and the amount of single drug use.
In addition, in our study, the proportion of prescriptions of a single drug regimen decreased significantly, and the remedies of three drugs increased significantly, suggesting that the change of medication pattern may have an impact on drug consumption. In particular, according to the guidelines,6–8 the three-drug regimen is mostly a combination of chemotherapy and targeted drugs and, thus, may significantly increase drug costs. However, the specific composition remains to be confirmed by further studies.
There are several limitations of this study. First, detailed prescription information, such as the disease stage of CRC, surgical history, pathological results and genetic test results, was lacking. Our analysis was based on prescription data only; therefore, the appropriateness of the antineoplastic drug treatment could not be evaluated, nor could the outcome of anticancer therapy. Our prescription data do not involve the patient’s individual identification information, it is impossible to analyse and evaluate the drug on a patient basis. This topic requires further research. Since the included hospitals are located in large cities and prescriptions are obtained through random sampling, prescriptions in different regions may fluctuate from year to year. There might be bias in sampling. Our sample hospitals are from large cities in some Chinese provinces, it may only represent the prescriptions of some Chinese patients with CRC and may be less representative of the economically less developed and rural areas. Moreover, the overall disease burden in patients with bowel cancer, not just the burden of medication, should be further explored in the future.
Conclusions
In our research, we found that prescription practices for Chinese patients with CRC underwent major changes during the 5-year study period. The use rate of targeted antineoplastic drugs increased significantly after the drug price was reduced. Therefore, as the high cost of cancer drug treatment put pressure on the healthcare system and patients, pharmacoeconomic research is needed to evaluate the cost-effectiveness of CRC antineoplastic drugs.
Data availability statement
Data are available upon reasonable request. Data are available from the Second Affiliated Hospital of Zhejiang University Data Access/Ethics Committee for researchers who meet the criteria for access to confidential data. I may be contacted for all interested readers to request the data.
Ethics statements
Patient consent for publication
Ethics approval
All procedures performed in studies involving human participants were in accordance with the ethical standards of medical ethics committee of the Second Affiliated Hospital of Zhejiang University School of Medicine.
References
Supplementary materials
Supplementary Data
This web only file has been produced by the BMJ Publishing Group from an electronic file supplied by the author(s) and has not been edited for content.
Footnotes
Contributors DY, LY and HD conceptualised and designed the study. WH screened and completed data extractions. YH and LY contributed to analysis of the data. DY, YY and HX conducted the final analysis and drafted the initial manuscript. Guarantor: HD. All authors contributed to the critical revision of the paper and approved the final manuscript.
Funding HX was awarded one grant from the National Natural Science Foundation of China (grant number: 81703479). The funder had no role in study design, data collection and analysis, decision to publish, or preparation of the manuscript.
Competing interests None declared.
Provenance and peer review Not commissioned; externally peer reviewed.
Supplemental material This content has been supplied by the author(s). It has not been vetted by BMJ Publishing Group Limited (BMJ) and may not have been peer-reviewed. Any opinions or recommendations discussed are solely those of the author(s) and are not endorsed by BMJ. BMJ disclaims all liability and responsibility arising from any reliance placed on the content. Where the content includes any translated material, BMJ does not warrant the accuracy and reliability of the translations (including but not limited to local regulations, clinical guidelines, terminology, drug names and drug dosages), and is not responsible for any error and/or omissions arising from translation and adaptation or otherwise.