Article Text

Abstract
Objective To characterise the environmental presence of hepatitis A virus (HAV) in low- and middle-income countries (LMICs).
Design Systematic review and meta-analysis.
Data sources EBSCOhost, PubMed, Scopus, ScienceDirect, Clinical Key and Web of Science were searched. Grey literature was sourced by searching the following electronic databases: Open Grey, National Health Research Database and Mednar.
Eligibility criteria for including studies Cross-sectional and ecological studies reporting HAV environmental presence and conducted in LMICs between January 2005 and May 2019, irrespective of language of publication.
Data extraction and data synthesis Relevant data were extracted from articles meeting the inclusion criteria, and two reviewers independently assessed the studies for risk of bias. High heterogeneity of the extracted data led to the results being reported narratively.
Results A total of 2092 records were retrieved, of which 33 met the inclusion criteria. 21 studies were conducted in Tunisia, India and South Africa, and the rest were from Philippines, Pakistan, Morocco, Chad, Mozambique, Kenya and Uganda. In Tunisian raw sewage samples, the prevalence of HAV ranged from 12% to 68%, with an estimated average detection rate of 50% (95% CI 25 to 75), whereas HAV detection in treated sewage in Tunisia ranged from 23% to 65%, with an estimated average detection rate of 38% (95% CI 20 to 57). The prevalence of HAV detection in South African treated sewage and surface water samples ranged from 4% to 37% and from 16% to 76%, with an estimated average detection rates of 15% (95% CI 1 to 29) and 51% (95% CI 21 to 80), respectively. Over the review period, the estimated average detection rate of environmental HAV presence appeared to have declined by 10%.
Conclusion The quality of included studies was fair, but sampling issues and paucity of data limited the strength of the review findings.
PROSPERO registration number CRD42019119592.
- epidemiology
- virology
- public health
This is an open access article distributed in accordance with the Creative Commons Attribution Non Commercial (CC BY-NC 4.0) license, which permits others to distribute, remix, adapt, build upon this work non-commercially, and license their derivative works on different terms, provided the original work is properly cited, appropriate credit is given, any changes made indicated, and the use is non-commercial. See: http://creativecommons.org/licenses/by-nc/4.0/.
Statistics from Altmetric.com
Strengths and limitations of this study
A comprehensive literature search from multiple databases was conducted.
There were no language restrictions during the literature search.
Eligible non-English language articles were translated and screened for inclusion.
Limited number of studies met the inclusion criteria.
Meta-analysis for important study outcomes was not possible due to high heterogeneity.
Background
Hepatitis A is caused by the hepatitis A virus (HAV), a small non-enveloped, single-stranded RNA virus belonging to the Picornaviridae family.1 It is estimated that approximately 1.5 million cases of hepatitis A occur annually, which is likely an underestimate due to the under-reporting of asymptomatic HAV infections.2 The transmission of HAV occurs mainly through the faecal-oral route via contact with an infectious person and/or through ingestion of contaminated food or water.3 Foods that are most commonly linked with HAV infection include unpeeled, uncooked produce and raw shellfish.4 The incidence of HAV infection is influenced by socioeconomic status (SES), as the risk of transmission is increased in areas with poor water quality, sanitation and hygiene.5 Hepatitis A disease in humans can be caused by three genotypes of HAV, genotypes I, II and III, which can be further classified into subgenotypes A and B.3 6 Globally, HAV genotype I is the most commonly reported.1
The environmental presence of HAV is considered to be a driver in the force of HAV infection in a population. Thus, the characterisation of HAV environmental presence is crucial to understanding the epidemiology of the disease. The virus can be detected in environmental sources using qualitative or quantitative (real-time (RT)-PCR) molecular methods as well as nucleic acid sequence-based amplification techniques.7 In settings where water quality, sanitation and hygiene are poor, the environmental presence of HAV is assumed to be high, leading to high endemicity of hepatitis A in these areas.8 Given the risk factors for HAV infection, global reports indicate that increases in SES lead to a reduction in HAV transmission in the relevant populations and that these changes should be accompanied by the reassessment of public health strategies used to control hepatitis A.4 5
Rationale
The WHO recommends routine immunisation against HAV in countries with intermediate HAV endemicity, that is, in settings presumed to have a mix of HAV environmental exposure levels. The WHO recommends that countries routinely collect and review essential information to estimate national burdens of hepatitis A (including disease transmission rates, clinical outcomes, cost of cases and so on) to inform the need for routine immunisation against the disease. In collecting information on the burden of hepatitis A, information on the environmental presence of HAV should be considered as it is a driver of hepatitis A epidemiology. Such synthesised information is largely missing in the field, and this review was conducted to add to the body of knowledge used to inform hepatitis A control strategies.
Methods
This systematic review was registered with PROSPERO (International Prospective Register of Systematic Reviews), and the results are reported using the Preferred Reporting Items for Systematic Reviews and Meta-analyses (PRISMA) guidelines9 (see online supplemental appendix 1).
Supplemental material
Objective
The objective was to characterise the environmental presence of HAV in low- and middle-income countries (LMICs).
Primary objective
To quantify the environmental presence of HAV in LMICs.
Secondary objectives
To describe the seasonal variation of the environmental presence of HAV in LMICs.
To describe the genotypes of HAV circulating in LMICs.
Study eligibility criteria
Cross-sectional and ecological studies conducted in LMICs between January 2005 and May 2019, irrespective of language, were eligible for inclusion in this review. The inclusion start date of January 2005 was guided by the latest global review period of HAV endemicity used by the WHO to classify countries’ HAV endemicity status.5 Eligible studies reported quantifiable concentrations of HAV in different environments, including raw sewage, treated sewage, sludge, surface water, groundwater, drinking water, ocean water, irrigation water, soil, crops, food and/or shellfish.
Patient and public involvement
Patients or the general public were not involved in the design, planning and conduct of this study.
Search strategy
A comprehensive search strategy that included text words (all fields) and medical subject headings was used to search for eligible studies. The search strategy terms included hepatitis A virus, environmental presence and LMICs. The following electronic databases were searched for relevant published studies: EBSCOhost, PubMed, Scopus, ScienceDirect, Clinical Key and Web of Knowledge (Web of Science). Grey literature was sourced by searching the following electronic databases: Open Grey, National Health Research Database and Mednar.
An example of the search strategy applied to PubMed database is outlined in online supplemental appendix 2. This search strategy was adapted for use in the other databases with the relevant filters used to identify studies published between January 2005 and May 2019. The last literature search from all the databases was completed on 15 May 2019.
Study selection
All database search outputs were imported to Rayyan software for blinded screening.10 The first author (PK) and the second author (JP) independently screened 100% of titles and abstracts. Titles and abstracts of non-English outputs were translated into English using Google Translate.11 Full-text articles of eligible studies were collected and independently screened by PK and JP. Where disagreements occurred regarding the inclusion, consensus was reached through consultation with the last author (BMK). The PRISMA diagram describing the study selection process is shown in figure 1.

PRISMA flow diagram for selection of studies. The figure details the flow of identification and selection of studies included in the review. Application of the search terms to different databases (PubMed, EBSCOhost, Web of Science, ScienceDirect, Scopus, Mednar, Open Grey and Clinical Key) yielded 2092 records. After the removal of duplicates, there were 1827 unique records eligible for screening. Title and abstract screening excluded 1504 records for various reasons: wrong outcome type (1311), wrong publication type (97), wrong study design (15) wrong population/setting (63), duplicates (8) and published outside the target study period (10). 323 records were assessed for eligibility by full-text screening. The full-text screening excluded 290 records because they were either reporting wrong outcome type or did not report quantifiable HAV environmental prevalence. 33 articles met the inclusion criteria. HAV, hepatitis A virus; n, number of records retrieved; PRISMA, Preferred Reporting Items for Systematic Reviews and Meta-Analyses.
Data extraction
Study characteristics and outcomes of interest were extracted from included studies by PK and JP on a predesigned, electronic data extraction form using KoBo Toolbox12 (see online supplemental appendix 3). Prior to use of the data extraction form, the reliability of the extraction form was assessed by piloting 10 randomly selected articles that met the inclusion criteria. Any disagreements in data extraction were resolved through consultation and consensus with the last author.
Data management and analysis
Estimates of HAV environmental presence from different studies were pooled as weighted mean proportions by environmental source. Pooled estimates were calculated using the metaprop command, and a random effects model was fitted to the data after Freeman-Tukey double arcsine transformation to stabilise the variances.13 Inverse-variance weighting method was used in addition to the DerSimonian and Liard method to estimate the variance between studies during the pooling of proportions. Where heterogeneity between studies was found to be low (I2 ≤60), pooled outcome measures were reported with 95% CIs for each respective outcome.14 Where heterogeneity was found to be high (I2 ≤60), narrative reporting was used to describe the prevalence ranges for each respective outcome. All analyses were carried out using STATA V.15 software.15
Risk of bias assessment
Each included article was independently assessed for risk of bias by PK and JP using the Hoy et al16 tool (modified by Werfalli et al)17 (see online supplemental appendix 4). Using the checklist tool, a score of 0–5 points was categorised as ‘high risk’ of bias, 6–8 points as ‘moderate risk’ of bias and 9–10 points as ‘low risk’ of bias. Discrepancies in risk of bias assessments were resolved through consultation and consensus with BMK.
Results
Included studies
The database searches yielded 2092 records, from which 265 duplicates were removed (figure 1). A further 1504 records were excluded for failure to meet the inclusion criteria following the screening of titles and abstracts. Full texts of 323 records were screened, from which 33 studies met the final inclusion criteria.
Characteristics of included studies
The included 33 studies were conducted across 10 different LMICs. All the included studies were observational studies reporting environmental presence of HAV as either a primary or a secondary outcome. Twenty-two of the included studies were conducted in Africa, with Tunisia (nine studies) and South Africa (six studies) contributing to majority of studies from the region. The remaining 11 studies were conducted in Asia, with India (six studies) contributing to majority of the studies from this region.
Table 1 displays the characteristics of included studies and summary of study outcomes. All the included studies used RT-PCR methods for HAV detection, while the methods for environmental sample concentration among included studies differed (table 2). Detection of HAV in raw and treated sewage samples were the most frequently reported outcomes among the included studies.
Characteristics of included studies and summary of outcomes from individual studies
Summary of HAV detection and environmental samples concentration techniques used for each included study
HAV genotypes
Twelve (36%) of the included studies reported data on phylogenetic analysis and genotypic classifications of HAV strains detected in environmental samples. HAV genotypes I, III and V were identified as circulating in LMICs. HAV genotypes I and V were reported in Southern Africa, while HAV subgenotypes IIIA, IB and IA were reported in Asia, and HAV subgenotypes IA and IB were reported in Northern Africa (figure 2).

Distribution of reported HAV genotypes. The map shows the geographical distribution of different HAV genotypes reported to be circulating in 10 low-income and middle-income countries by studies included in this review. Countries marked with blue colour scheme had studies reporting HAV environmental presence but did not report the specific genotypes circulating. HAV, hepatitis A virus.
Environmental HAV detection
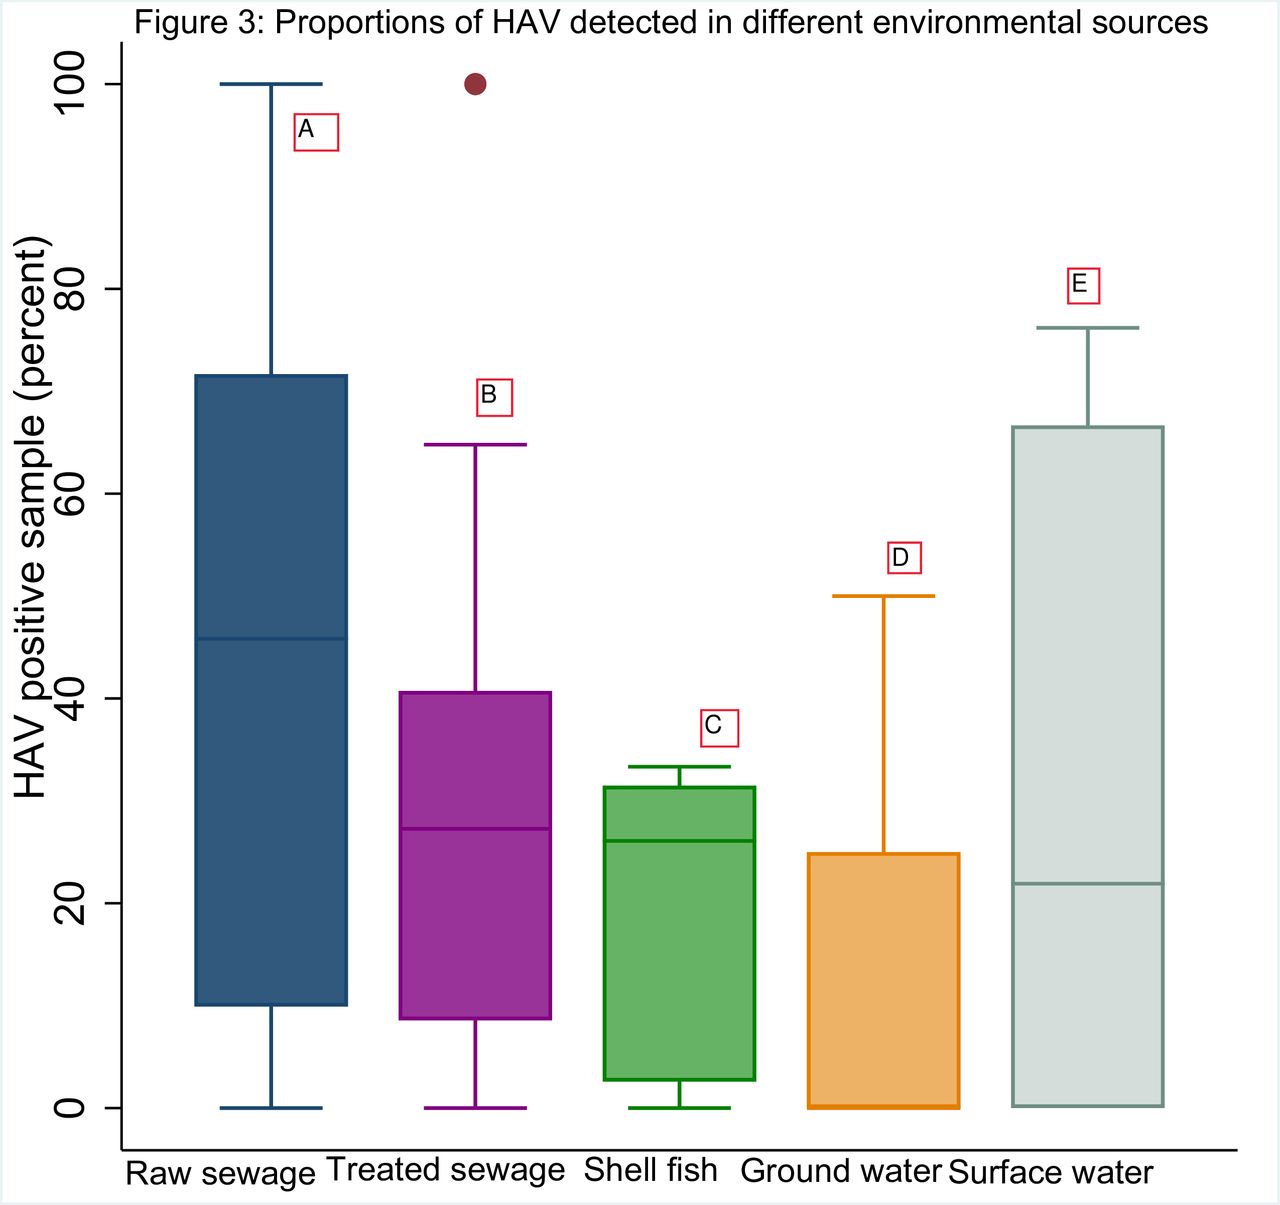
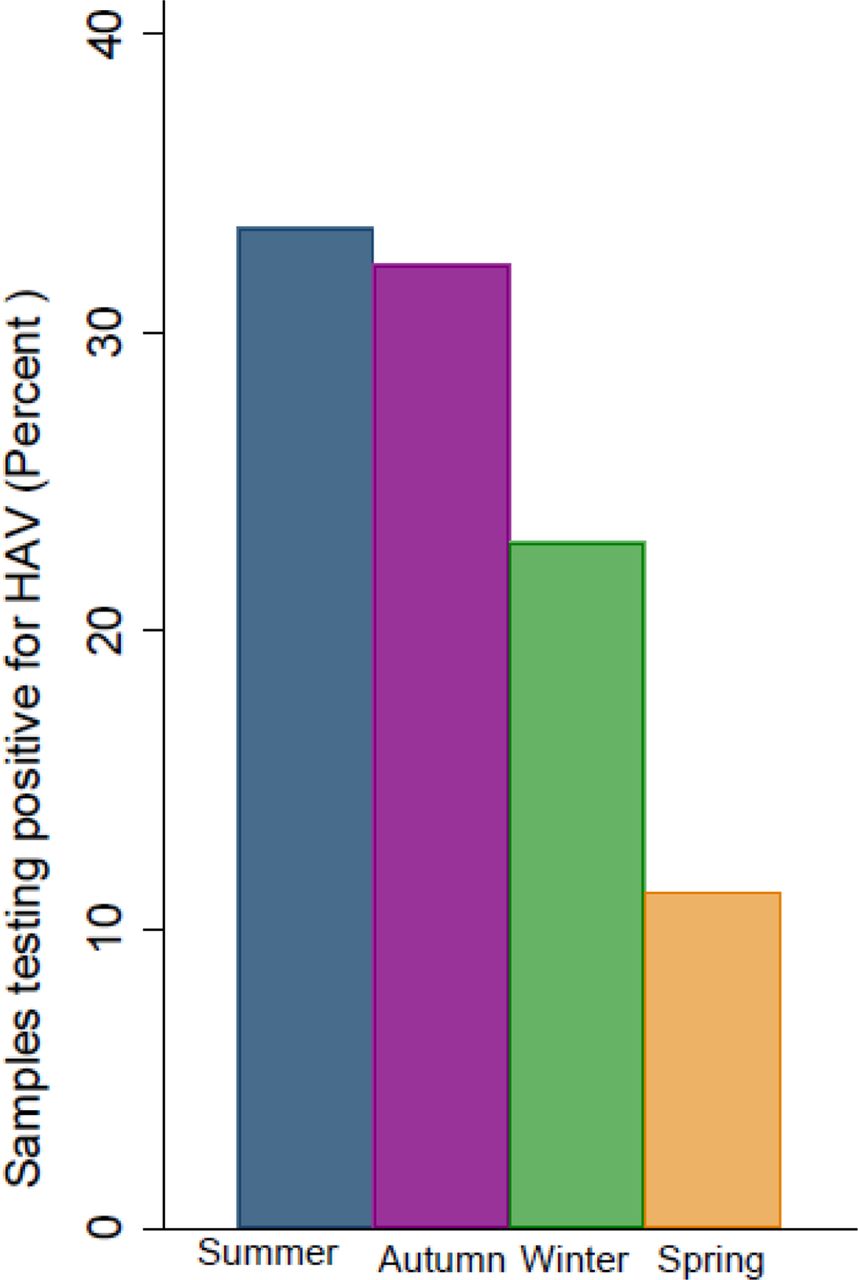
Due to high heterogeneity among included studies, the environmental presence of HAV could not be pooled and thus is narratively reported by type of environmental source (table 1). As displayed in table 1, the detection of HAV varied greatly among included studies. When taken together, the overall detection of HAV in LMICs was found to be highest in raw and treated sewage samples and lowest in shellfish and groundwater (figure 3). These studies also reported HAV detection to be most frequent in summer (34%) and autumn (32%) seasons, with some detection remaining constant in all seasons (figure 4). Over the review period of 2005–2019, the environmental presence of HAV appears to have declined from an estimated average detection rate of 30% (95% CI 12 to 52) to an estimated detection rate of 20% (95% CI 8 to 35) (figure 5).

Proportion of HAV-positive samples. Boxplot diagram showing the proportions of HAV-positive samples in different environmental samples. A: raw sewage N=784, n=305, median 47, range 0–100. B: treated sewage N=622, n=184, median 28, range 0–64. C: shellfish N=407, n=48, median 26, range, 0-33 D: groundwater N=22, n=5, median, range 0–50. E: surface water N=706, n=147, median 22, range 0–76. N, number of samples, n, number of samples testing positive for HAV. HAV, hepatitis A virus.

Average seasonal HAV detection in low-income and middle-income countries. Mean proportions of HAV-positive samples per season. Summer: n=7, 34% of samples testing positive for HAV; autumn: n=6, 33% of samples testing positive for HAV; winter: n=8, 23% of samples testing positive for HAV; spring: n=4, 10% of samples testing positive for HAV. n, number of articles reporting. HAV, hepatitis A virus.

Forest plot showing reported environmental presence of HAV in LMICs by year of data collection (2000–2017). The forest plot shows reported environmental presence of HAV in LMICs by year of data collection. Estimates for proportions of HAV-positive samples by subgroup of 5-year intervals are shown. The study-specific proportions and 95% CIs are denoted by black boxes and black lines. The combined proportion estimates for the subgroups (5-year intervals) and the overall estimate are represented by black diamonds, where diamond width corresponds to 95% CI bounds. Box and diamond heights are inversely proportional to precision of the proportion estimate. The p value for heterogeneity of the overall proportion estimate is shown. HAV, hepatitis A virus; LMICs, low-income and middle-income countries.
HAV environmental detection in Africa
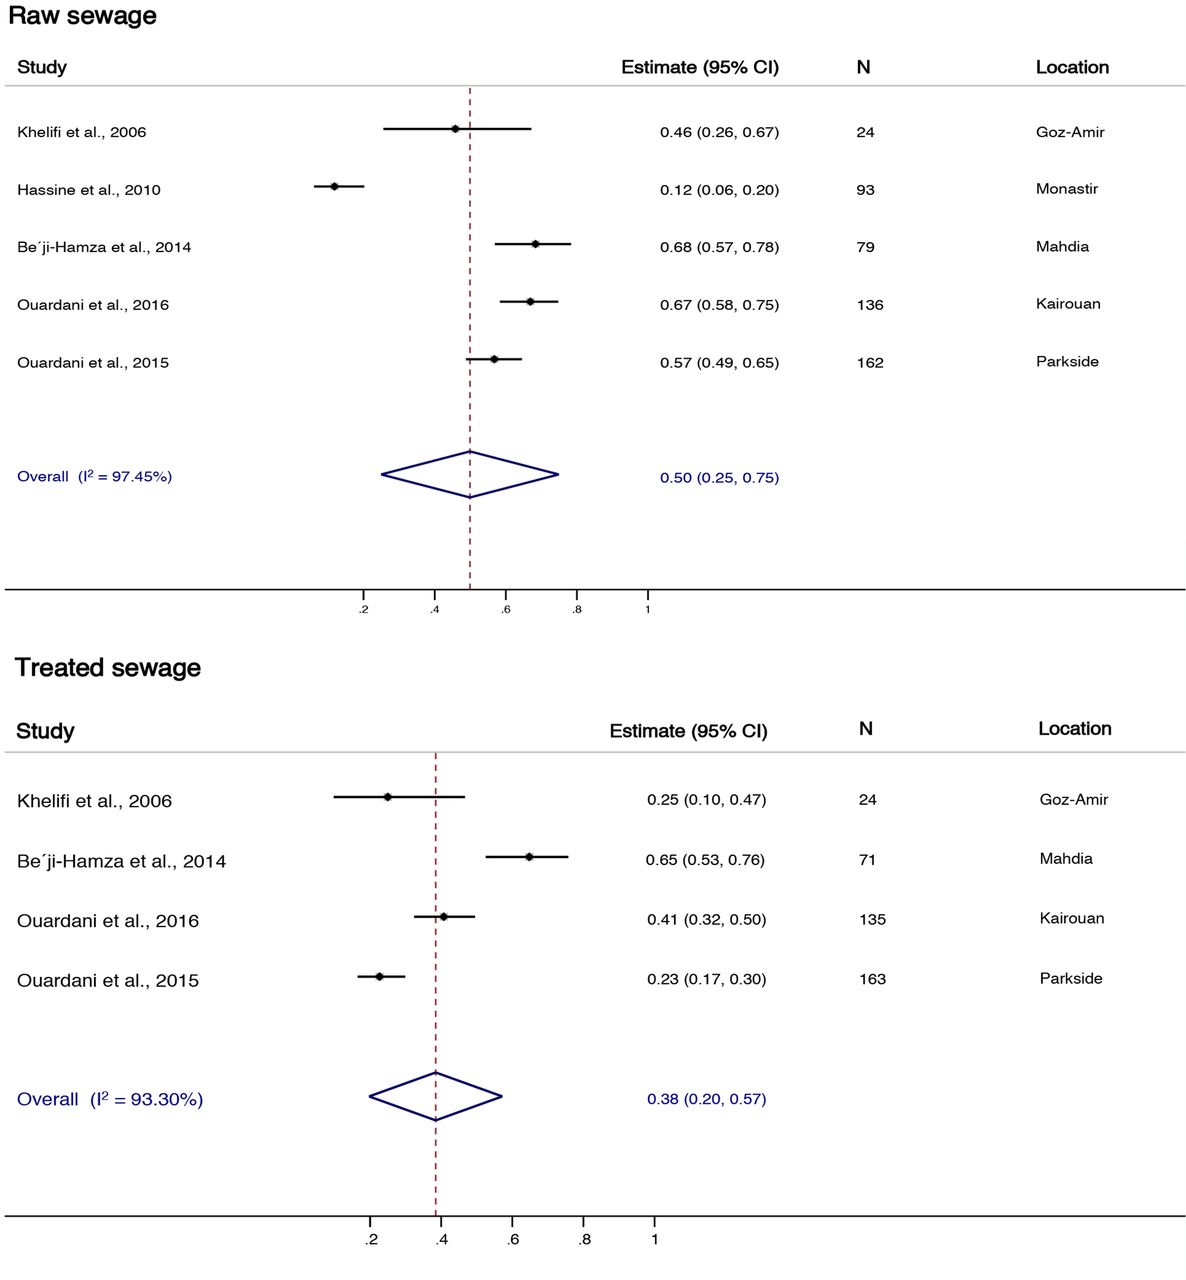
Given that 45% of included studies were conducted in Tunisia and South Africa, the review data presented a unique opportunity to analyse data for these two countries. Due to heterogeneity, however, these results are reported narratively. The prevalence of HAV detection in Tunisian raw sewage ranged from 12% to 68%, with an estimated average detection rate of 50% (95% CI 25 to 75) (figure 6). The prevalence of HAV detected in treated sewage in Tunisia ranged from 23% to 65%, with an estimated average detection rate of 38% (95% CI 20 to 57) (figure 6). The prevalence of HAV detection in South African treated sewage and surface water ranged from 4% to 37% and from 16% to 76%, with estimated average detection rates of 15% (95% CI 1 to 29) and 51% (95% CI 21 to 80), respectively (figure 7).

Proportion of HAV-positive samples from treated and raw sewage in Tunisia. The forest plot shows the presence of HAV in treated and raw sewage samples reported by studies from Tunisia. The estimate for proportions of HAV-positive samples for raw sewage was 50% (CI 25% to 75%) with heterogeneity of 97.45% (N=494), and the estimate for proportions of HAV-positive samples for treated sewage was 38% (20% to 57%) with heterogeneity of 93.3% (N=393). The study-specific proportions and 95% CIs are denoted by black boxes and black lines. The overall estimate is represented by the diamond, where diamond width corresponds to 95% CI bounds. Box and diamond heights are inversely proportional to precision of the proportion estimate. N, number of samples. HAV, hepatitis A virus.

Proportion of HAV-positive samples from surface water and treated sewage in South Africa. The forest plot shows the presence of HAV in surface water and treated sewage samples reported by studies from South Africa. The estimate for proportions of HAV-positive samples for surface water was 51% (CI 21% to 80%) with heterogeneity of 95.63% (N=412), and the estimate for proportions of HAV-positive samples for treated sewage was 15% (1% to 29%) with heterogeneity of 90.12% (N=169). The study-specific proportions and 95% CIs are denoted by black boxes and black lines. The overall estimate is represented by the diamond, where diamond width corresponds to 95% CI bounds. Box and diamond heights are inversely proportional to precision of the proportion estimate. HAV, hepatitis A virus; N, number of samples.
Risk of bias
Most of the included studies (28 of 33) were graded as having low risk of bias (see online supplementary appendix 5). Four studies were judged as having moderate risk of bias due to sampling from a single site. Table 2 displays the summary of methods used for concentration of environmental samples and HAV detection techniques employed for all included studies.
Discussion
This review synthesised available data on the environmental presence of HAV in LMICs. Data included in this review, however, only represent 10 of 109 (9.17%) LMICs. Given this paucity of data, our results cannot be generalised to all LMICs and indicate a need for more research to quantify the environmental presence of HAV in LMIC settings.
The included studies reported varying detection rates of HAV in a variety of environments, including raw sewage, treated sewage, groundwater, surface water, vegetables and shellfish. The high heterogeneity of HAV detection rates reported among these environmental types, however, was not surprising given the diversity of settings that the data were sourced from. The lack of obvious seasonality in HAV environmental presence reported in the review was also not surprising as HAV is a robust virus that is stable at low pH and at high temperatures of up to 80°C, which ensures the virus’s survival in environmental sources throughout the year.18
When assessing data from countries where heterogeneity allowed for the pooling of results, we were able to further explore the environmental presence of HAV in South Africa and Tunisia.
The prevalence of HAV detection rate in Tunisia was reportedly higher in raw than treated sewage, which is to be expected. In South Africa, however, HAV detection rates appeared to be higher in surface water than treated sewage. Furthermore, assessment of HAV presence in South African urban and rural surface waters was found to be comparable,19–21 implying that rural and urban populations in the country may be experiencing similar environmental exposure risks for HAV infection. Interestingly, a study that evaluated HAV seroprevalence in South Africa in a similar period (2005–2019) reported HAV seroprevalence trends that would be expected in a population where urban and rural HAV exposure is equal.22 As of 2019, neither South Africa nor Tunisia had introduced routine HAV vaccination programmes.23 Instead, in these two countries, HAV vaccination is available to few children in private healthcare and at an extra cost.
The HAV epidemiological transition has come into the public health spotlight globally, as some high-income settings are experiencing more frequent outbreaks of hepatitis A and some LMICs are reporting higher burdens of the disease (ie, an increase in hospitalisations and deaths due to HAV infection).24 The phylogenetic analysis included in our review showed regional overlap of HAV genotypes. These results imply ongoing global transmission of HAV, further supporting Jacobsen and Koopman’s5 theory that globalisation (including migration and international food trade) may be significantly linked with hepatitis A outbreaks in high-income settings. Second, our results reported an overall decline in HAV environmental detection from 2005 to 2017. This overall decline in HAV environmental presence may be linked with the increase in the burden of hepatitis A observed in some LMICs as declining HAV transmission rates are often linked with an initial increase in the burden of hepatitis A disease in the corresponding population.5
Article summary
Strengths of the review
We rigorously assessed the validity of included studies and quality of evidence was independently assessed by two reviewers.
A comprehensive literature search was carried out including publications in different languages which were subsequently translated into English language.
Limitations of the review
Limited number of studies met the inclusion criteria and hence paucity of the data.
Due to high heterogeneity among included studies, meta-analysis for the main study outcomes was not possible.
Conclusion
This systematic review aimed to characterise the environmental presence of HAV in LMICs. We successfully addressed the aims of the study, although there was paucity of data to pool results. As mentioned previously, the findings of this review should be interpreted with caution as the results represent only 10 of 109 LMICs. Given the findings of this review, further research to provide quality evidence on the environmental presence of HAV in countries with indications of HAV epidemiological transitions should be prioritised. Such information will better the understanding of HAV transmission routes and inform hepatitis A control strategies, including the introduction of HAV immunisation.
Acknowledgments
The authors are grateful to the librarians at the School of Health Sciences (University of Cape Town) for their invaluable support during the development of the literature search strategy and the sourcing of grey literature.
References
Footnotes
Contributors The original concept of the study was developed by JP, BK and GDH. PK and JP developed and implemented the systematic review protocol under the supervision of BK. Statistical analysis plan was guided by JP, SS and BK. PK and JP performed the literature search, screening of studies, data extraction and analysis under the guidance of BK, GDH and SS. PK wrote the first draft of the manuscript and all authors gave input to the final draft.
Funding The authors have not declared a specific grant for this research from any funding agency in the public, commercial or not-for-profit sectors.
Map disclaimer The depiction of boundaries on this map does not imply the expression of any opinion whatsoever on the part of BMJ (or any member of its group) concerning the legal status of any country, territory, jurisdiction or area or of its authorities. This map is provided without any warranty of any kind, either express or implied.
Competing interests None declared.
Patient and public involvement Patients and/or the public were not involved in the design, or conduct, or reporting, or dissemination plans of this research.
Patient consent for publication Not required.
Provenance and peer review Not commissioned; externally peer reviewed.
Data availability statement Data are available upon reasonable request. Data used in our review were extracted from publicly available research articles. Steps for retrieval and analysis of the data are outlined in the systematic review methods.