Article Text

Abstract
Objectives Our objective was to review the literature on the inferred duration of the infectious period of COVID-19, caused by severe acute respiratory syndrome coronavirus 2 (SARS-CoV-2) virus, and provide an overview of the variation depending on the methodological approach.
Design Rapid scoping review. Literature review with fixed search terms, up to 1 April 2020. Central tendency and variation of the parameter estimates for infectious period in (A) asymptomatic and (B) symptomatic cases from (1) virological studies (repeated testing), (2) tracing studies and (3) modelling studies were gathered. Narrative review of viral dynamics.
Information sources Search strategies developed and the following searched: PubMed, Google Scholar, MedRxiv and BioRxiv. Additionally, the Health Information Quality Authority (Ireland) viral load synthesis was used, which screened literature from PubMed, Embase, ScienceDirect, NHS evidence, Cochrane, medRxiv and bioRxiv, and HRB open databases.
Results There was substantial variation in the estimates, and how infectious period was inferred. One study provided approximate median infectious period for asymptomatic cases of 6.5–9.5 days. Median presymptomatic infectious period across studies varied over <1–4 days. Estimated mean time from symptom onset to two negative RT-PCR tests was 13.4 days (95% CI 10.9 to 15.8) but was shorter when studies included children or less severe cases. Estimated mean duration from symptom onset to hospital discharge or death (potential maximal infectious period) was 18.1 days (95% CI 15.1 to 21.0); time to discharge was on average 4 days shorter than time to death. Viral dynamic data and model infectious parameters were often shorter than repeated diagnostic data.
Conclusions There are limitations of inferring infectiousness from repeated diagnosis, viral loads and viral replication data alone and also potential patient recall bias relevant to estimating exposure and symptom onset times. Despite this, available data provide a preliminary evidence base to inform models of central tendency for key parameters and variation for exploring parameter space and sensitivity analysis.
- epidemiology
- virology
- infectious diseases
- public health
This is an open access article distributed in accordance with the Creative Commons Attribution Non Commercial (CC BY-NC 4.0) license, which permits others to distribute, remix, adapt, build upon this work non-commercially, and license their derivative works on different terms, provided the original work is properly cited, appropriate credit is given, any changes made indicated, and the use is non-commercial. See: http://creativecommons.org/licenses/by-nc/4.0/.
Statistics from Altmetric.com
Strengths and limitations of this study
A comprehensive overview of the literature pertaining to inferred infectious duration of COVID-19, including indirect measures from virological, contact tracing and modelling studies to 1 April 2020.
Both narrative review and quantitative analysis presented.
Small number of comparable parameter estimates for meta-analysis is a limitation.
Much of the current research material on COVID-19 is from preprint papers and therefore have not gone through formal peer review.
Introduction
Severe acute respiratory syndrome coronavirus 2 (SARS-CoV-2), a new coronavirus, emerged in China in late 2019.1 2 The virus causes COVID-19, a disease characterised by variable, mainly respiratory, symptoms across cohorts, from asymptomatic cases through to mild (eg, dry cough and fever) and severe cases (eg, pneumonia).3 4 The severity of symptoms, and their clinical outcome, have been reported to vary by age class and whether patients have underlying comorbidities. The case fatality rate increases with age and is highest for those above 70 years.5 6 There are several cases of asymptomatic test-positive patients reported in the emerging literature (eg, 4 7 8). Furthermore, asymptomatic (and presymptomatic) cases have been shown to be infectious, and secondary cases have been reported.9 10 However, the duration of this infectious period is difficult to measure accurately, and the time course of the natural history of infection generally must be inferred indirectly, via contact tracing of cases, serial repeated diagnostic virological studies and/or through modelling approaches. Symptomatic cases can experience an infectious presymptomatic period before the onset of symptoms, therefore understanding the whole infectious period for this cohort requires estimating the duration of both periods. It is essential to rapidly gain insight into this key variable impacting our understanding of COVID-19 epidemiology. Anderson et al 11 point out one of the ‘key unknowns’ is the infectious period for COVID-19, which they suggest may be 10 days but subject to great uncertainty.
Here we gathered data from published research from peer-reviewed and preprints from 1 December to 1 April 2020 to characterise the variation in the infectious duration inferred from the three lines of evidence. We also provide a narrative review of the viral dynamic literature. Our focus was on duration; relative infectiousness has been dealt with elsewhere.12 13
The aim of this review was to provide an overview and critical appraisal of published and preprint articles and reports that assess or quantify the inferred duration of the infectious period in order to best parameterise COVID-19 epidemiological transmission models.
Materials and methods
Conceptual model of population infection dynamics
Infectious period was contextualised in relation to a working conceptual model of COVID-19 disease dynamics (online supplementary figure S1, online supplementary material 1). From this conceptual model, three parameters were identified as important in context of this study:
Supplemental material
T2 defined as: duration of the total infectious period for asymptomatic cases, postlatent to recovery (‘recover’ in this context relates to clearing of infection).
T3 defined as: duration of presymptomatic infectious period for those infected individuals who subsequently develop symptoms (ie, postlatent to onset of symptoms).
T5 defined as: duration from onset of symptoms to recovery (recovery was inferred as either the first of two clear RT-PCR tests or hospital discharge after admission from COVID-19-related symptoms) or death.
‘Asymptomatic’ case definition was interpreted pragmatically following Davies et al 14 15 and may include very mild symptoms that may occur but are unnoticed.
T2, T3 and T5 represent readily measurable parameters but may be upper limits of infectious period, as patients may be non-infectious for a period before recovery or death. We also review evidence where infectiousness is inferred from viral shedding and contract tracing (transmission).
Literature search
A survey of the literature between 1 December 2019 and 1 April 2020 for all countries was implemented using the following search strategy. Publications on the electronic databases PubMed, Google Scholar, MedRxiv and BioRxiv were searched with the following keywords: ‘Novel coronavirus’ OR ‘SARS‐CoV‐2’ OR ‘2019-nCoV’ OR ‘COVID-19’ AND ‘infectious’. Additionally, national and international government reports were monitored. No restrictions on language or publication status were imposed so long as an English abstract was available. Articles were evaluated for data relating to the aim of this review; all relevant publications were considered for possible inclusion. Bibliographies within these publications were also searched for additional resources.
Manual searches of the literature was undertaken using daily updated COVID-19 collections from the National Centre for Biotechnology Information and MedRxiv servers (https://connect.medrxiv.org/relate/content/181), respectively, searching specifically for papers relating to ‘infectious period’ or ‘infectious duration’ from both empirical and modelling studies.
Finally, we used the complementary work undertaken by the Health Information and Quality Authority (HIQA) of Ireland, specifically the evidence summaries relating to asymptomatic transmission and viral load.16 17 The protocol for the evidence synthesis is published on the HIQA website.18 Briefly, the evidence synthesis process included searching databases from 30 December 2019 to 27 March 2020 (PubMed, Embase, ScienceDirect, NHS evidence, Cochrane, medRxiv and bioRxiv, and HRB open), screening, data extraction, critical appraisal and summarising the evidence.
Our aim was to have as great a breadth for an evidential base as possible to clarify what evidence was available to inform on the infectious period of COVID-19 and to identify key characteristics of the data sources and their interpretation. Therefore, our approach is a scoping review (following19). However, due to the emergent nature of COVID-19, this work is considered a rapid review.20 This paper follows the Preferred Reporting Items for Systematic Reviews and Meta-Analyses—Extension for Scoping Reviews (PRISMA-ScR) checklist. In accordance with the PRISMA-ScR checklist, the electronic search strategy can be found in the supplementary material (online supplementary material 2).
Supplemental material
Inclusion criteria were for papers that provided data to inform duration of infectious period based on: time from symptoms to recovery; time from symptoms to death; time from symptoms to diagnostic test clearance (≥two clear tests, defined as at least two consecutive negative reverse transcriptase PCR (RT-PCR) tests conducted 24 hours apart); presymptomatic infectious period; and time from first diagnostic test to diagnostic test clearance (≥two clear tests) for presymptomatic/asymptomatic cases. Inclusion criteria for viral dynamics were papers that reported viral load via cycle threshold (Ct) values from RT-PCR testing over repeated sampling of infected patients and studies that additionally reported viral isolation.
For quality control, studies were: (1) selected and screened initially by three members of the team from search terms outlined above (ÁBC, KH and FB), with parameters identified and recorded. (2) This was reviewed and supplemented by manual search by a different two team members (AWB and DM), again with parameters identified and recorded. (3) Finally, the review was then internally reviewed by an additional two members of the team (CMc and MC) and cross-referenced with other parameter synthesis documents being worked on by the group (all authors).
Parameter comparison
Parameters of interest
A priori, it was decided to harvest parameter estimates for: (1) asymptomatic and (2) symptomatic cases. As the period of infectiousness can only be estimated indirectly, parameter estimates from the literature was gathered from three different methodological approaches:
Virological studies tracking patients overtime undertaking serial testing, where infectious period was inferred from diagnostic testing history and/or by virus isolation.
Contact tracing studies where infectiousness is inferred by infector–infectee histories and/or clusters of infection.
Model parameters entered into mathematical models (priors) representing explicitly infectious periods or model parameters estimated from mathematical models (posterior estimates) estimating explicitly infectious periods
Visual and quantitative comparisons
To compare parameters visually, simulated distributions were estimated from the central tendencies and variation metrics described in the primary literature. To simulate data, 10 000 random variates were drawn from random number functions in Stata (ME, V.15.1; StataCorp. 2017. Stata Statistical Software: Release V.15) (rnormal and rgamma). Where possible, the distribution reported within the primary literature was used to represent the distribution (eg, Gaussian and gamma). Where distributional data could not be inferred, point estimates were presented.
There were adequate comparable data gathered on the duration of T5 (duration from onset of symptoms to death or recovery) from virological studies to employ a meta-analytic model. Many of the studies report different central tendency estimates, including mean and median. Methods of reporting variation across this central tendency included SD, range, IQR. To facilitate meta-analysis, reported estimates from all studies were converted to the mean and SD based on the formulae given in Wan et al.21
To obtain the SD from 95% CI, the method outlined in the Cochrane handbook22 was used:
SD: √n(Upper limit of CI – Lower limit of CI)/3.92
SE was calculated from SD and sample size (n), using:
SE=SD/SQRT(n)
Comparisons were made using the METAAN package in Stata V.15, using the random-effects (DerSimonian-Laird) model.23 This model assumes heterogeneity between the studies; that is, it assumes that the true effect can be different for each study. The model assumes that the individual study true effects are distributed with a variance τ2 around an overall true effect, but the model makes no assumptions about the form of the distribution of either the within-study or the between-studies effects. Weightings were derived from the SE (precision) around the estimate. Comparisons were presented as forest plots. Heterogeneity between studies was tested using Cochrane’s Q; the magnitude of the heterogeneity was categorised using I2 as high (>75%), moderate (50%–75%) or low (<50%).24
Variation in duration across T5 virological studies was compared using a random effects (RE) meta-regression model, using the METAREG command in Stata V.15.1. The hypothesis that heterogeneity may be related to the inclusion of children or depending on symptom severity within the sample was tested in separate univariate models. Severity was dichotomised (0/1) into studies that included patients described as having ‘mild’ or ‘mild-moderate’ symptoms versus studies that included patients with ‘moderate-severe’ or ‘severe’ symptoms. Similarly, studies were categorised into having some samples from ‘children’ (as reported in the paper), or wholly adult samples. These variables were then fitted as a dichotomous dummy predictor (independent variable). The parameter estimates from the regression model was solved using restricted maximum likelihood; additionally, p values were estimated using a Monte Carlo model with 1000 permutation test.25
Raw patient-level data were available from three studies in relation to time from onset to hospital discharge or death (potentially inferring maximal T5 duration). To estimate the predicted mean and 95% CI duration across these studies, data were analysed using a Gaussian RE model (using XTREG command, Stata V.15), with study categories fitted as the RE. A linear regression model with ‘study’ fitted as a categorical dummy variable was used to estimate the difference between duration across study datasets. Code and data are provided in online supplementary material 3 & 4.
Supplemental material
Supplemental material
Viral dynamics
A narrative comparison of reported viral dynamics from studies that undertook serial viral load estimates from patients over their period of observation was undertaken. Trends in the literature, strength and weaknesses were identified, and a conceptual model was illustrated.
Results
Parameter comparison
Overall, 65 parameter estimates were harvested from 48 papers (tables 1–3).
Reported infectious period (IP) for asymptomatic cases (T5 parameter) from virological studies where serial diagnostic tests were undertaken to infer IP; tracking studies where IP is inferred from contact tracing; modelling studies where IP is reported as a prior (assumed parameter value) or a posterior estimate
Reported infectious period (IP) for presymptomatic cases (T3 parameter) from virological studies where serial diagnostic tests were undertaken to infer IP; tracking studies where IP is inferred from contact tracing; modelling studies where IP is reported as a prior (assumed parameter value) or an posterior estimate
Reported infectious period (IP) for postsymptomatic cases (T5 parameter) from virological studies where serial diagnostic tests were undertaken to infer IP (onset to ≥2 tests); tracking studies where IP is inferred from patient histories from onset to recovery or death; modelling studies where IP is reported as a prior (assumed parameter value) or an posterior estimate
Infectious period for asymptomatic cases (T2)
The overall distributions and point estimates from studies for T2 are presented in figure 1 and table 1.

Simulation of the parameter distribution inferred for duration of infectious period for asymptomatic cases (T2); inferred infectious period for Davies et al, grey/blue curve, Davies et al pink curve (model priors). Green curve: Ma et al. Histogram is the distribution of asymptomatic cases to two clear tests reported by Hu et al. Reference lines are point estimates reported from Zhou et al, Li et al and Tuite et al.7 8 14 15 26 27 39 71
Two virological studies reported on infectious period based on serial diagnostic testing, for asymptomatic cases, were found to have informative data. One of these studies reported on only one asymptomatic case, with exposure to negative tests being 11 days (table 1). This duration should be considered an overestimate, given that a latent period is not taken into consideration. Hu et al 7 tracked infections of close contacts to infected persons and considered patients asymptomatic at time of diagnosis. Infectious period was defined as time from diagnosis to the first of two clear tests, providing a median duration of 9.5 days (n=24), range: 1–21; IQR 3.5–13.0.
Importantly, Hu et al 7 found that the infectious period was different between those who subsequently exhibited some symptoms (ie, presymptomatic) and those who did not: the median duration for asymptomatic infectious was 6.0 days (IQR 2.0–12.0; n=19). This was reduced to 4.0 days (2.0–15.0) for cases that were asymptomatic without abnormal CT scans (n=7).
Two tracing studies provide informative data (table 1 7 8). Infectious period was inferred indirectly from data provided in Ma et al,8 whereby infectious period was estimated as the difference between the upper (maximal) latent period estimate minus the serial interval. Ma et al 8 report on 49 asymptomatic cases and inferred serial interval from infector–infectee pairs. Serial interval was calculated by assuming ‘onset’ was at first diagnosis. Hu et al 7 reported on a case study cluster of infection within a house where the primary case was asymptomatic. Secondary infections occurred 4–9 days after index case exposure, the index patient tested positive until day 29 postexposure.
Modelling studies that have attempted to fit differing parameters depending on the severity of symptoms, and have used differing nomenclature, for example, asymptomatic, ‘mild’ or subclinical cases (table 1).14 15 26 27 Two papers by Davies and colleagues14 15 model this parameter as a gamma distribution with a mean periods of 5–7 days (figure 2); importantly, these papers assume infectious period is the same for asymptomatic and symptomatic cases.

Simulation of the parameter distribution used for T3 (the duration of the pre-symptomatic infectious period for those infected individuals who subsequently develop symptoms). Curves represent simulated approximations of distributions, given information provided from primary literature. Vertical lines represent point estimates where distributions could not be inferred (see table 2). 1. Peak et al (posterior); 2. Davies et al(prior); 3. Rothe et al; 4. He et al; 5. Davies et al (prior); 6. Wei et al.9 14 15 29 30 32
Presymptomatic: infectious period (T3)
Pan et al 3 and Hoehl et al 28 describe the cases of two individuals tracked and serially tested by real-time RT-PCR after being exposed to a patient with confirmed infection. In the latter study, the virus was isolated from samples, indicating transmission potential.
Four studies from China, Germany and Singapore provide informative data through tracing infections from cluster of infections and through infector–infectee pairs (table 2).4 9 29 30 These papers included the study by Rothe et al,9 which clarified that an asymptomatic patient visiting Germany from China may have actually experienced very mild symptoms around the time that transmission occurred (see Discussion).
Five modelling papers incorporated presymptomatic infectious period reported as prior distributions or estimated as a model output. Two papers describe the prior distribution using a gamma distribution.14 15 Tindale et al 31 provide mean point estimates under four different scenarios (two populations, early and late epidemic period). Peak et al 32 derives estimates of the presymptomatic infectious duration from a model of serial interval and report scenarios where there are pre-symptomatic infectious periods.
The approximated distributions are simulated in figure 2, which demonstrates the between-study heterogeneity in this parameter. The point estimates primarily cluster around the central tendencies of the distributions, except for Tindale et al,31 for a model reporting for late occurring cases in Tianjin, China (8.2 days).
Postsymptom onset: infectious period (T5)
The T5 parameter was informed from three lines of evidence from empirically driven studies:
Time from symptoms onset to the first of two clear RT-PCR tests.
Time from symptoms to hospital discharge.
Time from symptoms to death.
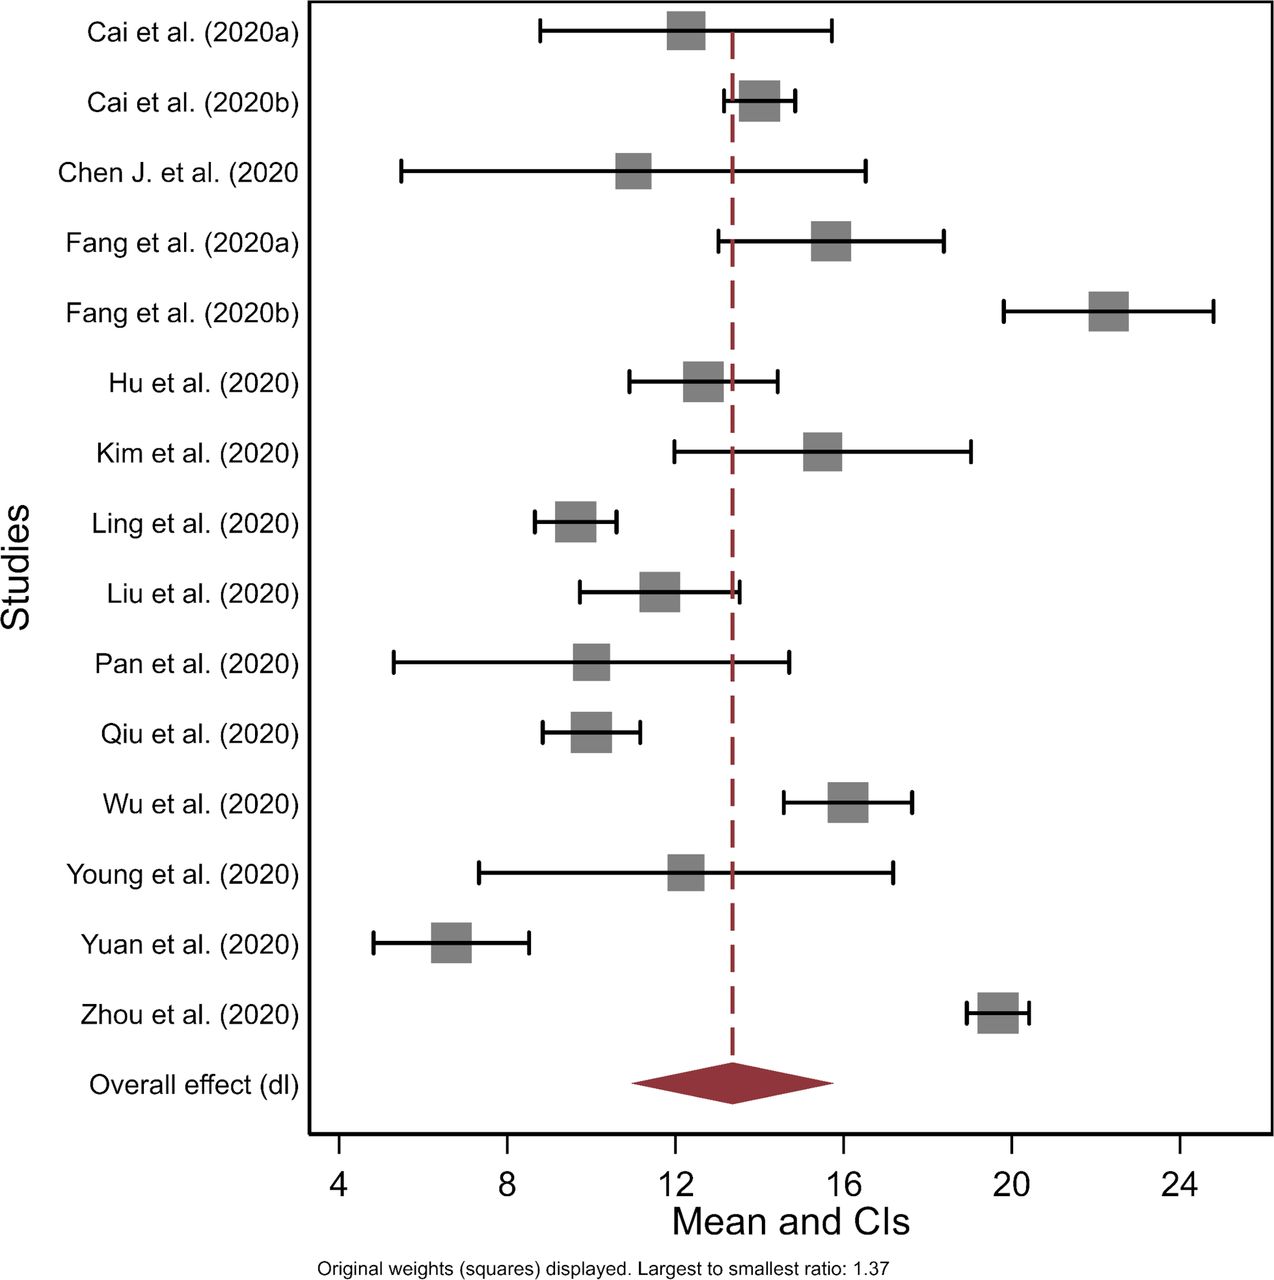
Figure 3 presents the forest plot for the mean time from symptom onset to clearance based on serial testing meta-analysis (n=15). The mean estimated duration was 13.4 days (95% CI 10.9 to 15.8). There was high heterogeneity across studies (Cochrane’s Q; p<0.001; I2 >75%). An RE meta-regression model suggested significant variation depending on whether studies included children as part of the sample (n=15 studies; proportion of between-study variance explained adj. R2=43.8%). Overall, the model estimated studies including children had on average 5.8 days shorter duration than adult only studies (95% CI 1.7 to 10.0; p=0.040; SE(p)=0.003). A second univariate RE meta-regression model suggested that there was non-significant increased mean duration of 4.0 days (95% CI −0.6–8.6; p=0.111; SE(p)=0.005; adj. R2=22.0%; n=14) for studies that included moderate–severe or severe cases, relative to mild or mild–moderate severity cases.

Forest plot of the mean duration from onset of symptoms to death or recovery (T5) based on virological studies.
High transmissibility during the first 5 days postsymptom onset was described by Cheng et al,33 based on secondary attack rates for 12 infector–infectee pairs. No contacts (n=1043) with primary cases were infected after 5 days of the index case onset of symptoms, inferred by the authors to suggest transmission occurring at symptom onset (but conceivably also suggest pre-symptomatic infection). Based on a cumulative density function, the authors suggest that infectiousness declines rapidly from onset of infection (distribution was truncated at 30 days); estimated cumulative infectiousness was 66.9% (95% CI 28.7 to 94.8) by day 1 and reached 86.9% (95% CI 64.3 to 99.5) by day five postsymptom onset (online supplementary figure S2).
For tracking studies relating to time to hospital discharge or death, raw case level data were available (studies n=3).31 34–36 Histograms of the raw data are presented in figure 4, along with the aggregated distribution. An RE model suggested a mean duration of 18.1 days (95% CI 15.1 to 21.0). However, there was significant variation across studies, with time to discharge being 4.96 days shorter (95% CI 2.15 to 7.7635) or 3.79 days shorter (95% CI 0.8 to 6.731) than time to death.34

Frequency distribution of T5, time from onset of symptoms to recovery (here hospital discharge or death), using patient level raw data from Kraemer et al 35 36 (pink bars), Linton et al 34 (purple bars) and Tindale et al 31 (green bars). Blue solid line is the kernel density of the aggregated dataset. Dashed lines represent the mean and 95% CI from a random effects regression model.
Two modelling papers use priors (mean: 3.2–3.5 days) to represent clinical infectious period.14 15 However, the distribution for this parameter is right censored when patients are hospitalised or isolated and therefore not an estimate of the full infectious period per se.
Infectious period for symptomatic cases (T3+T5)
Two tracing studies supplied parameter estimates for the full infectious period for patients who develop symptoms.8 29 He et al 29 inferred from a publicly available dataset of 77 infector–infectee pairs that infectiousness began 2.3 days (95% CI 0.8 to 3.0 days) prior to symptom onset, peaking at 0.7 days (95% CI −0.2 to 2.0 days) and continued up to 7 days from onset. The authors suggest that the transmission risk diminishes 7 days postsymptom onset. This suggests that the average infectious period, assuming a symptomatic infectious period of 7 days was approximately 9.3 days (95% CI 7.8–10 days, where CI is only reported for the presymptomatic period). He et al 29 estimated that the proportion of all transmission that was presymptomatic was 44% (95% CI 25% to 69%). Ma et al 8 analysed data from a number of countries (China, Germany, Japan, Malaysia, Singapore and Vietnam), collating 1155 cases from public data. They estimate several parameters, including ‘maximum latent period’ and the serial interval. The authors estimated the infectious period as maximum latent period minus the serial interval. Given their parameter estimates and methodological approach, infectious period would have been 5 days (range 0–24; IQR: 2–9; calculated from data presented within the paper).
Seven modelling papers reported duration of infectious period (T3+T5; table 4), with the reported central tendency for the distribution varying from 3 to 20 days. The form of the distribution offered to models for this parameter varied considerably, including point estimates (deterministic models), flat (uniform), Gaussian, Weibull and gamma distributions. Li et al 27 estimated the shortest median duration of 3.45 days, with a flat (uninformative) prior distribution corralled between 3–5 days. In contrast, Zhu37 used a mean prior of 10 days, with the model estimated mean duration being 12.5 days (variance 10; Weibull distribution). Piccolomiini and Zama38 used a fixed estimate of 20-day infectious period to model the Italian epidemic. Two papers from the same group14 15 suggested that infectious period for asymptomatic cases approximated for symptomatic cases where there was no right censoring (ie, transmission being halted through isolation or hospitalisation; gamma distributions of mean 5 or 7 days). Tuite et al 26 39 also assumed the same duration for ‘mild’ and ‘severe’ symptomatic cases (6–6.5 days).
Reported infectious period (IP) for symptomatic cases (T3+T5 parameter) from virological studies where serial diagnostic tests were undertaken to infer IP (exposure to ≥2 neg. tests); tracking studies where IP is inferred from patient histories from onset to recovery or death; modelling studies where IP is reported as a prior (assumed parameter value) or an posterior estimate
Viral load dynamics
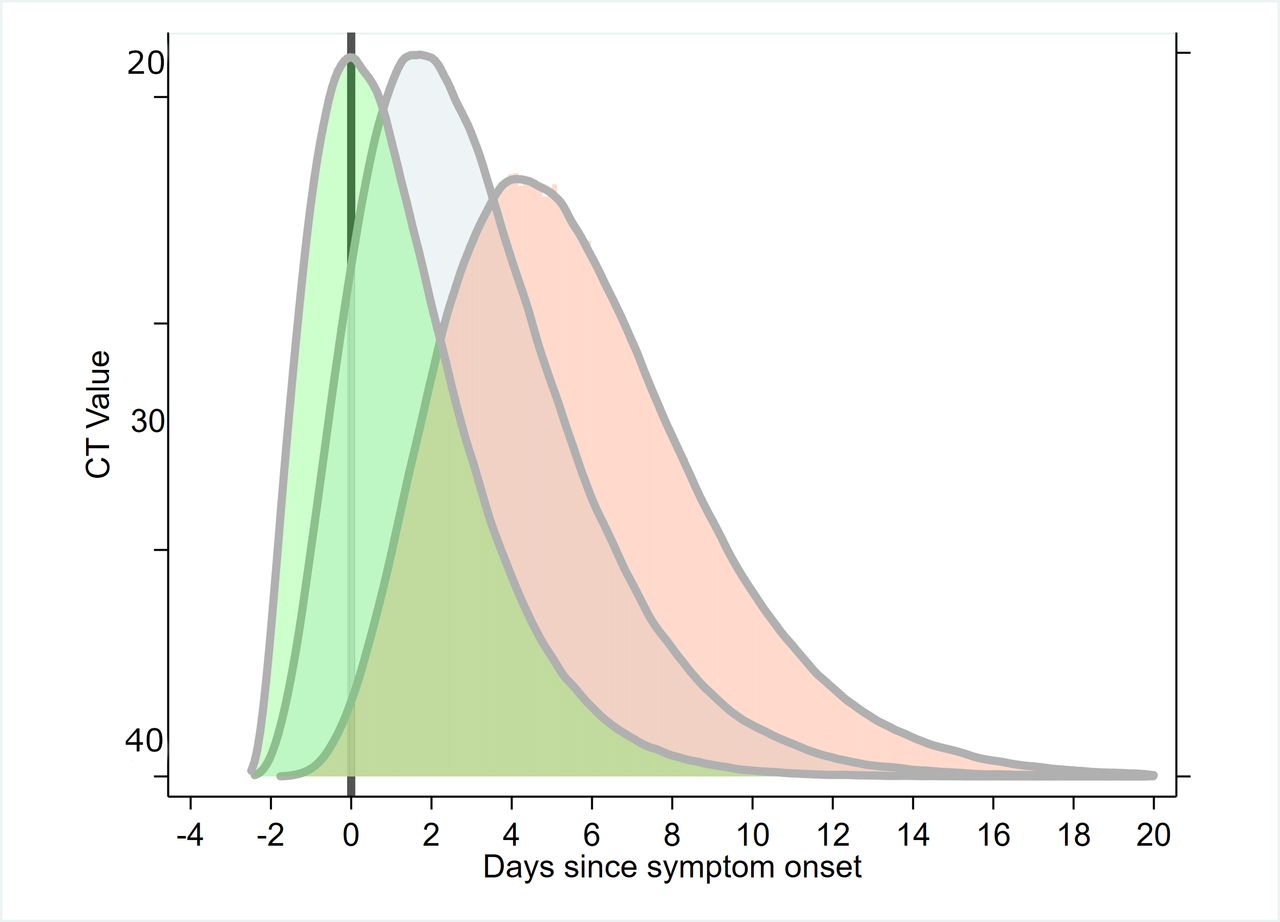
Viral load was reported from 21 papers using real-time RT-PCR testing, generally postsymptomatic monitoring.3 29 40–59 Qualitatively, the viral dynamics described early increase in viral load, peaking around onset or within 2–4 days of symptom onset (figure 5 for a theoretical model), before decreasing gradually over the next 1–3 weeks postsymptom onset. Maximum duration of detection ranged from approximately 20–49 days, with the longest duration associated with faecal samples (see Discussion). The duration where RNA was recoverable by RT-PCR may have been truncated due to insufficient follow-up in some cases. Studies that have investigated blood samples have provided some evidence for an association with severity of infection,16 60 though it is not clear whether this is a consistent feature of SARS-CoV-2 infection.40

Composite inferred model for cycle threshold (CT) value changes from serial RT-PCR testing for SARS-CoV-2; currently uncertain whether peak viral load typically occurs prior to, on or postsymptom onset (primary literature informing this model includes.29 50 53 59 SARS-CoV-2, severe acute respiratory syndrome coronavirus 2.
It should be noted the lack of data on presymptomatic or asymptomatic cases with regards viral load. An exception was Kam et al,61 who describe a presymptomatic case in an infant. In another study, Zou et al 53 undertook serial RT-PCR testing from nasal and throat swab samples from 14 imported cases and 4 secondary cases, in Guangdong, China. The dynamics of the infection in terms of Ct values and RNA copy number were described; Ct values of 30.76, 27.67, 24.56 and 21.48 corresponding to 1.5×10⁴, 1.5×10⁵, 1.5×10⁶ and 1.5×10⁷ copies per millilitre. Hence, lower Ct values infer higher viral loads. The authors report on a patient without symptoms, but with positive nasal swabs (Ct values: 22–28) and throat swabs (Ct values: 30–32) testing positive on days 7, 10 and 11 after contact. Importantly, the authors suggest ‘the viral load that was detected in the asymptomatic patient was similar to that in the symptomatic patients’. Furthermore, Kimbell et al 62 report that Ct values between asymptomatic (21.9–31.0), presymptomatic (15.3–37.9) and symptomatic cases (18.6–29.2) within a nursing home environment did not differ significantly. To et al 59 present data on temporal profile of viral load from saliva samples and found that median initial and peak viral loads in severe cases were non-significantly higher (p>0.5) by approximately 1 log10 higher than those in mild cases. Liu et al 58 present data showing viral load being 60 times greater for severe cases relative to mild cases.
This lack of presymptomatic data may result in left truncation of the risk distribution associated with viral load and shedding. Therefore, the typical timing of peak viral shedding (whether prior to, at or after onset), and its impact on transmission, is still uncertain. He et al 29 reported highest viral load at symptom onset from patients sampled in a hospital in China. Furthermore, the author’s estimate using a separate infector–infectee dataset (n=77) that 44% (95% CI 25% to 69%) of infectee cases were infected during the presymptomatic stage of the infector. Separately, a modelling paper by Ferretti et al 63 also appears to support this, estimating that 47% (0.9/2) of total transmission contributing R0, an overall measure of transmission during an infection, was presymptomatic (also see ref 33).
Wölfel et al 50 provides important data on a cohort of nine ‘mild’ cases that were serially tested using sputum, swabs (throat and nasopharyngeal), urine and faecal samples over time. Importantly, the virus was isolated, and inferences on viral replication could be made. Viral isolation and insights into viral replication improve inference around viral dynamics and transmission risk. The study suggested high viral loads shortly after symptom onset, which declined thereafter over time. Positive cultures were found from day 3–8 postsymptom onset (online supplementary figure S3), and the minimum 5% isolation success was achieved up to 9.8 (95% CI 8.5 to 21.8) days postonset from throat and lung samples but not faeces, blood or urine.
Discussion
Inferring infectiousness was challenging given the heterogeneity of evidence available. Virological diagnostic studies provide robust time series of infection; however, it is limited by inferring the relationship between PCR diagnostics and infectiousness. These data can also be affected by sampling procedure and sample sites (eg, upper respiratory, lower respiratory, faeces, urine and blood). We have excluded RT-PCR durations based on faecal sampling due to the current uncertainty whether these data pertain to transmission potential.50. Virological studies where culturing has taken place and where viral replication can be inferred would also be considered superior data to infer infectious period, relative to estimates of viral load alone.50 Where this has taken place, the data would suggest average infectious periods of up to 9.8 days postsymptoms. Recent modelling work suggest that the duration of viral detectability could overestimate the infectious period somewhere between 2 and 6 days.64
Viral load studies suggest peak viral load occurs close to symptom onset (potentially, −1 to 7 days of onset); however, there is uncertainty whether this typically occurs prior to, on or after onset (figure 5 for conceptual model). High viral loads, measured as Ct values, have been recorded for 1 week to 20 days postsymptom onset, with a general decreasing trend with time. For example, To et al 59 estimates a declining slope per day for log10 RNA copies per mL of −0·15 (95% CI −0·19 to −0·11; R 2=0·71). There are some studies reporting associations between viral load and symptom severity, with higher metrics of viral load in severe cases.3 58 59 However, Zou et al,53 and more recent data from Italy,64 65 suggest similar viral loads in symptomatic and asymptomatic cases.
We tested the hypothesis that severity of symptoms had an effect on symptomatic infectious duration using a meta-regression approach. There was a trend towards studies that included severe cases having longer duration (estimated to be 4.0 days longer), but the effect was not significant. Some studies have reported an association between duration of infectiousness and severity (eg, ref 58). However, uncertainty of whether this is robust remains. Caution is required when comparing severity of symptoms, as objective or standardised metrics are not always reported.
Virological studies that included children (either mixed adult children or children only cohorts) appeared to have shorter T5 durations (estimate: 5.8 days shorter). Liao et al 66 present data that suggests that children and ‘young adults’ (<35 years old) infected cases exhibited long incubation time (exposure to symptom onset; mean 7.2 days) and short serial interval (mean 6.5 days; median 1.9 days; time from onset in primary to onset in secondary case).
Contact tracing studies provided robust evidence of transmission events, and therefore infectiousness, but can be limited by the inferred timing of events, and symptoms experienced, due to the self-reported nature of data collection (recall bias). The subjective nature of self-reporting indeed can have an impact on case definitions of ‘asymptomatic’, which has led to some doubt on asymptomatic transmission in one case.9 Rothe et al 9 describe a case of apparent asymptomatic transmission from a Chinese visitor to business associates in Germany, which was cast into doubt when health officials reported that the patient had indeed experienced some, although minor, symptoms.67 Rothe et al 9 subsequently updated the clarification of the patients self-reported symptoms during the presumed asymptomatic infectious period, which included ‘feeling warm’ and ‘feeling cold’. However, the patient only ‘recognized getting sick’ after she returned to China on day four after the presumed exposure event.
Modelling parameters provide information on how COVID-19 data are being used and interpreted in the research community, given the limited data available. Posterior estimates also provide information on the parameter space at which infectious period central tendency reside, given other parameters and assumptions in the model. Models used highly varied approaches to modelling infectious period, which in turn resulted in highly variable parameter estimates used to inform the studies. An important factor to consider when comparing parameter estimates between empirical and modelling studies is the interpretation of the parameter by different disciplines and even between researchers from the same discipline. The infectious period can be considered significantly context specific and dynamic, and the ability to transmit infection can be modulated by interventions (eg, through isolation or hospitalisation). Modelling papers, depending on the model structure, can report truncated infectious period accounting for such interventions. Such estimates are not comparable with our definition of the parameters reviewed, and we have attempted to avoid such disparities where we found them.
Overall duration findings
There are few data for the precise definition of the asymptomatic infectious period (T2) parameter. Some reported asymptomatic cases can actually be presymptomatic, when cases are subject to follow-up (eg, ref 66; see Discussion). However, Hu et al 7 do provide the data for asymptomatic cases (that remain asymptomatic) across their presumed infectious period. Therefore, in the first instance, a parameter mimicking their data is probably the best available data over the period of the present study. Note there is a large variation in this data parameter, and a gamma distribution of a shape alpha 3, beta 2, mean 6, may be appropriate for the initial model runs. Despite these being the primary informative data, caution is required, given the uncertainty around the relationship between RT-PCR results and infectiousness. Overall, an informed central tendency of ~6 days, with very low probability draws for durations >20 days for the T2 parameter may be considered given the current state of knowledge.
The presymptomatic period is sometimes referred to as ‘preclinical infectious’ period (parameter T3). This has been estimated from several papers, and the central tendency of these estimates vary from <1 to 4 days, cautiously approximating to 2 days, on average. Current models have used central tendency estimates of 0.5–2.4 days.14 15 26 39 The relative consistency around the duration of this period allows for some confidence of its distribution. Current understanding of viral dynamics of infection suggest that viral load and shedding increases during postlatent phase, peaking around onset (for symptomatic cases), before declining.29 50 53 This aspect of the natural history of infection may be important when attempting to model transmission dynamics.
Length of infectious period in symptomatic cases that do not isolate (T5 parameter) has also been rarely directly measured in the literature, as serial monitoring of patients in terms of symptoms or viral load (RT-PCR) generally occurs after diagnosis and/or after admission to hospital (from a modelling perspective, this means cases are censored as they are assumed to no longer contribute to transmission). If natural progression of infection after diagnosis or hospital admission mimics the course of infection for those who do not isolate, the review of the literature describing time to two clear tests is informative. Symptom onset to serial testing clearance (assessed the time to first of two RT-PCR clear tests) averaged 13.4 days from our meta-analysis. In the maximal case, where patients succumb or fully recover from infection, time from symptoms to death or discharge may be informative. Studies that collated such information suggest mean durations of 18.07 days but with time to discharge being 4.96 days shorter on average than time to death. These values may represent an overestimation of the infectious period; one study suggested that there was on average 2.5 days between end of infectiousness and ‘removal’ (recovery or death).37
Cheng et al 33 provided evidence of transmissibility, based on attack rate from primary to secondary cases, at around symptom onset. The authors estimate cumulative infectiousness from onset, which suggests that 67% of total infectiousness potential occurs by the first day postonset. Most of the total infectiousness occurs within 5 days (86.9%) postonset, with the remaining infectiousness potential (13.1%) being distributed up to day 30 (this truncation is an assumption by the authors). It is possible that presymptomatic transmission occurred during this study, but the authors do not estimate what proportion of transmissions occurred during a presymptomatic infectious period or its potential duration.
A model by He et al 29 is informative for overall symptomatic duration (T3+T5), using 77 infector–infectee pairs where COVID-19 transmission occurred in China. The study reported that infectiousness was apparent on average 2.5 days prior to symptoms, reached a peak in risk at 0.6 days before symptoms and decline up until 7 days after onset (9.5 days total infectious period). The proportion of transmission before symptom onset (area under the curve) was estimated as 44% (95% CI 25% to 69%) based on inferences on incubation period. The authors suggest their data supported the view that transmission risk decline substantially after 7 days postsymptoms onset.
Model estimates used for infectious period parameter appears to be shorter than virological studies tracking RNA viral load over time. For example, Li et al 27 fitted a flat prior distribution for mean duration (D) fixed to vary between: 2≤D ≤5 days, and Lavezzo et al 64 fixed infectious period to 2 days in their epidemic model, whereas viral repeat testing studies provide evidence to suggest high viral loads can be detected to up 20 days (eg, pharyngeal swabs) and potentially longer from faecal samples (3–4 weeks or longer postsymptom onset)). Oral–faecal transmission risk is currently unknown, but some doubt has been raised about studies that have reported positive RT-PCR test results (see ref 68; but there may be some evidence of the risk among children69). Wölfel et al 50 has produced an important study that provides some data on viral replication and the site and duration over which this may be taking place. Their data suggest that viral replication, with high viral loads, occur in the upper respiratory tract, over the first week of symptoms peaking in day 4. Virus could not be isolated from faecal samples, despite high RNA concentration. Furthermore, virus was not isolated from blood or urine in that study.50
It should be noted that some of the virological and tracing studies reviewed had small sample sizes (see Study limitations) and potentially biased towards more severe cases or clusters of infection. It is unknown as to whether these cases are representative of infectious duration generally across populations. However, if symptom severity is linked to infectious duration, one could speculate that this bias could help to explain the some of the difference between model and empirical duration estimates.
Study limitations
Overall, the studies included were of good quality, though due to the rapid need for information from the global research community, many papers are preprints that have yet to be reviewed (at time of writing). Many papers were limited in terms of sample sizes, with several papers being case studies of one patient or single cluster outbreaks. There was a diversity of methods employed to infer dynamics of infectiousness across studies, and therefore the evidential base was variable. Some issues around nomenclature were noted, including definitions of asymptomatic, infectious period, latent and incubation period. It is possible the same data may have been used across different studies, especially where publicly available data were used.
There was significant heterogeneity across study findings, and this was related to diversity of clinical findings and methods employed. The meta-analysis employed for one parameter (T5) using virological studies, where cross-study comparisons could be made, suggested that the heterogeneity was high. Fu et al 70 cautions against combining studies to give an overall estimate without exploring subgroup or meta-regression analysis, which we have done here. The meta-regression was based on a small number of studies (n=12–13). Cochrane’s handbook suggests 10 studies for each level of a meta-regression; however, in practice much lower numbers have been used to test hypotheses,22 as is the case here. Fu et al 70 recommend a minimum of four studies per category, and therefore we dichotomised our predictor variables to ensure we met this minimum. Aggregating our categories resulted in crude findings.
Another limitation is that a systematic review was not undertaken to inform this research, hence there is a possibility that some relevant studies were overlooked. However, two independent research groups conducted comprehensive search strategies as part of a broader epidemiological parameters project for COVID-1912 13 71–73 to inform this research, hence limiting the potential for missing key studies.
Conclusion
There are few data to inform asymptomatic infectious period (T2 parameter). One study provide data that suggest a median period of 4–9.5 days; however, given the viral dynamics, this distribution could have an extended tail with low probability long infectious periods of up to 20 days. The presymptomatic infectious phase (T3) is quite narrowly defined to a mean of approximately 2 days (range: <1–4) within the literature. However, there is great uncertainty around the infectious period from onset to recovery or death (T5 parameter). The symptom onset until clearance (based on two negative RT-PCR tests) parameter estimate of 13.4 days (95% CI 10.9 to 15.8) is informative for T5 parameter, only if one assumes that RT-PCR positive results equate to having infectious potential. Many current models corral the infectious period to shorter time periods than what virological studies have suggested, with one recent study suggesting that duration of viral detectability overestimates the infectious period on average by 2–6 days. While viral RNA can be detected for long periods of time, especially from faecal samples, the ability to isolate the virus from infected cases quickly declines after 1-week postsymptoms. Some modelling papers have assumed that infectious period is invariant to whether cases are asymptomatic or symptomatic; however, the data available are not yet rich enough to inform whether this is a good assumption. Similarly, it is not yet established whether viral loads are similar between asymptomatic and mild, moderate or severe symptomatic cases, with conflicting reports in the literature.
References
Footnotes
Twitter @AndyByrneSci, @MiriamC51755360, @kieranwalshmpsi
Contributors AWB conducted the eligibility screening of shortlisted studies, extracted the data and conducted the analyses and completed the initial draft of the manuscript; SM was involved in conception and project coordination; ÁBC, KH and FB conducted the initial literature searches; DM, KOB and KAW conducted searches and screened shortlisted studies; AWB, SJM, ÁBC, KH, FB, DM, KOB, KAW, AB, JG, EAL, PW, CM and MC critically reviewed and commented/edited the paper. All authors read and approved the final manuscript.
Funding The authors have not declared a specific grant for this research from any funding agency in the public, commercial or not-for-profit sectors.
Competing interests None declared.
Patient and public involvement Patients and/or the public were not involved in the design, or conduct, or reporting, or dissemination plans of this research.
Patient consent for publication Not required.
Provenance and peer review Not commissioned; externally peer reviewed.
Data availability statement All data relevant to the study are included in the article or uploaded as supplementary information. The data used in this paper and code are presented in supplementary material 2 and 3; no additional data available.