Article Text

Abstract
Objectives and setting The 2008 financial crisis had a particularly severe impact on Greece. To contain spending, the government capped public health expenditure and introduced increased cost-sharing. The Greek case is important for studying the impact of recessions on health systems. This study analysed changes in household health expenditure in Greece over the economic crisis and explored whether the impact differed across socioeconomic groups.
Participants We used data from the Greek Household Budget Survey for the years 2004 and 2008–2017. The dataset comprised 51 654 households, with a total of 128 111 members.
Design We compared pre-crisis and post-crisis trends in Greek household out-of-pocket payments for healthcare from 2004 to 2017 using an interrupted time series analysis. This study explored spending in euros and as a share of total household purchases.
Results Our results indicated that the population level trend in household health spending was reversed after the crisis began (pre-crisis trend: €0.040 decrease per quarter (95% CI: −0.785 to −0.022), post-crisis trend: €0.315 increase per quarter (95% CI: −0.004 to 0.635)). We also found that spending on inpatient services and pharmaceuticals has been increasing since the start of the crisis, whereas outpatient services expenditure has been decreasing. Across all households, out-of-pocket payments incurred a greater financial burden after the crisis relative to pre-existing trends, but the poorest households incurred a disproportionately higher burden.
Conclusions This was the first study to use an interrupted time series analysis to assess the impact of the economic crisis on household health expenditure in Greece. Our findings suggest that there was an erosion of financial protection for Greek households as a consequence of the economic crisis. This effect was particularly pronounced among poorer households, which is indicative of a regressive financing system.
- health policy
- public health
- health services administration & management
This is an open access article distributed in accordance with the Creative Commons Attribution Non Commercial (CC BY-NC 4.0) license, which permits others to distribute, remix, adapt, build upon this work non-commercially, and license their derivative works on different terms, provided the original work is properly cited, appropriate credit is given, any changes made indicated, and the use is non-commercial. See: http://creativecommons.org/licenses/by-nc/4.0/.
Statistics from Altmetric.com
Strengths and limitations of this study
The use of quarterly aggregate Greek Household Budget Survey data for the years 2004 and 2008–2017 provides high-temporal resolution.
Household Budget Survey data provide detailed information on household health spending.
Interrupted time series analysis is a quasi-experimental method.
The data are repeat cross-sectional and self-reported.
It was not possible to include a control group in this analysis.
Introduction
Following the Great Recession of 2008 the global economy shrank by 1.7%, the first worldwide contraction in 60 years.1 Against the WHO’s recommendations, many policies involving cost-shifting and budget cuts were introduced in most European countries, resulting in regressive financing schemes and compromising universal health coverage (UHC).2
Greece experienced a uniquely severe economic downturn.3 Gross domestic product (GDP) fell by over 27% in real terms between 2008 and 2016,4 unemployment peaked at 27%5 and the percentage of the population at risk of poverty reached 36% (online supplementary table S1).4 The political context and austerity reforms are summarised in table 1. Between 2009 and 2012 public health expenditure on inpatient and outpatient services declined by 9% and 35%, respectively.6 Public sector health workers’ salaries were cut and a hiring freeze imposed in 2010 contributed to a 15% reduction in hospital staff.7 Many reforms, including increased cost-sharing and use of generics, targeted pharmaceutical expenditure, which fell by 40% by 2014.8 Currently, private spending contributes a considerable share of health expenditure in Greece. Out-of-pocket payments (OOPP) comprised 34.8% of health expenditure in 2017, more than double the European Union (EU) average.4
Supplemental material
An overview of the political and socioeconomic context in Greece during the study period (2004–2017)7
Economic reforms during austerity can affect health systems through a number of mechanisms. A framework developed by Kentikelenis,9 identifies three main pathways. Namely, direct health system reform policies (such as cost-sharing), policies which indirectly affect health systems (including changes to import prices and privatisation) and via the impact on the social determinants of health, such as education, unemployment and poverty. Together these mechanisms result in increased barriers to healthcare and worsening health outcomes.9
During the Greek crisis, the increasing cost of healthcare, coupled with falling income levels, created financial barriers to care. Evidence indicates that decreasing accessibility has led to patients delaying or avoiding seeking care.10–12 Unmet health needs increased among the general population13 and disproportionately among disadvantaged populations, increasing the gap in access to care between the richest and poorest groups by 10-fold.14 The consequences of this erosion of access to quality healthcare are reflected in population health trends. There have been increasing numbers of people with poor self-rated health, more deaths from medical mistakes15 16 and a rise in mortality from diseases responsive to healthcare, such as cancers, adverse birth outcomes and mental health problems.16–18
There are limited data pertaining to Greek household health spending. Available evidence indicates that Greek household spending habits altered after the crisis started, with OOPP increasing in both value and incidence, and that the impact differed across socioeconomic groups.17 19–23 However, previous studies do not fully investigate pre-crisis trends and mostly use before–after comparisons. Gaining a detailed understanding of trends in OOPP over time is particularly important as evidence points towards a more nuanced effect of the crisis across different socioeconomic groups and types of health expenditure.20 Moreover, no studies have used data beyond 2015. As more recent data become available, this could provide useful insights into the longer-term impacts of health system cuts and cost-shifting policies in Greece.
Therefore, this study aimed to test whether the economic crisis affected trends in household health expenditure between 2004 and 2017 employing an interrupted time series analysis (ITSA).
Methods
Data sources
We analysed Greek Household Budget Survey (HBS) data available from the Hellenic Statistical Authority (ELSTAT) for the years 2004 and 2008–2017.24 All EU member states conduct an HBS according to Eurostat guidelines and methodology.25 The Greek HBS is a repeat cross-sectional, nationally representative survey conducted annually since 2008, prior to which it was conducted every 4 years.24 The HBS uses a two-stage stratified sampling of households.26 The dataset employed in this study comprised 51 654 households, with a total of 128 111 members.
Detailed, anonymised data are collected on households’ monetary and non-monetary expenditure on goods and services, as well as sociodemographic factors. Health expenditure is divided into three subcategories: medicines, services of doctors of any specialty (excluding hospital services) and hospital services (online supplementary table S2). HBS respondents are asked to report spending on goods and services in the preceding weeks or months, depending on the frequency of expenditure, and keep a diary of certain purchases for 14 days.24 The HBS data are available in two formats from ELSTAT, namely aggregate level expenditure data which are available by quarter and individual household level data which are available annually.26
Measures
The quarterly aggregate dataset comprises weighted mean monthly household expenditure. Weights are included in the datasets and account for the complexity of the study design and improve the representativeness of the sample.26 Average annual household expenditure is available at the individual household level.
OOPP was defined as the sum of expenditure on pharmaceutical products, outpatient services, inpatient services and diagnostic services.20 27–29 To disentangle OOPP spending, we also explored expenditure on pharmaceuticals, outpatient and inpatient services individually. In the individual household level dataset inpatient spending was only provided as a total, whereas in the aggregate dataset it was separated into public and private expenditure. Expenditure variables were explored in monetary value and as a percentage of mean total monthly household purchases (online supplementary equation S1). All expenditure variables were adjusted to 2017 prices using consumer price index values obtained from ELSTAT.30 In kind purchases were excluded due to inconsistencies in data classification across years.
The HBS also provides information on household composition and sociodemographic variables of all household members, including age, marital status, occupation status, education status and income.24
Statistical analysis
Aggregate data
We used quarterly aggregate data to explore the impact of the economic crisis on household health expenditure at the population level. A single-group ITSA was conducted to assess whether there was a difference between expenditure trends before and after the crisis. Greek households only began to profoundly feel the consequences of the recession from 2010. From this point unemployment and the population at risk of poverty increased dramatically, which coincided with the introduction of cost-sharing policies.4 5 Accordingly, and in line with a previous study,17 we defined the onset of the crisis as the first quarter of 2010. To assess the impact of altering the interruption point, sensitivity analyses were conducted with different interruption points (Q3 of 2010, Q1 of 2011, Q3 of 2011 and Q1 of 2012).
The single-group ITSA regression model used in the analysis is based on the following equation:
 (1)
(1)
where  is the aggregate expenditure variable of interest,
  is the time since the start of the study period,
  is a dummy indicator variable (where 0=before 2010 quarter 1 and 1=after 2010 quarter 1) and
  is the interaction term. Hence,
  is the intercept,
  is the trend in expenditure before the crisis,
  is the change in expenditure immediately after the onset of the crisis or the step-change and
  is the difference between the pre-crisis and post-crisis trends. Therefore, the post-intervention liner trend is equal to
  . The Stata ITSA code employed in our analysis uses a slight variation of this model. The Stata model transforms the interaction term so that it runs in order starting from one at the point of the interruption.31
All aggregate ITSA models were adjusted for seasonality (winter, spring, summer and autumn) by including quarter as a categorical independent variable. Models were also adjusted for the average number of children and retired persons per household. 95% CIs were estimated using Newey-West standard errors, which accounted for autocorrelation.31
Individual household level data
We further investigated the impact of the crisis on health expenditure using the household level dataset. An ITSA was performed by including three time-based covariates in regression models, namely, year as a continuous variable, a dummy variable denoting the pre-crisis and post-crisis periods and an interaction term between the two. All household level regression analyses were weighted. The distributions of household level expenditure variables were heavily skewed; hence they were log transformed. In addition to the continuous expenditure variables, binary variables were created denoting whether or not households incurred any expenditure on the health expenditure variable of interest.
Household health spending was explored using two regression analyses stratified by income quintile. First, a weighted modified Poisson regression model using the binary expenditure outcome variables was conducted to explore changes in the percentage of households reporting spending above €0 on the health category of interest. We estimated incidence rate ratios (IRR) with 95% CIs calculated using robust standard errors. As HBS respondents were asked to report expenditure over the same reference period for a certain variable, the IRR can be interpreted as an adjusted prevalence ratio for the respective reference period. Second, we conducted a weighted log-linear regression analysis of the amount spent (in Euros (EUR) and as a share of total purchases) among households who spent greater than €0 on the variable of interest. Regression analyses were adjusted for sociodemographic variables that could affect health spending.11 20 We explored both linear and quadratic terms of continuous variables. The exact specification of models was decided following an iterative process using Akaike information criterion and Bayesian information criterion. The final regression models were adjusted for household size, squared household size, the presence of at least one unemployed household member, presence of a household member under five, presence of a household member over 65, private health insurance coverage, geographic region, population density and presence of a household member unfit for work, which was used as a proxy for living with disability.20 To adjust for socioeconomic status, households were grouped into income quintiles, quintile 1 being the poorest and quintile 5 being the richest.
The ITSA model assumes equally spaced time intervals. Due to the gap between 2004 and 2008, sensitivity analyses excluding 2004 data points were conducted to assess the robustness of the model. Significance level was set at 0.05. All statistical analyses were conducted using Stata V.15.1 (StataCorp).
Patient and public involvement
Patients and/or the public were not involved in the design, or conduct, or reporting, or dissemination plans of this research.
Results
Study population characteristics and descriptive statistics are shown in online supplementary table S3.
Aggregate ITSA
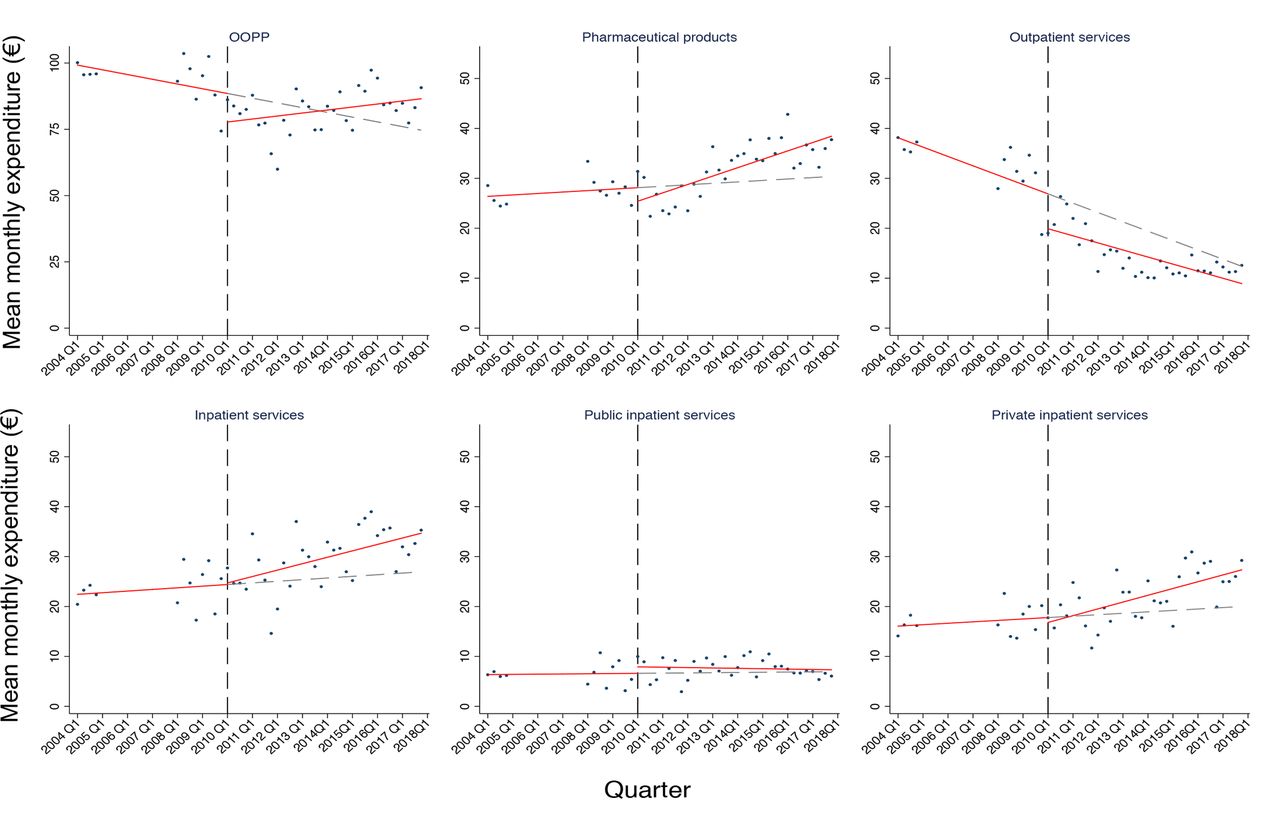
There was a significant difference between the pre-crisis and post-crisis trends in monthly household expenditure on OOPP. Mean monthly expenditure on OOPP was €96.840 in 2004 compared with €84.008 in 2017 (in 2017 prices). Spending in EUR was decreasing by €0.404 per quarter before the crisis (95% CI: −0.785 to −0.022). In the period immediately following the onset of the crisis, average monthly OOPP decreased by €13.670 (95% CI: −22.051 to −5.290) and during the crisis it was increasing at a rate of €0.315 per quarter (95% CI: −0.004 to 0.635) (figure 1). As a share of total purchases, there was no significant pre-crisis trend or step-change, but since 2010 spending has been increasing at a rate of 0.069% per quarter (95% CI: 0.050 to 0.088) (online supplementary figure S1).

Trends in household spending in EUR on health expenditure variables of interest over the study period. Spending is expressed as mean monthly expenditure (€) for each quarter between 2004 and 2017 (excluding 2005–2007 as data are unavailable for these years). The dashed black line at 2010 quarter 1 represents the onset of the crisis. The solid red line indicates the pre-crisis and post-crisis predicted trends and the dashed grey line shows the underlying trend without any interruption. All health expenditure variables are on a €0–50 scale with the exception of OOPP, which is on a €0–100 scale. OOPP, out-of-pocket payments.
Disaggregating the OOPP variable revealed differing trends across expenditure categories. In 2004 average monthly spending on pharmaceuticals was €25.852, which increased to €35.416 in 2017 (in 2017 prices). There was little change observed before the crisis, an immediate drop when the crisis began and a statistically significant quarterly increase after 2010 (figure 1).
Monthly outpatient services expenditure has been declining in monetary value and as a percentage of total monthly purchases since the start of the study period. In 2004 spending was €36.625, which fell to €11.838 in 2017. While there was no significant difference between the pre-crisis and post-crisis trends, there was a significant reduction of €7.957 in the period immediately after the onset of the crisis (95% CI: −13.864 to −2.051).
Mean monthly household spending on inpatient services was €22.592 in 2004 compared with €32.554 in 2017. There was no pre-crisis trend in monthly expenditure on inpatient services. However, after 2010 it was increasing in monetary value and as a share of total purchases. This trend was predominantly explained by changes in spending on private inpatient services; public inpatient spending has remained at a similar level since 2004.
Individual household analysis
Characteristics of the study population are shown in online supplementary table S4. Before the crisis, the percentage of households with OOPP spending was similar across income quintiles. However, in every year since the crisis, OOPP spending was more frequent among households in the richest quintile compared with the poorest (figure 2 and online supplementary figure S2). For both outpatient services and pharmaceuticals spending, the percentage of households reporting expenditure was lowest among the poorest quintile across almost all years after the crisis started. After 2010, inpatient spending became increasingly common in all quintiles, but there remained a considerable gap between the richest and poorest.

The percentage of households reporting any spending on health expenditure variables of interest and the amount spent (in EUR) among these households, 2004 and 2008–2017. Data are weighted and stratified by income quintile. Quintile 1 is the poorest 20% of households and quintile 5 is the richest. OOPP, out-of-pocket payments.
Among households reporting any spending, the richest quintile spent the most on OOPP, outpatient and inpatient services in almost all years. For inpatient services, the mean monthly spending gap between the richest and poorest households peaked at €181.710 in 2017. There was little variation in the amount spent on pharmaceuticals, both across years and income quintiles.
The financial burden of OOPP, pharmaceutical and outpatient spending was highest among households in the poorest quintile in almost all years (figure 2). OOPP expenditure in this quintile peaked in 2015 at 12.5% of total household purchases. The spending gap for pharmaceuticals expenditure peaked in 2015, when the richest households reported spending of 2.7% of total purchases while the poorest reported spending 9.0%.
Multivariable analysis revealed that there was a significant difference between the pre-crisis and post-crisis trends in the prevalence of OOPP spending across all income quintiles (figure 3). Immediately after the onset of the crisis, there was a relative reduction in the prevalence of OOPP expenditure, ranging from a 20.2% decrease in the poorest quintile (95% CI: 12.5 to 27.3) to 9.5% in the richest quintile (95% CI: 2.8 to 15.8). Over the post-crisis period, there has been a relative increase in the prevalence of OOPP of between 1% and 2% per year across all quintiles (p<0.001), whereas before the crisis OOPP was decreasing or showed no significant trend. Additionally, immediately after the onset of the crisis, there was a relative reduction in the prevalence of OOPP expenditure. Similarly, there was no significant trend in the prevalence of pharmaceutical spending before the crisis, but after 2010 the prevalence of spending was increasing by between 3% and 4% per year across all quintiles (p<0.001).

Adjusted pre-crisis and post-crisis trends in the prevalence of households reporting spending on OOPP and pharmaceuticals and the amount spent among the richest and poorest households reporting spending above €0. Data are weighted and stratified by income quintile. The annual change refers to the yearly change in the outcome as a percentage of the previous year’s expenditure. Trends in prevalence of expenditure are expressed as an adjusted annual prevalence ratio. Trends in the amount spent and the financial burden are expressed as a ratio which equates to the relative annual percentage change. The step-change indicates the change in expenditure between 2009 and 2010. *Significant difference between the pre-crisis and post-crisis trends. OOPP, out-of-pocket payments.
Among those reporting OOPP expenditure, the poorest households showed a greater response in the immediate aftermath of the crisis and OOPP expenditure in EUR exhibited a larger reduction relative to high-income households (figure 3). Additionally, only the poorest quintile showed a significant step-change in OOPP expenditure as a share of total purchases, with a relative reduction of 33.7% in the financial burden of OOPP (95% CI: 21.2 to 44.3). Across all quintiles there was no significant difference between the pre-crisis and post-crisis trends in OOPP spending in EUR (figure 3). Conversely, expenditure as a share of total purchases was increasing after the crisis across all quintiles, whereas there was no significant trend before the crisis. Between 2010 and 2017 there was a 5.1% relative increase per year in the financial burden of OOPP for the poorest quintile (95% CI: 3.5 to 6.7) and 4.0% per year for the richest quintile (95% CI: 2.4 to 5.6). On the other hand, the trend in pharmaceutical spending was unaffected by the crisis in all but the richest quintile (in monetary terms) and the poorest quintile (as a share of total purchases).
Between 2010 and 2017, there was a relative increase of between 2% and 3% per year in the prevalence of outpatient spending (p<0.001) across all but the richest quintile. Similarly, there was a significant difference between the pre-crisis and post-crisis trends in the prevalence of inpatient spending across all income quintiles, with the pre-crisis trend being reversed and the prevalence of expenditure increasing after 2010 (figure 4).

Adjusted trends in the prevalence of households reporting spending on outpatient services and inpatient services and the amount spent among the richest and poorest households reporting spending above €0. Data are weighted and stratified by income quintile. The annual change refers to the yearly change in the outcome as a percentage of the previous year’s expenditure. Trends in prevalence of expenditure are expressed as an adjusted annual prevalence ratio. Trends in the amount spent and the financial burden are expressed as a ratio which equates to the relative annual percentage change. The step-change indicates the change in expenditure between 2009 and 2010. *A significant difference between the pre-crisis and post-crisis trends.
Among households with spending on outpatient services, mean monthly expenditure was decreasing at similar rates across all quintiles before the crisis and continued to fall after 2010 (figure 4). In contrast, for all households reporting inpatient expenditure there was a significant difference between the pre-crisis and post-crisis trends in spending in monetary terms. Across all quintiles, the value of expenditure was decreasing in the post-crisis period, whereas before the crisis spending was increasing or showed no significant trend.
The sensitivity analysis largely confirmed the robustness of the results. In some instances, such as OOPP, pharmaceutical products and outpatient services, the pre-crisis trend was somewhat altered after the exclusion of 2004 (online supplementary figure S3), but considering the low number of data points before 2010, we included the 2004 data points to allow for better estimation of pre-crisis trends.
Sensitivity analyses with later interruption points provided largely consistent results across all outcomes. Later interruption points produced smaller step-changes, but the direction of pre-crisis and post-crisis trends and the statistical significance of changes were consistent with the main analysis.
Discussion
This analysis showed that the population level trend in household OOPP expenditure in Greece was reversed after the crisis started and spending increased between 2010 and 2017. This trend was mostly explained by increasing expenditure on pharmaceuticals and inpatient services. The impact of the economic crisis varied across socioeconomic groups in Greece. The poorest households showed a greater response in the immediate aftermath and these households also consistently had the highest expenditure as a share of total purchases on OOPP, outpatient services and pharmaceuticals. Moreover, as the crisis deepened, these households consistently incurred the greatest financial burden from health spending, indicating that financing systems became more regressive.
Our findings suggest that the increasing population-level trend in OOPP spending in monetary terms post-crisis might be at least partially explained by the rise in prevalence of households with OOPP. There was a 1%–2% relative annual increase in the proportion of households incurring OOPP after the crisis. These findings align with a study by Filippidis et al,17 in which the percentage of Greek individuals reporting any OOPP increased from 34% to 59% between 2010 and 2015. A study in 11 European countries also indicated that OOPP spending was more common after the crisis.27 The mean financial burden of OOPP as a percentage of total household expenditure increased from 2009 to 2017 across all income quintiles. This is consistent with findings from Greece that OOPP as a share of household capacity to pay increased from 6.9% to 7.8% between 2008 and 2015.20 Other studies across Europe have also found that the financial burden of OOPP increased after the crisis.2 32 33
Across the study population, the prevalence of pharmaceutical spending increased at a faster rate after the onset of the crisis. This could be linked to the withdrawal of reimbursement status for many drugs under the economic adjustment plan.19 Population level inpatient spending was increasing after the crisis, mostly driven by increasing expenditure on private services. At the household level, there was a dramatic drop in the prevalence of spending immediately after the onset of the crisis in all but the richest quintile, which could suggest a shift away from the private sector in favour of public services. Indeed, between 2010 and 2012 there was a 30% increase in admissions to public hospitals and a reduction of 30% in private admissions.34 As the crisis deepened the proportion of households with inpatient services expenditure increased across all quintiles, suggesting a return to private services, which is highlighted by the increasing population-level trend in spending on inpatient services.
The poorest quintiles exhibited a greater reduction in the prevalence and value of spending on total OOPP, outpatient services and pharmaceuticals immediately after the crisis began relative to the richest quintile. It could be hypothesised that these households reduced non-essential health expenditure as disposable income fell.35 On the other hand, poorer households could be delaying seeking care due to cost, which aligns with the rising prevalence of unmet healthcare needs.36 37 After the crisis, the prevalence of health expenditure was lowest in the poorest quintiles, even for services with unavoidable user fees, which suggests that these households may indeed be forgoing care. As the crisis progressed, OOPP increased as a share of total purchases for all households, but this burden was consistently highest among the poorest quintiles, which could be related to the lack of means testing in most cost-sharing policies.38
This is the first study to use ITSA to compare pre-crisis and post-crisis trends in health expenditure among Greek households. The use of ITSA, a quasi-experimental method, and quarterly data allowed better attribution of the changes in household health expenditure to the economic crisis.17 20 However, there are some limitations to the ITSA approach. There was no external control group included in this analysis. ITSA has been used previously to estimate the impact of the economic crisis on populations16 17 39 but, unlike typical ITSA, there is no clear time point which can be defined as the start of the economic crisis. Indeed, some of the impacts of the crisis may have begun to manifest before or after 2010.
The HBS data are not without limitations. These datasets are cross-sectional and self-reported. Our analysis could not identify households which suffered health shocks but did not have the financial resources to pay for care, thus reported no health expenditure.40 Moreover, health status is not measured by the HBS, and so it was not included as a potential confounder. However, we controlled for proxies of health status. Namely, presence of a household member unfit for work, presence of a household member under 5 and presence of a household member over 65. Finally, although the HBS provides more detailed information on household health spending than other data sources, the expenditure categories remain broad, meaning we were unable to assess the impacts of specific cost-sharing policies.
A key limitation in our dataset was the gap in time points between 2004 and 2008, but the sensitivity analysis was largely consistent with the main analysis.
These findings from Greece present an opportunity to highlight the consequences of cost-shifting during austerity. Our results suggested there was a particularly negative impact on poor Greek households. The introduction of exemptions from the €1 prescription fee for disadvantaged populations in 2016 was a welcomed development.7 Moreover, the reforms to EOPYY in 2016 expanded coverage to all uninsured individuals and vulnerable groups. However, more policies, such as additional means-testing and exemptions for user fees, are needed to protect vulnerable populations. The results also indicated that increasing the system’s reliance on OOPP increases the financial burden placed on households. Greece is not alone in its reliance on OOPP to pay for healthcare. Spain, Portugal, Italy and Cyprus also have high OOPP as a share of total health expenditure.4 8 In line with WHO recommendations, policymakers must take steps to reduce OOPP41 through safeguarding health budgets and avoiding cost-shifting. When faced with limiting public spending, governments should protect households from financial hardship and maintain access to health services. Focusing on streamlining and reducing waste in health systems may be an effective way to contain costs.42
In our discussion of the results, we considered the impact of healthcare-related policies which directly affected the outcome variables of interest, namely the reduction in public health expenditure and increase in cost-sharing. However, there are other policies at play which will have impacted the Greek population in the wake of the crisis, including broader welfare policies, cuts to education budgets and increasing taxes.7 Further research is needed to disentangle the impact of these policies. Future studies could also consider our findings to explore the interactions between the recession, political developments, health policies and household spending. Such an undertaking was beyond the scope of this study, but it can illuminate the complex relationship between social, political and healthcare processes.
Given the cross-sectional nature of the HBS data, a longitudinal study would provide valuable insight into the evolution of household health expenditure after a financial crisis. More research is needed to elucidate how specific cost-sharing policies affected care-seeking behaviour. Investigating household health expenditure in conjunction with healthcare use would build on our findings and improve our understanding of how the crisis affected UHC. Current indicators of financial protection, namely catastrophic health expenditure and impoverishment due to OOPP, may not fully capture the harm caused when financial protection is compromised.36 41 A more comprehensive group of indicators, which go beyond OOPP and are sensitive to the early stages of UHC erosion, are needed to improve monitoring. Such indicators can prompt appropriate and timely action to prevent financial hardship.36
Conclusion
This analysis found that Greek households reported increasing expenditure on OOPP both in monetary terms and as a share of total purchases after the crisis relative to pre-crisis trends. We found that an increasing proportion of households reported spending on OOPP, pharmaceuticals, outpatient and inpatient services after the crisis. Among households spending money on health, the burden of expenditure has been increasing since the onset of the crisis, and this effect was particularly pronounced for the poorest households. The WHO has outlined ‘fairness in financing’ as a key health system goal.43 The results presented here indicate that the Greek health system failed to meet this objective, and financial protection was compromised after the onset of the crisis. Overall, these findings should serve as a lesson to policymakers in other countries on the importance of safeguarding government health budgets and limiting cost-sharing during austerity. These lessons learnt from the Greek case are of particular relevance as we head towards another global recession in the wake of the COVID-19 pandemic, which will undoubtedly increase pressure on healthcare systems across the world.
References
Footnotes
Contributors CC contributed to formal analysis, methodology, data curation, writing—original draft, visualization; RP contributed to conceptualisation, methodology, supervision, writing—review and editing; PS contributed to data curation, formal analysis, writing—review and editing; RH contributed to data curation, formal analysis, writing—review and editing; OS contributed to conceptualisation, writing—review and editing; FTF contributed to conceptualisation, methodology, supervision, writing—review and editing.
Funding The authors have not declared a specific grant for this research from any funding agency in the public, commercial or not-for-profit sectors.
Competing interests None declared.
Patient consent for publication Not required.
Ethics approval This study was an analysis of publicly available, routinely collected secondary data sources and so ethical approval was not required.
Provenance and peer review Not commissioned; externally peer reviewed.
Data availability statement Data are available in a public, open access repository. All data are publicly available from ELSTAT (https://www.statistics.gr/en/home).