Article Text

Abstract
Objective The Royal College of Obstetricians and Gynaecologists has advised that consolidation of birth centres, where reasonable, into birth centres of at least 6000 admissions per year should allow constant consultant presence. Currently, only 17% of mothers attend such birth centres. The objective of this work was to examine the feasibility of consolidation of birth centres, from the perspectives of birth centre size and travel times for mothers.
Design Computer-based optimisation.
Setting Hospital-based births.
Population or sample 1.91 million admissions in 2014–2016.
Methods A multiple-objective genetic algorithm.
Main outcome measures Travel time for mothers and size of birth centres.
Results Currently, with 161 birth centres, 17% of women attend a birth centre with at least 6000 admissions per year. We estimate that 95% of women have a travel time of 30 min or less. An example scenario, with 100 birth centres, could provide 75% of care in birth centres with at least 6000 admissions per year, with 95% of women travelling 35 min or less to their closest birth centre. Planning at local level leads to reduced ability to meet admission and travel time targets.
Conclusions While it seems unrealistic to have all births in birth centres with at least 6000 admissions per year, it appears realistic to increase the percentage of mothers attending this type of birth centre from 17% to about 75% while maintaining reasonable travel times. Planning at a local level leads to suboptimal solutions.
- obstetrics
- health policy
- health services administration & management
- quality in health care
- maternal medicine
This is an open access article distributed in accordance with the Creative Commons Attribution Non Commercial (CC BY-NC 4.0) license, which permits others to distribute, remix, adapt, build upon this work non-commercially, and license their derivative works on different terms, provided the original work is properly cited, appropriate credit is given, any changes made indicated, and the use is non-commercial. See: http://creativecommons.org/licenses/by-nc/4.0/.
Statistics from Altmetric.com
- obstetrics
- health policy
- health services administration & management
- quality in health care
- maternal medicine
Strengths and limitations of this study
The study described allows for a national view of the relationship between the number of obstetrician-led birth centres (based on choosing from current locations of any birth centre with at least a special care neonatal care on the same site) in England, and the dual goals of (1) having all patients attend a birth centre with at least 6000 admissions per year and (2) having mothers within 30 min of a birth centre.
The study takes an objective approach with explicitly described objectives.
The study uses a genetic algorithm that is able to hunt for solutions when there are a vast range of possibilities.
A limitation of the study is that identified solutions do not take into account the complex local pressures and reasons for preferring to maintain one birth centre over another at the cost of the objectives used in identifying solutions in this study.
The study assumes that mothers will attend their closest birth centre (by private car travel, assuming normal road conditions) and does not try to model the effect of complicating factors such as maternal choice or road congestion.
Introduction
In an ideal world, all patients would live close to a hospital able to provide all aspects of birth care (eg, continuous consultant and anaesthetist presence). In reality, there is a conflict between the time to access comprehensive birth care and the number of birth centres of sufficient size to provide around the clock consultant presence.
In 2015, National Health Service (NHS) England, the statutory agency responsible for the provision of healthcare in England, announced 44 geographical areas that would build ‘Sustainability and Transformation Partnerships' (STPs, with some evolving into ‘integrated care systems’) to deliver sustainable transformation in health and care outcomes between 2016 and 2021.1 2 STPs are a key footprint for planning of many acute services in England. In addition to STPs there are five NHS regional teams which provide additional support and leadership in commissioning services. Planning and service delivery footprints, while necessary, have the potential to limit options, possibly leading to suboptimal solutions for both healthcare providers (who may struggle with unsustainable admission numbers) and patients (who may have to travel further for care).
We have previously described the use of a genetic algorithm to optimise the planning of the number and locations of birth and neonatal services.3 We have extended that work to focus on birth centres, and have extended our methodology to allow for optimisation of more parameters, generation of more potential solutions, and the use of planning footprints.
The Royal College of Obstetricians and Gynaecologists (RCOG) has drawn attention to the optimal size of birth centres, based in part on desire for constant consultant presence where feasible. It has suggested that continuous (24/7) consultant presence should be possible with centralisation into birth centres with more than 6000 admissions per year.1 However, consolidation will increase travel times for some mothers, and so we modelled the relationship between the the proportion of mothers attending these larger centres and the travel times for mothers.
The objective of this work was to examine the feasibility of consolidation of birth centres, purely from the perspectives of birth centre size and travel times for mothers. Can there be full consolidation into birth centres with 6000 per centres per year while maintaining reasonable travel time for mothers and avoiding overly large centres? And if full consolidation appears unfeasible, what level of consolidation might be feasible? We also wished to examine the effect of planning footprint size on the ability to provide comprehensive birth services close to home.
Methods
Detailed methods have previously been described.4 Data and code used are available at https://github.com/MichaelAllen1966/1901_birth_centre_location
Data
Location data used 2011 lower super output aeas (LSOA). These are small geographic areas that divide England into 33 161 areas for collection of statistics. They usually have a population around 1600 (in 20155 the min, lower quartile, median, upper quartile and maximum were 523, 1447, 1599, 1802 and 9551, respectively) and with an average distance of 2 km between the centres of nearest-neighbour LSOAs. The home location of the mother was taken as the population-weighted centroid of each LSOA6. Population per LSOA was taken from the Office of National Statistics.7 Travel times were based on the estimated fastest road travel times. Travel times for mothers were taken from the postcode closest to the population-weighted centroid of the parent LSOA to the postcode of the birth centre. Travel times were estimated using Maptitude (www.maptitude.com) and MPMileCharter (http://www.milecharter.com). Travel times are estimated for normal road conditions without significant congestion.
Admissions for birth per LSOA for 3 years 2014–2016 were obtained from NHS Hospital Episodes Statistics (HES) managed through Lightfoot Solutions (www.lightfootsolutions.com). Admission numbers per birth centre were obtained from a separate HES query of 2016 for births. Data obtained were aggregate numbers of admissions and no patient-level data were obtained. We included 1.91 million admissions as defined as all admissions with an NHS primary operating procedure code of R17–R27 (this includes still births of fetuses past 24 weeks gestation). The data represent the number of admissions, so that birth of twins, for example, counts as one admission.
The locations of birth centres available in the model were taken from the 2015 list of all maternity centres with at least a Special Care neonatal unit8. 161 such birth centres existed in 2015.
Optimising choice of locations of birth centres
The model predicts, for any configuration of birth centres, the travel times (fastest road travel time chosen, from home location of mother to birth centre) and the number of admissions to each birth centre.
We used a bespoke genetic algorithm based on NSGA-II9 (Non-dominated Sorting Genetic Algorithm II) to derive potential configurations of obstetrican-led birth units across England, balancing competing objectives. As possible locations, we include any unit currently also providing neonatal special care (we do not add any new locations not currently used).
Detailed methods are given in the online supplementary appendix. The key steps of the method are:
Supplemental material
Configurations are encoded as binary arrays (chromosomes) with a 1 indicating a unit is open, and a 0 for closed. For example, 001011 would represent six birth centres, with hospitals 3, 5 and 6 being open and 1, 2 and 4 being closed. In this study, the array length is 161 (for the 161 units under study).
The model starts with 10 000 randomly selected configurations (which may have between 1 and 161 birth centres in the model). This is called the population.
The best solutions in the population are kept. For selection of best solutions we used a ‘Pareto-based’ method whereby, when there are multiple objectives, generated solutions are eliminated if another solution is equally as good in all optimisation parameters and is better in at least one parameter. The selected configurations were based on a range of optimisation parameters which seek to minimise travel times and to control admission numbers. These parameters were (1) number of birth centres (lower is better), (2) average travel time (lower is better), (3) maximum travel time (lower is better), (4) proportion of mothers within 30 min of a birth centre (higher is better), (5) lowest number of admissions to any birth centre (higher is better), (6) highest number of admissions to any birth centre (lower is better), (7) proportion of patients attending a birth centre with at least 6000 admissions per year (higher is better), (8) proportion of mothers within 30 min of a birth centre with at least 6000 admissions per year (higher is better).
New solutions are generated by selecting two of the selected solutions at random (the parents), and two new child hybrids of the two parent solutions generated (the child hybrids are created using a crossover technique similar to natural genetic breeding. This is repeated to build up a population of new solutions (these new solutions may also be randomly mutated so that 0 and 1 may occasionally be switched and vice versa).
The new child population is combined with the selected parent population and the process, from Pareto selection, is repeated (typically between 200 and 500 generations).
Geographical regions
The geographical coverage of the five NHS regions and 44 STPs are shown in figure 1. These are used in some modelling scenarios to constrain provision of birth care, such that mothers must stay within the boundaries of either the NHS regions or the STPs. Further details about the geography is provided in the online supplementary appendix.

Geographical coverage of NHS regions (left) and STPs (right). Colours indicate the coverage of the five NHS regions or the 44 STPs. NHS, National Health Service; STP, sustainability and transformation partnership.
Public and patient involvement
The project included public and patient involvement (PPI) input3 in preparation of the study design, and then by three workgroups during the project. The aims of PPI were (1) To ensure that the modelling work and health economics we carried out took into account the needs and concerns of parents and families who use childbirth and neonatal services, and (2) To explore the best way to communicate our findings to parents and the public and to involve them in decision making about the design and configuration of childbirth and neonatal services.
Key messages from our PPI group were: (1) There was a strong view that parents would embrace more distant care where it made a material difference to outcome, (2) There were mixed views on whether mothers would prefer to stay at a more distant hospital for stability, or be transferred back to a more local hospital, (3) Detailed planning should consider those who rely on public transport (especially for visiting when in-patient stay is long) and (4) Communication of birth centre consolidation is likely to be difficult, and may be viewed as as cost-cutting measure rather than a measure designed to enhance quality of care.
Results
Size of birth centres
In 2016, 17%, 38%, 65% and 80% of births were in birth centres with at least 6000, 5000, 4000 or 3000 admissions, respectively. There were 15 birth centres with at least 6000 births. The largest centre had 9125 admissions.
Current estimated travel times and admissions per birth centre
The model predicts that currently, if all mothers attended their closest birth centre, and with 161 birth centres, the average, 95th percentile (the travel time that 95% of mothers are within), and maximum travel time would be 14, 30 and 82 min. Ninety-five per cent of mothers would be within 30 min of their closest birth centre, 23.0% would attend a birth centre with at least 6000 admissions and 22.8% would attend a birth centre with at least 6000 admissions per year and which is also within 30 min. Admissions would range from 1094 to 8549 per year.
The effect of changing the number of birth centres
As birth centres are chosen from current locations, the maximum number of birth centres in any model is the same as the current number of birth centres. Reducing the number of birth centres increases the proportion of mothers attending a birth centre with 6000 admissions, and increases the size of both the smallest and largest birth centres (figure 2). Because objectives may compete with each other, for any given number of birth centres, the best individual optimisation parameter results (the result that may be achieved for one objective if nothing else is important) may not all be achievable simultaneously. Table 1 shows six example solutions with 50–150 birth centres, showing realistic compromises between each of the optimisation parameters.
Example individual solutions with varying numbers of birth centres

The effect of changing the number of birth centres on (A) travel times, (B) admission numbers and (C) ability to meet travel time and admissions targets. Results show best identified solutions for each optimisation parameter (but these may not necessarily be achieved simultaneously).
In order to have all birth centres admitting at least 6000 women per year, the maximum number of birth centres is 69. With this configuration the average, 95th percentile, and maximum travel time would be 21, 47 and 131 min, with 83% of mothers’ travel time within 30 min. It would not be possible to avoid some birth centres with at least 15 000 admissions per year (which may not be feasible). Assuming that the travel times and largest birth centre are unlikely to be considered unacceptable in this scenario, and that some compromise is required in the number of women attending a birth centre with 6000 admissions per year, the example solutions provided in table 1 provide a range of solution with different balances between achieving desired birth centre size, and achieving care close to mothers’ homes.
Application of STP and NHS regions boundaries
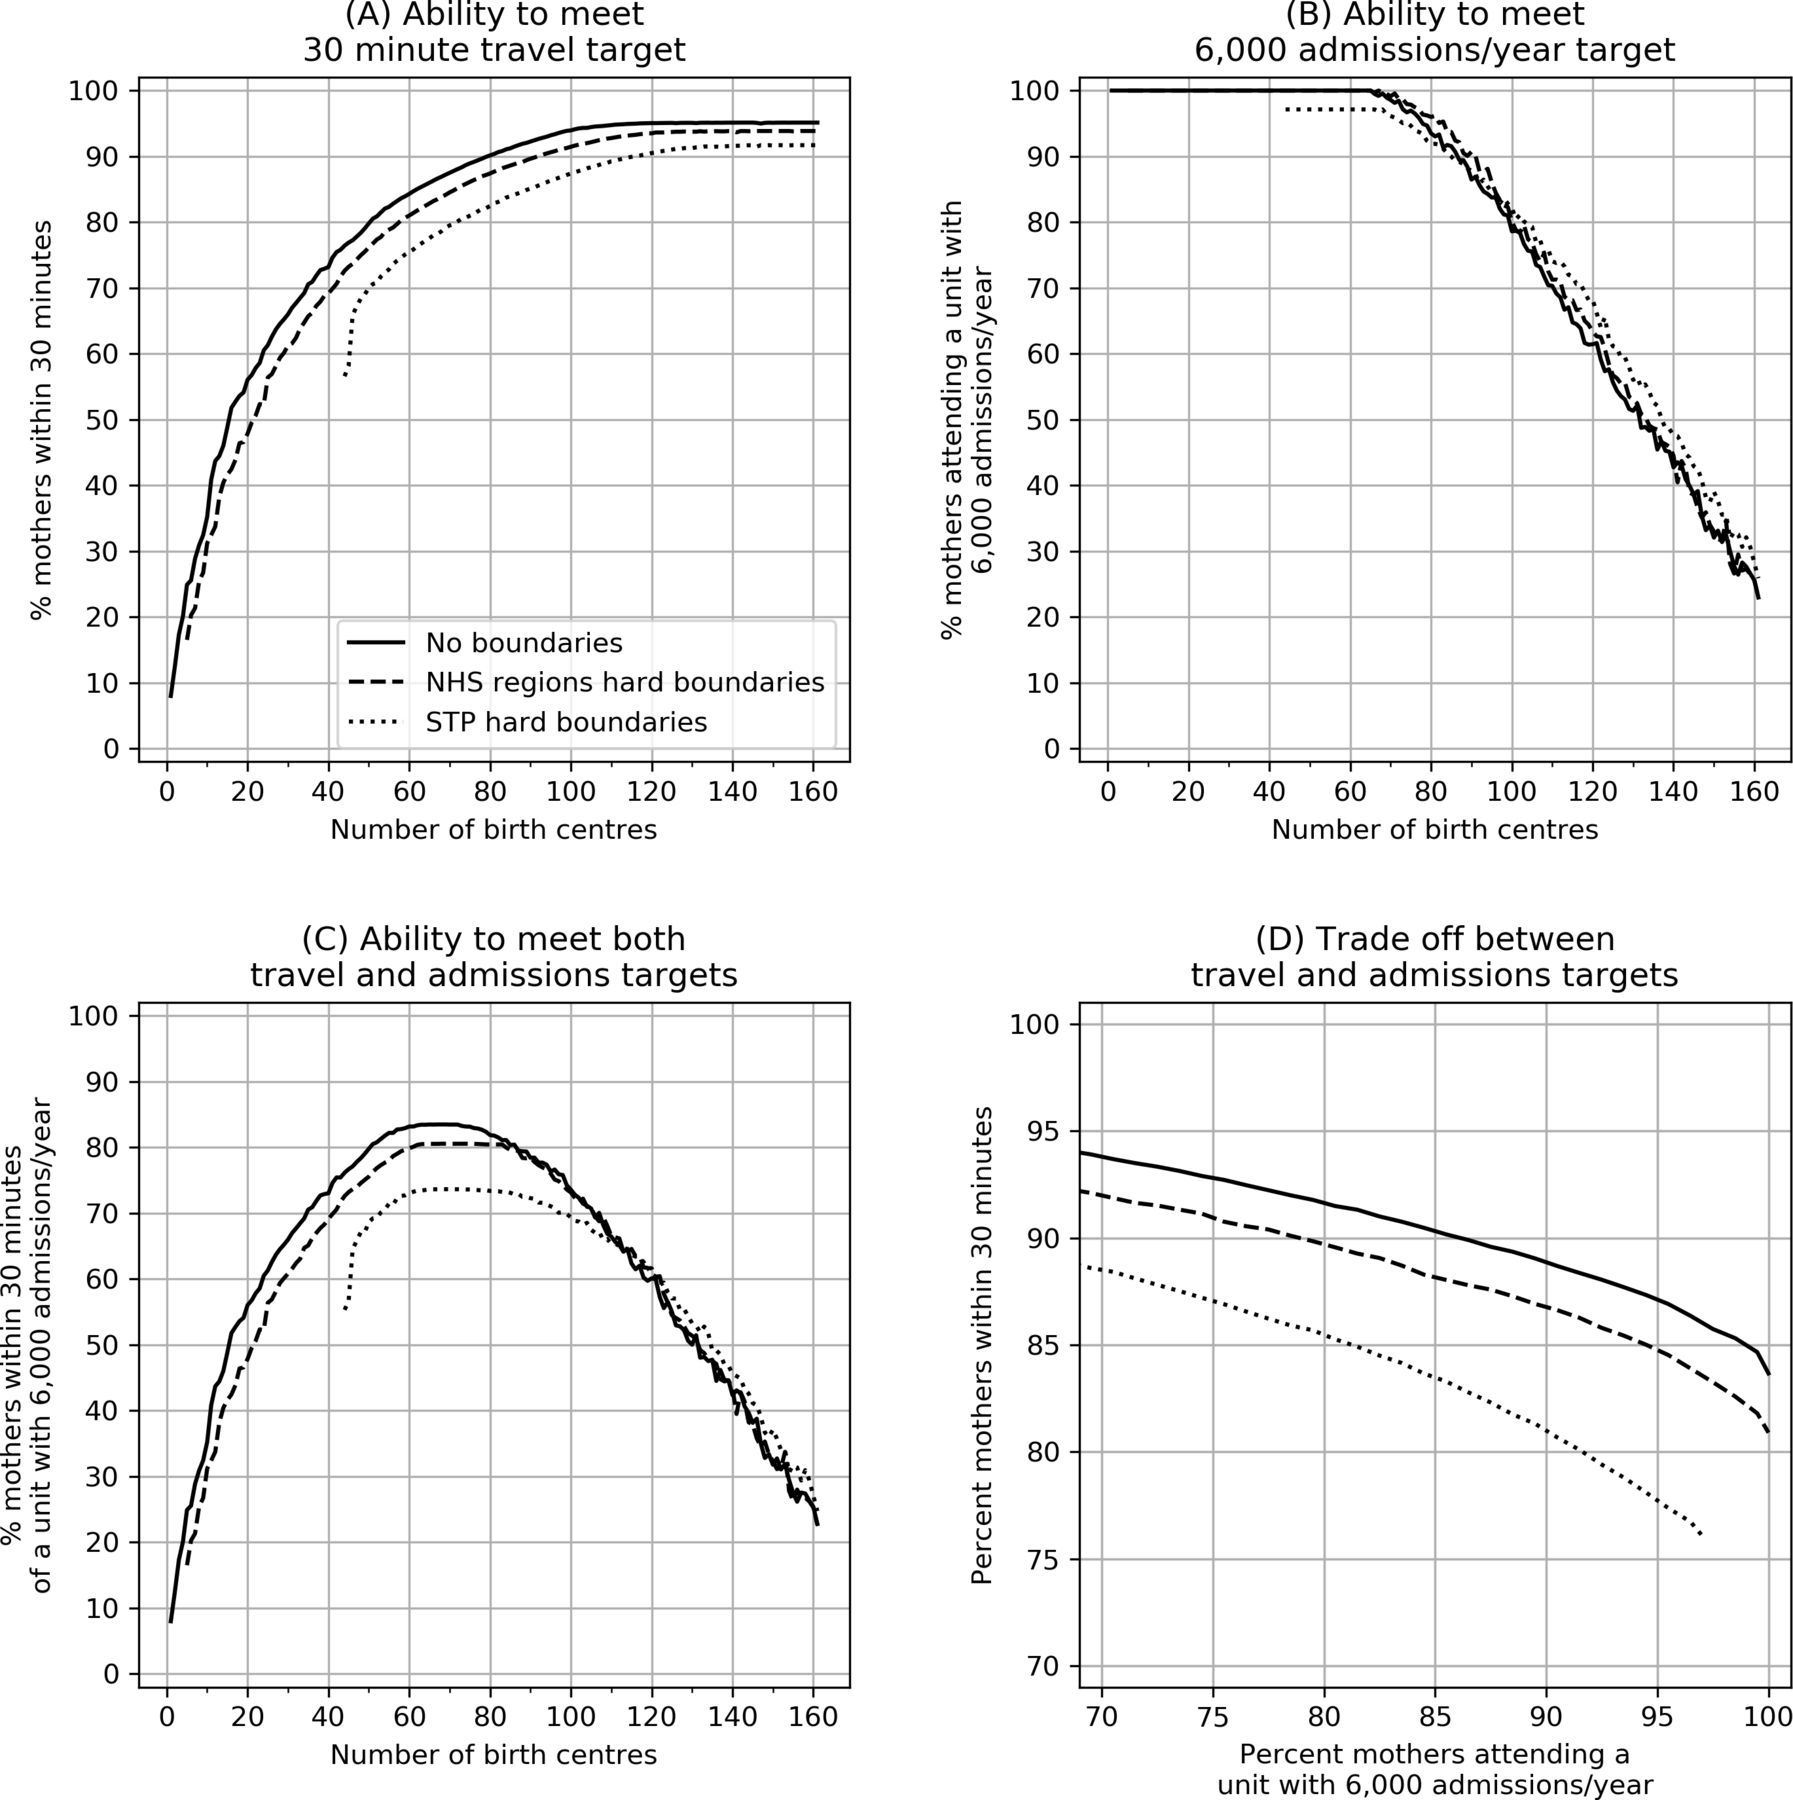
Applying STP or NHS Regional boundaries leads to a reduced proportion of patients within 30 min of their closest birth centre, with a more marked effect when applying STP rather than NHS Region boundaries (figure 3).
The effect of changing the number of birth centres and the planning footprint size on (A) the ability to provide 30 min access to a birth centre, (B) the ability to meet a 6000 admissions/year target, (C) the ability to meet both 30 min access and 6000 admissions/year target and D) the best achievable compromise (Pareto front) between 30 min access and 6000 admissions targets. In all plots the solid line represents no boundaries, the dashed line restricts patients to NHS region boundaries, and the dotted line restrict patients to STP boundaries. NHS, National Health Service; STP, sustainability and transformation partnership.
If STP boundaries are applied, it is not possible for all birth centres to have at least 6000 births per year as the smallest STP has only about 3000 admissions per year. The largest proportion of patients within 30 min of birth centres with at least 6000 admissions per year depends on the boarders used to plan and provide the service, with 83%, 80% and 74% of mothers being within 30 min when no boundaries, NHS regional boundaries or STP boundaries are applied.
The proportion of mothers within 30 min and the proportion of mothers attending a birth centre with the recommended number of admissions may be traded off against each other. To achieve 85% of admissions in large birth centres, the maximum proportion of admissions within 30 min would be 89%, 87% and 83% for services planned and provided without boundaries, with NHS regional boundaries and with STP boundaries.
Discussion
Currently, we estimate that 95% of mothers are within 30 min of a birth centre with at least a neonatal special care unit, but only 17% of mothers currently attend a birth centre with at least 6000 admissions per year (the target size, from the RCOG that could provide continuous consultant-led care). Consolidation of birth centres will increase travel times for some mothers, but increase the proportion of mothers attending a birth centre that could implement consultant-led care. Planning at small region size (such as STPs) reduces the ability to combine the dual targets of care close to home, and care in birth centre that could implement continuous consultant-led care.
Providing the lowest travel time to acute hospital services requires a large number of hospitals. Providing continuous consultant presence means limiting the number of providers given financial and staffing constraints. The travel time and size of the birth centre require careful consideration to optimise these competing objectives.
Planning of childbirth services is complicated by the mixed provision of obstetric and midwifery led birth centres. However, obstetric or alongside midwifery led birth centres (in the same site as an obstetric-led birth centre) account for 95% of all births. The large majority of births in England (87%) take place in obstetric birth centres, with 11% in midwifery-led birth centres and 2.4% at home.9 Of those in midwifery-led birth centres, 2% occur in free-standing midwifery-led birth centres.10 In this study, we have focused on hospital-based births in obstetric or alongside midwifery led birth centres.
A target of 6000 births per year has been suggested by the RCOG in order to sustain continuous consultant presence, noting that 24 hours consultant presence on the delivery suite leads to better decision making.11 An additional advantage of attending a larger birth centre is that higher level neonatal care is more likely to be immediately available without transfer.
Currently, few births occur in birth centres large enough to meet the minimum admissions recommended to enable birth centres to provide continuous consultant-led services. To achieve more births in birth centres with at least 6000 births per year requires an increase in the centralisation of service provision. The disadvantage of increasing the number of women attending a larger birth centre is that it will increase the travel distance for some mothers and will increase the size of the largest birth centres. Modelling suggests that it is possible to significantly increase the proportion of births in these larger birth centres with a minor effect on access times, and while controlling the size of the largest necessary birth centre (though an alternative strategy for large admission numbers could be to divide a very large birth centre into two birth centres still with 6000 admissions per year each). It is probably infeasible, or at least undesirable, to aim for all births in these larger birth centres, but a significant increase from the current 17% appears feasible.
There is conflicting evidence on the link between travel time and obstetric outcome. Logically one would expect that an increase in travel time would be associated with worse infant outcomes although their infrequent occurrence could hide an effect. There was no strong evidence of a link between travel time and outcome in a study of very low birthweight infants12 or in a study of 3 million live births in France.13 Nevertheless, data from the Netherlands suggests that mortality is correlated with the travel time from home. Estimated car travel times of over 20 min were associated with increased neonatal mortality and adverse outcomes (adjusted OR for mortality per minute increase of travel time was 1.01).14 Although the authors adjusted for confounding variables, the results could be explained by variables other than travel time. Likewise in a study of 413 000 singleton births in Wales (1995–2009) there was a correlation between travel time and neonatal death.15 The correlation remained after allowance for various confounding variables (such as gestational age and social deprivation index), though the authors did not have information on type of onset of labour, or medical or surgical conditions affecting the mother or infant. This study also looked at travel time to the closest birth centre as opposed to the birth centre that the woman was actually taken to. They did not find any association between distance to closest birth centre with mortality, suggesting that the association between travel time and outcome may not be causal, but that the higher neonatal deaths with longer travel times may reflect women with high risk pregnancies not attending their closest birth centre, but travelling further to a tertiary birth centre. Their overall conclusion was that there was no strong evidence of association of mortality with the geographical location of maternity services.
As travel time increases, there is a risk of birth occurring before arrival at hospital, which is undesirable regardless of whether there is a significant effect on outcome. In France, the rate of out-of-hospital birth for mothers living more than 30 km from their nearest birth centre was double those living within 30 km.16 Among primiparas, rates increased from 2.3 per 1000 under 5 km to 7.5 per 1000 for 45 km or more. The rates were 5.4 and 26.2 per 1000, respectively, for women with a parity four or more. While rare, there was an increase in neonatal deaths related to out-of-hospital birth (4.0 per 100 000 births for distances of up to 14 km and 10 per 100 000 for distances of 45 km or more). Nevertheless death following out-of-hospital birth accounts for fewer than 2% of all neonatal deaths.13
As there are no guidelines on targets for distance to birth centres in the UK, we examined a range of measures of access. These include mean, 95th percentile and maximum travel times, and the proportion of mothers within 30 min. Using any of these indicators, there was little improvement in access once the number of birth centres reached about 100.
The ability to combine the best access times and the highest proportion of births in larger birth centres is also dependent on the planning and provision footprint. When using a small planning footprint, such as STP, there will be higher travel times for some women, as they may be allocated to a hospital within their own STP region when there is a closer hospital in a neighbouring region. Minimising travel times, while maximising the proportion of women attending larger birth centres is therefore best done using planning footprints larger than STP level. The ability to plan well at STP is also hindered by the large variation in the number of admissions per STP (one STP currently has fewer than 6000 births across the whole region). Optimising service delivery will be more difficult for smaller STPs.
Our model overestimates the proportion of mothers attending a birth centre with at least 6000 births per year (23% birth centres in model compared with 17% in HES data). This difference is likely to be due to simplified model assumptions (see the ‘Limitations of study’ section), such as the model assuming all mothers attend their closest birth centre.
In this paper, we focused on childbirth care in England. The principles and methodology should be directly applicable to many other countries. Key principles are (1) to use a methodology that explores the range of compromises between time to access services, and the ability of those services to sustain continuous care, and (2) understand how regionalisation of planning may compromise performance of the system. We have made our methodology publicly available to that it may be used or adapted by others.
Limitations of study
We do not consider, in this paper, all the varied advantages and disadvantages of large versus small birth centres. Rather we simply model the effect of consolidation on birth centres size and travel times for mothers.
We have focused on England, and the RCOG suggestion of consolidation in order to maximise constant-led care. This may not reflect the views and priorities in other countries.
For modelling, we assume mothers will attend their closest birth centre. In reality, where more than one birth centre is within reasonable travel time, mothers may choose a birth centre that is not their closest.
Genetic algorithms hunt down ‘good’ solutions, but without guarantee that there are not better solutions to be found.
Decision-making boundaries and bodies are in a continuous state of flux in healthcare. Specific modelling of NHS regions and STPs will rapidly become outdated. The emphasis should therefore be more on the general effect that smaller planning footprints reduce the ability to achieve multiple objectives of birth centre size and travel times.
Our analysis presented here assumes travel by car, and assumes easy access (eg, parking) in the hospital. Feedback during PPI suggested that detailed local planning should also consider public transport (especially for long in-patient stays where family may be travelling to visit, and where use of taxis would not be economically sustainable for those without cars).
Our analysis is based on usual road conditions, as predicted by the geographical information system, and does not take into account periods of congestion.
This study takes a focused view on birth centre size and travel times. It does not take into account the complex local pressures and reasons for preferring one birth centre over another at the cost of birth centre size or travel times.
Conclusions
Currently, 17% of women attend a birth centre with at least 6000 admissions per year. The 95th percentile travel time is 30 min. As birth centres are consolidated, the proportion of mothers attending a large birth centre increases, but the travel times for some women increase. As an example, with 100 birth centres, 75% of care in birth centres with at least 6000 admissions per year, with a 95th percentile travel time of 35 min. Planning and care delivery at local (STP) level leads to compromised solutions with poorer travel times.
While it seems unrealistic to have all births in birth centres with at least 6000 admissions per year, it appears reasonable to increase the proportion of mothers attending this type of birth centre from 17% to at least 50% while maintaining good access. Planning and care delivery should be performed at footprints larger than STP, perhaps ideally at NHS Region level.
Footnotes
Twitter @DevonMichael66
Contributors MA conceived the study and performed later programming. EV programmed the initial algorithms. ST provided clinical oversight and helped shape the study and algorithm objectives. MP was principal investigator with overall project oversight. MA wrote the first version of the paper, and all contributed to editing of the paper.
Funding This study was funded by the National Institute for Health Research (NIHR) Applied Research Collaboration (ARC) South West Peninsula, and the NIHR Health Service and Delivery Programme.
Disclaimer The views and opinions expressed in this paper are those of the authors, and not necessarily those of the NHS, the National Institute for Health Research, or the Department of Health.
Map disclaimer The depiction of boundaries on this map does not imply the expression of any opinion whatsoever on the part of BMJ (or any member of its group) concerning the legal status of any country, territory, jurisdiction or area or of its authorities. This map is provided without any warranty of any kind, either express or implied.
Competing interests None declared.
Patient and public involvement Patients and/or the public were involved in the design, or conduct, or reporting, or dissemination plans of this research. Refer to the Methods section for further details.
Patient consent for publication Not required.
Ethics approval This study used only aggregate admission counts by geographical area. No ethical approval was required.
Provenance and peer review Not commissioned; externally peer reviewed.
Data availability statement Data are available in a public, open access repository. Data and code used in this study are available at: https://github.com/MichaelAllen1966/1901_birth_centre_location.
Author note The lead author (Michael Allen) confirms that the manuscript is an honest, accurate, and transparent account of the study being reported; that no important aspects of the study have been omitted.