Article Text

Abstract
Objective Practice arrangements in physician offices were characterised by examining the share of visits that involved physician assistants (PAs) and nurse practitioners (NPs). The hypothesis was that collaborative practice (ie, care delivered by a dyad of physician-PA and/or physician-NP) was increasing.
Design Temporal ecological study.
Setting Non-federal physician offices.
Participants Patient visits to a physician, PA or NP, spanning years 2007–2016.
Methods A stratified random sample of visits to office-based physicians was pooled through the National Ambulatory Medical Care Survey public use linkage file. Among 317 674 visits to physicians, PAs or NPs, solo and collaborative practices were described and compared over two timespans of 2007–2011 and 2012–2016. Weighted patient visits were aggregated in bivariate analyses to achieve nationally representative estimates. Survey statistics assessed patient demographic characteristics, reason for visit and visit specialty by provider type.
Results Within years 2007–2011 and 2012–2016, there were 4.4 billion and 4.1 billion physician office visits (POVs), respectively. Comparing the two timespans, the rate of POVs with a solo PA (0.43% vs 0.21%) or NP (0.31% vs 0.17%) decreased. Rate of POVs with a collaborative physician-PA increased non-significantly. Rate of POVs with a collaborative physician-NP (0.49% vs 0.97%, p<0.01) increased. Overall, collaborative practice, in particular physician-NP, has increased in recent years (p<0.01), while visits handled by a solo PA or NP decreased (p<0.01). In models adjusted for patient age and chronic conditions, the odds of collaborative practice in years 2012–2016 compared with years 2007–2011 was 35% higher (95% CI 1.01 to 1.79). Furthermore, in 2012–2016, NPs provided more independent primary care, and PAs provided more independent care in a non-primary care medical specialty. Preventive visits declined among all providers.
Conclusions In non-federal physician offices, collaborative care with a physician-PA or physician-NP appears to be a growing part of office-based healthcare delivery.
- health policy
- primary care
- organisation of health services
- health services administration & management
This is an open access article distributed in accordance with the Creative Commons Attribution Non Commercial (CC BY-NC 4.0) license, which permits others to distribute, remix, adapt, build upon this work non-commercially, and license their derivative works on different terms, provided the original work is properly cited, appropriate credit is given, any changes made indicated, and the use is non-commercial. See: http://creativecommons.org/licenses/by-nc/4.0/.
Statistics from Altmetric.com
Strengths and limitations of this study
National Ambulatory Medical Care Survey (NAMCS) is the leading source of nationally representative data on care delivered in physician offices and ongoing since 1973.
The data were confined to non-federal physician office visits attended by physicians, physician assistants (PAs) or nurse practitioners (NPs).
Results excluded PAs or NPs with independent practices.
Due to office-based physicians who do not employ PAs or NPs, findings are subject to underestimation of the role of these providers.
Expanding the NAMCS sampling units can enrich the reliability of the utilisation of PAs and NPs in American medicine.
Introduction
Patient needs in healthcare are changing as a result of shifts in demographics and disease characteristics.1–3 For instance, the proportion of the US population over 65 years is increasing, such that by 2050, older adults are projected to make up at least 35% of the total population.4 Likewise, by the second decade of this century, the occurrence of obesity and diabetes had reached epidemic proportions.5 6 Aside from the interaction of demographic shifts and the increased burden of disease, the Patient Protection and Affordable Care Act (ACA) expansion of health insurance benefits to an estimated 20 million, mainly low-income Americans, have created more demand for medical services without a concomitant growth in physician services.
The Association of American Medical Colleges predicts a national shortage of 46 000–90 400 physicians by 2025. If this prediction is realised, then the physician workforce pipeline will be inadequate to meet the growing demand.7 Expanding roles of physician assistants (PAs), nurse practitioners (NPs) and certified nurse midwives (CNMs), as a solution to physician shortages has been discussed.8 9 This innovative use of health professionals has not gone unnoticed and their utilisation has grown nationwide. In 2013, the Bureau of Labor Statistics (BLS) estimated that there were 50 510 PAs and 52 860 NPs. By 2018, the estimates on the number of clinically active physicians and surgeons was at 713 800, NPs at 155 500, and PAs at 106 200, with growth projections from 2016 to 2026 at 13%, 36% and 37%, respectively.10 11 During this same 10-year period, the US population is expected to grow from 320 to 346 million, further increasing the need to expand the roles of the medical provider workforce.12
Medical care delivered by physicians, PAs and NPs takes place in many locations, including (but not limited to) physician offices, clinics, hospitals, community health centres and rehabilitation facilities. However, it is physician office visits (POVs) that form the bulwark of ambulatory care in America.13 And it is in the office setting where PA and NP employment not only began, but has grown well into this century.14 15 After five decades of utilisation and deployment of PAs and NPs, it is possible that how this care is operationalised in physician offices has changed.
To address this question of organisational change in outpatient medicine, we turned to the largest and longest running survey of ambulatory care in the USA, the National Ambulatory Medical Care Survey (NAMCS). Our intent was to describe trends in use of PAs or NPs for improved modelling of healthcare delivery. More specifically, we wanted to examine trends in POVs by type of provider, as well as collaborative visits between providers. There are a number of reasons for this. Consolidation of physician offices has been a trend since the new century16; and health insurance policy has evolved in the USA during this same period. Concurrently, the utilisation of PAs and NPs has increased. What began primarily as a dependent relationship with physicians, the employment of PAs and NPs has evolved into a collaborative one instead. Our objective was to build on the previous work in documentation of this shift in the provision of care in POVs,9 17–19 by investigating whether significant changes in collaborative practice arrangements are observable over time. Collaboration between a PA or NP and physician is of interest, as there is some evidence that team-based care is growing.9
Methods
Study design, data source and setting
A temporal ecological study was undertaken that compared POVs’ characteristics across three provider types (physicians, PAs and NPs) solo or team-based practice in years 2007–2011 and 2012–2016. The dataset was NAMCS which draws annually on independent samples of physician practices. NAMCS is conducted by the National Center for Health Statistics (NCHS), a component of the Centers for Disease Control and Prevention, under the Department of Health and Human Services. The NAMCS data collection methods have been described in detail.9 20–22 Briefly, the NAMCS is a voluntary probability sample survey of patient visits to non-federal, office-based physicians and surgeons (group or solo practice). Sampled physicians are selected from the American Medical Association and the American Osteopathic Association master files.9 For the objective of this study, that is, assessing trends in collaborative practice in physician offices, we used documentation on the provider type which is captured in the NAMCS Survey Instrument ‘Patient Record Form’. Data obtained prior to 2006 differs with the current versions in that all providers in an encounter are systematically collected.23 As a consequence, we limit our data to 2007–2016, the publicly available data at the time of the study. As the NAMCS data excludes PAs or NPs with independent patient daily rosters and those with independent practices, and it includes office-based physicians who do not employ PAs or NPs, our findings are subject to underestimation.9 However, as there is not a reason to assume that estimation accuracy varies differentially over time, time trends in provider practice, and specifically collaborative practice, should accurately reflect changes in care delivery within US POVs and are the focus of our analysis.
Data abstraction and participants
The NAMCS is based on a sample of visits rather than a sample of people.24 According to the NCHS guideline, survey years with the same Patient Record Form (survey instrument) can be combined.24 In view of the underestimated visits with PAs or NPs, and to ensure we had an adequate sample to assess trends in team-based practice, the NAMCS public use linkage was downloaded to create a pooled analysis of 10 years (2007–2016). Online supplementary figure 1 summarises the data filtering process. In this investigation, the 2007–2016 years data were concatenated. Medical providers seen at POVs include visits to physicians, PAs and NPs, but may include other providers (eg, mental health provider, registered nurse/licensed practical nurse or other visits without a provider).23 The data were restricted to the visits with at least a physician or PA or NP seen (irrespective of other providers). Thus, we excluded a small portion (1.6%) of visits not attended by at least one of these three provider types. This analysis is centred on visits to the main sampled setting, that is, POVs, both solo and group practices (86.2%). Additionally, as year to year changes in the sampling frame might introduce an inordinate amount of variability, whereas a longer-term average would be the more robust way to report the results, the pooled data were divided to two 5-year timespans of 2007–2011 and 2012–2016.
Supplemental material
Measures of interest
Provider types were medical doctors (MDs)/doctors of osteopathy, PAs, NPs and CNMs. CNMs and NPs were collapsed to NPs consistent with NCHS protocol, as the number and percentages of CNMs in POVs are considered too small to be calculated separately.9 Provider visits were categorised as:
Solo physician (a physician, without a PA or NP), irrespective of other providers.
Solo PA (a PA, without a physician or an NP), irrespective of other providers.
Solo NP (an NP, without a physician or a PA), irrespective of other providers).
A ‘collaborative practice’ (or dyad) to mean two different professions (physician-PA or physician-NP) involved in the provision of care during a patient visit, irrespective of other providers.25 Other collaborations included a triad of a physician, NP and PA, or a dyad of NP and PA.
We explored whether collaborative practice differed by patient demographic characteristics, reason for visit and visit specialty. Patient characteristics included age (categorised as <15, 15–24, 25–44, 45–64, 65–74 and 75+ years), gender, race, and ethnicity (categorised as white, black and other; and Hispanic/Latino and non-Hispanic/Latino, respectively). Reason for visit were four groups: acute, chronic (ie, routine or flare-up), presurgery/postsurgery and preventive care. Type of visit specialty were primary care, medical specialty and surgical specialty. NAMCS excludes physicians in the specialties of anaesthesiology, pathology and radiology, and their designated subspecialties.9
Statistical analysis
To account for the complex survey design, we included strata and cluster, as well as applied patient visit weights to all analyses to achieve nationally representative estimates and confidence intervals. Patient demographic characteristics, reason for visit and visit specialty by provider type were stratified for subgroup analyses and comparisons within the two 5-year timespans. χ2 test was used to compare parameter estimates over time. To assess the probability of collaborative work we adjusted for the covariates of patient age, number of chronic conditions and their interaction. The a priori alpha value was set at 0.05. Findings are generalisable to physician offices across the USA. All statistical analyses were performed using SAS software V.9.4 (SAS Institute Inc., Cary, NC, USA).
Patient and public involvement
Patients or the public were not involved in the design, or conduct, or reporting, or dissemination plans of our research.
Results
There were an estimated 8.5 billion patient visits to physician offices between 2007 and 2016 (10 years). Two time periods were examined: time 1 (2007–2011) produced 4.4 billion POVs (51.3% of the total); time 2 (2012–2016) produced 4.1 billion POVs (48.7%) (online supplementary figure 1). In both timespans, solo physicians had the highest proportion of visits, followed by physician-PA, physician-NP, solo-PA, solo-NP and other collaborations (p<0.01). However, despite this similarity, the unadjusted proportion of visits per provider differed significantly between these two timespans (p<0.01) (online supplementary table 1).
Supplemental material
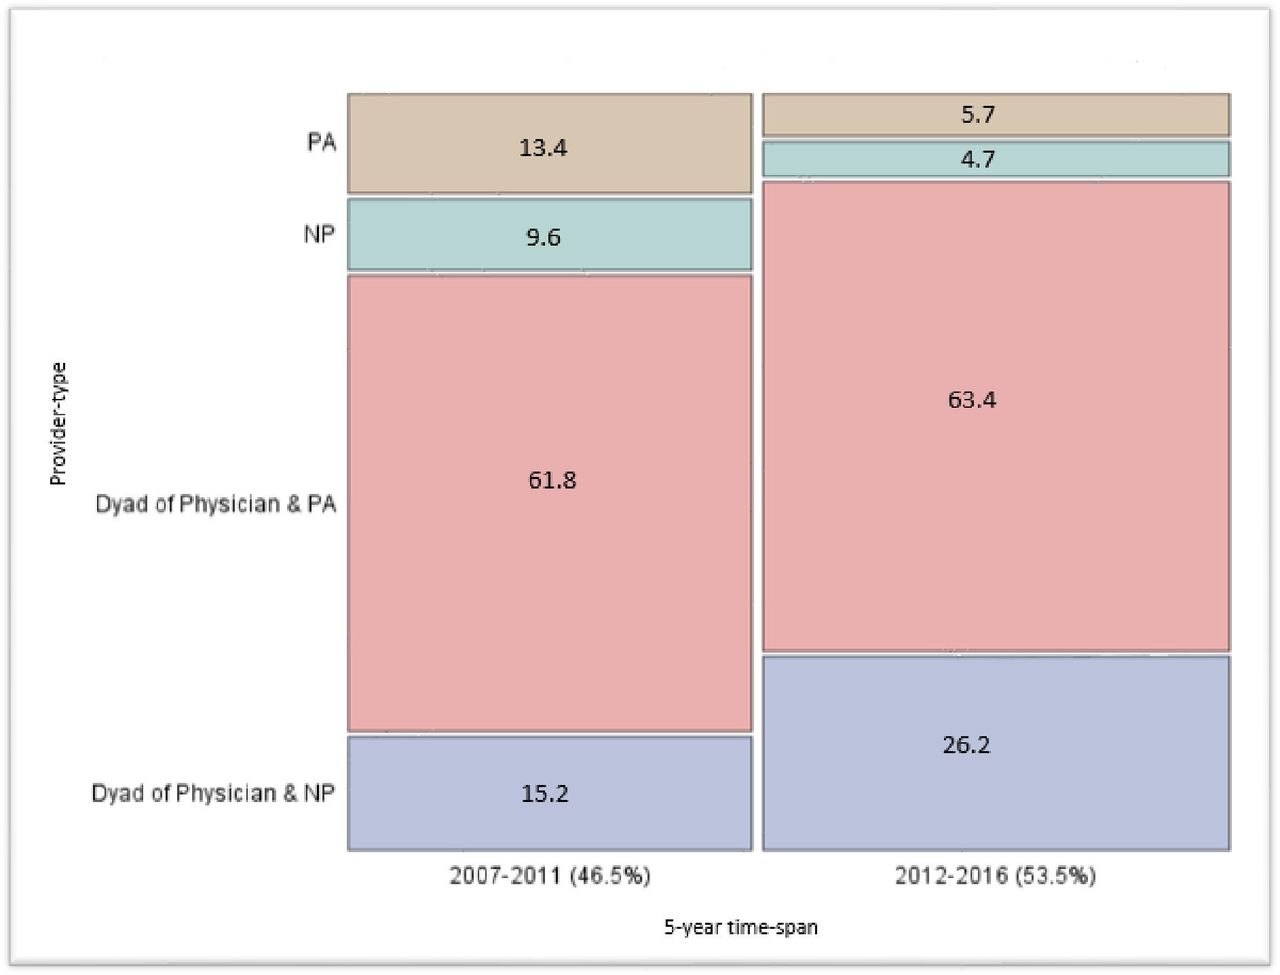
Figure 1 shows the unadjusted proportion of POVs provided by each provider type (solo or dyad, excluding solo physician) across the two 5-year intervals. Comparing the two timespans, the absolute rate of POVs with a solo PA (0.43% vs 0.21%, p<0.01) or NP (0.31% vs 0.17%, p<0.01) decreased. Likewise, the rate of POVs with a collaborative physician-PA (1.98% vs 2.34%, p=0.46) increased non-significantly and the rate of POVs with a collaborative physician-NP (0.49% vs 0.97%, p<0.01) increased. Overall, this suggests that collaborative practice, in particular physician-NP, increased in recent years (2012–2016) (p<0.01), while visits handled by a solo-PA or solo-NP decreased (p<0.01) (figure 1). When adjusted for patient age, number of chronic conditions and their interaction, the probability of collaborative practice in years 2012–2016 compared with years 2007–2011 was significantly higher, (OR 1.35, 95% CI 1.01 to 1.79).

Percent distribution of non-physician providers weighted visits to physician offices by two 5-year timespans (NAMCS). NAMCS, National Ambulatory Medical Care Survey; NP, nurse practitioner; PA, physician assistant.
Spanning the 10-year period of observation the percent of PAs and/or NPs at a POV increased (p=0.05). The highest annual percentage of POVs with PA or NP solo or collaborative work was seen in 2015 (10.5%, 95% CI 6.2% to 14.7%) and the lowest in 2007 (5.5%, 95% CI 3.7% to 7.3%) and 2016 (5.6%, 95% CI 3.1% to 8.1%) (figure 2). When we adjust for POV patient age and number of chronic conditions, the probability of higher visits with a PA or NP, with or without an MD is insignificant (OR 1.03, 95% CI 0.99 to 1.06). A slight decrease in solo physician visits was also seen in recent years (p=0.17) (online supplementary table 1).

Temporal trend of percent of PAs and/or NPs present at a physician office visit: NAMCS 2007–2016. NAMCS, National Ambulatory Medical Care Survey; NP, nurse practitioner; PA, physician assistant.
Patient characteristics
Number of chronic conditions
The mean number of patient chronic conditions in time 2 compared with time 1 was significantly higher, (OR 1.28 (95% CI 1.23 to 1.32) vs 1.16 (95% CI 1.11 to 1.21)).
The demographics for patients by provider type within the two timespans are presented in table 1A,B (time 1) and (time 2), respectively.
Patients’ demographic characteristics, stratified by provider type, NAMCS 2007–2011
Patients’ demographic characteristics, stratified by provider type, NAMCS 2012–2016
Sex
Overall, irrespective of provider, there was no significant difference in sex distribution of patients (p=0.86); women had almost 1.4 times more visits than men across the 10-year period (58.3% female patient visits vs 41.7% male patient visits). Within years 2007–2011, sex of patient significantly differed by provider type (p=0.01). Within years 2012–2016, no difference in sex of patient by provider type was seen (p=0.36).
Race and ethnicity
No significant differences by patient race were observed between the two timespans (p=0.40). When stratified by provider type, compared with the years 2007–2011, patient race for solo NP was significantly different in the years 2012–2016, with the most increase seen in visits of patients of other races (non-white, non-black) and decrease in visits of black and white patients (p=0.01). For the physician-PA visits, there was a significant change in the race pattern between the years of 2007–2011 and 2012–2016. The most dramatic increases were seen in visits of patients of other races (non-white, non-black) and decrease in visits of white and black patients. In total, no significant changes were seen across the two time periods by ethnicity (p=0.10). However, when stratifying by timespans and provider type, for the physician-PA visits there was a significant increase in proportion of Hispanic patients seen between the years of 2007–2011 and 2012–2016 (from 12.1% to 23.8%, p<0.01).
Age
The mean age of patients significantly differed between time 1 and time 2 (p<0.01). Overall, the number of visits by older patients (≥45) increased (from 56.4% in time 1 to 59.6% in time 2). Within years 2007–2011, compared with physicians, PAs and NPs were visited more by patients <45 years old; PAs (56.3%), NPs (60.2%), physicians (43.5%) (p<0.01). Within years 2012–2016, compared with physicians, NPs had more patients <45 years (55.3% vs 40.4%, p=0.02), while within the same timespan, PA visits of patients <45 years did not differ with physicians (40.3% vs 40.4%, p=0.99).
Major reason for visit
Overall, irrespective of provider type, reason for visit differed between years 2007–2011 and 2012–2016 (p<0.01). In essence, the proportion of acute and chronic visits increased (33.9% vs 36.9%) and (39.0% vs 45.9%), respectively. The proportion of visits for presurgery/postsurgery and preventive care decreased (7.0% vs 4.3%) and (20% vs 13.0%), respectively. These changes varied by provider type. For example, in the stratified data by provider type, within time 1, compared with time 2, solo PA visits for preventive care and acute problem decreased (21.3% vs 12.5%) and (40.3% vs 34.0%), respectively; while solo PA share of chronic problem increased drastically (31.0% vs 47.3%, p<0.01). A similar trend in proportion of acute and chronic problem, as well as preventive care visits was seen among physician-PA practice between time 1 and time 2 (p=0.04). The major reason for visits for solo NP and physician-NP over time showed less variability. Preventive visits declined among all providers (figure 3).
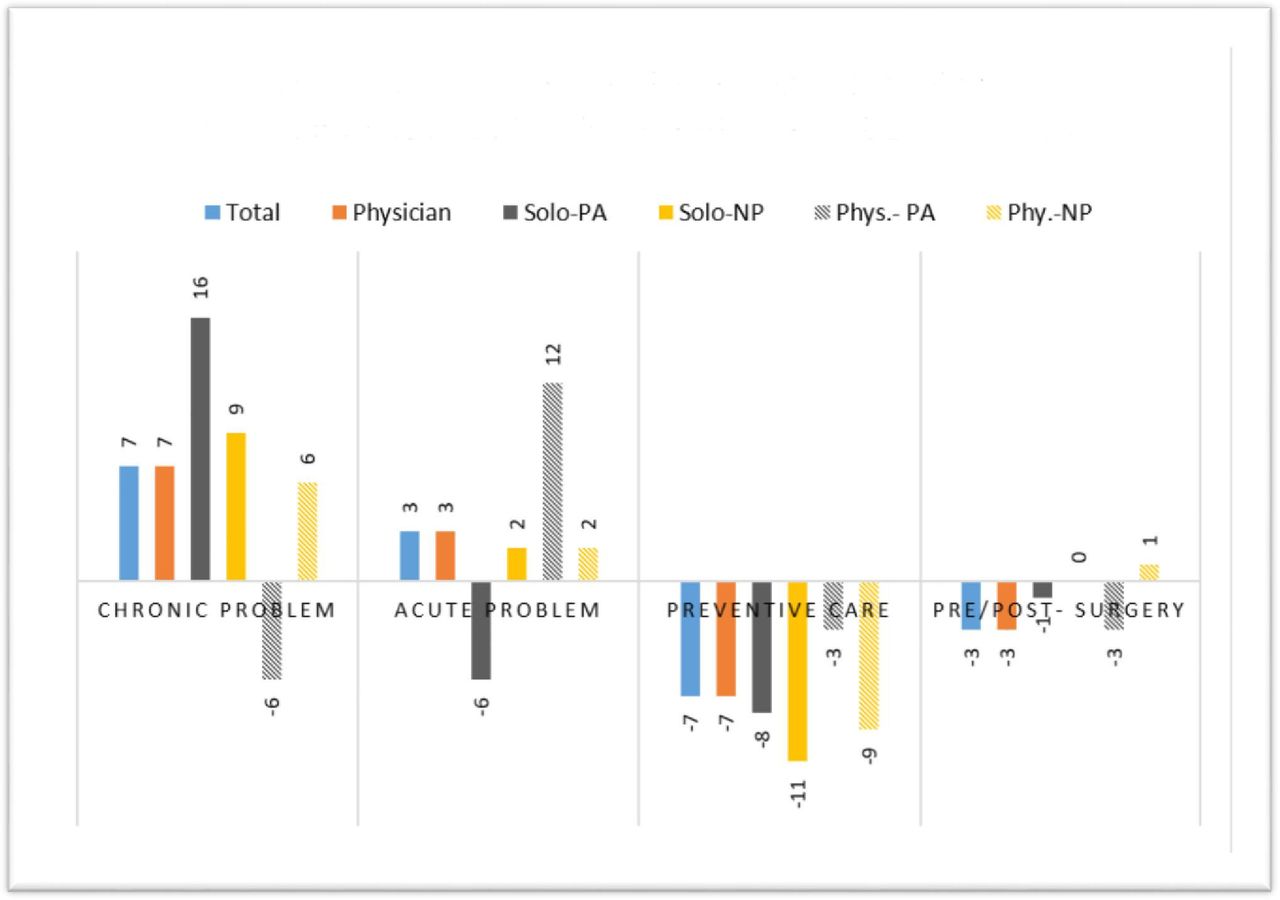
Percent change in major reason for visit between years 2007–2011 and 2012–2016, NAMCS 2007–2016. NAMCS, National Ambulatory Medical Care Survey; NP, nurse practitioner; PA, physician assistant.
Visit specialty
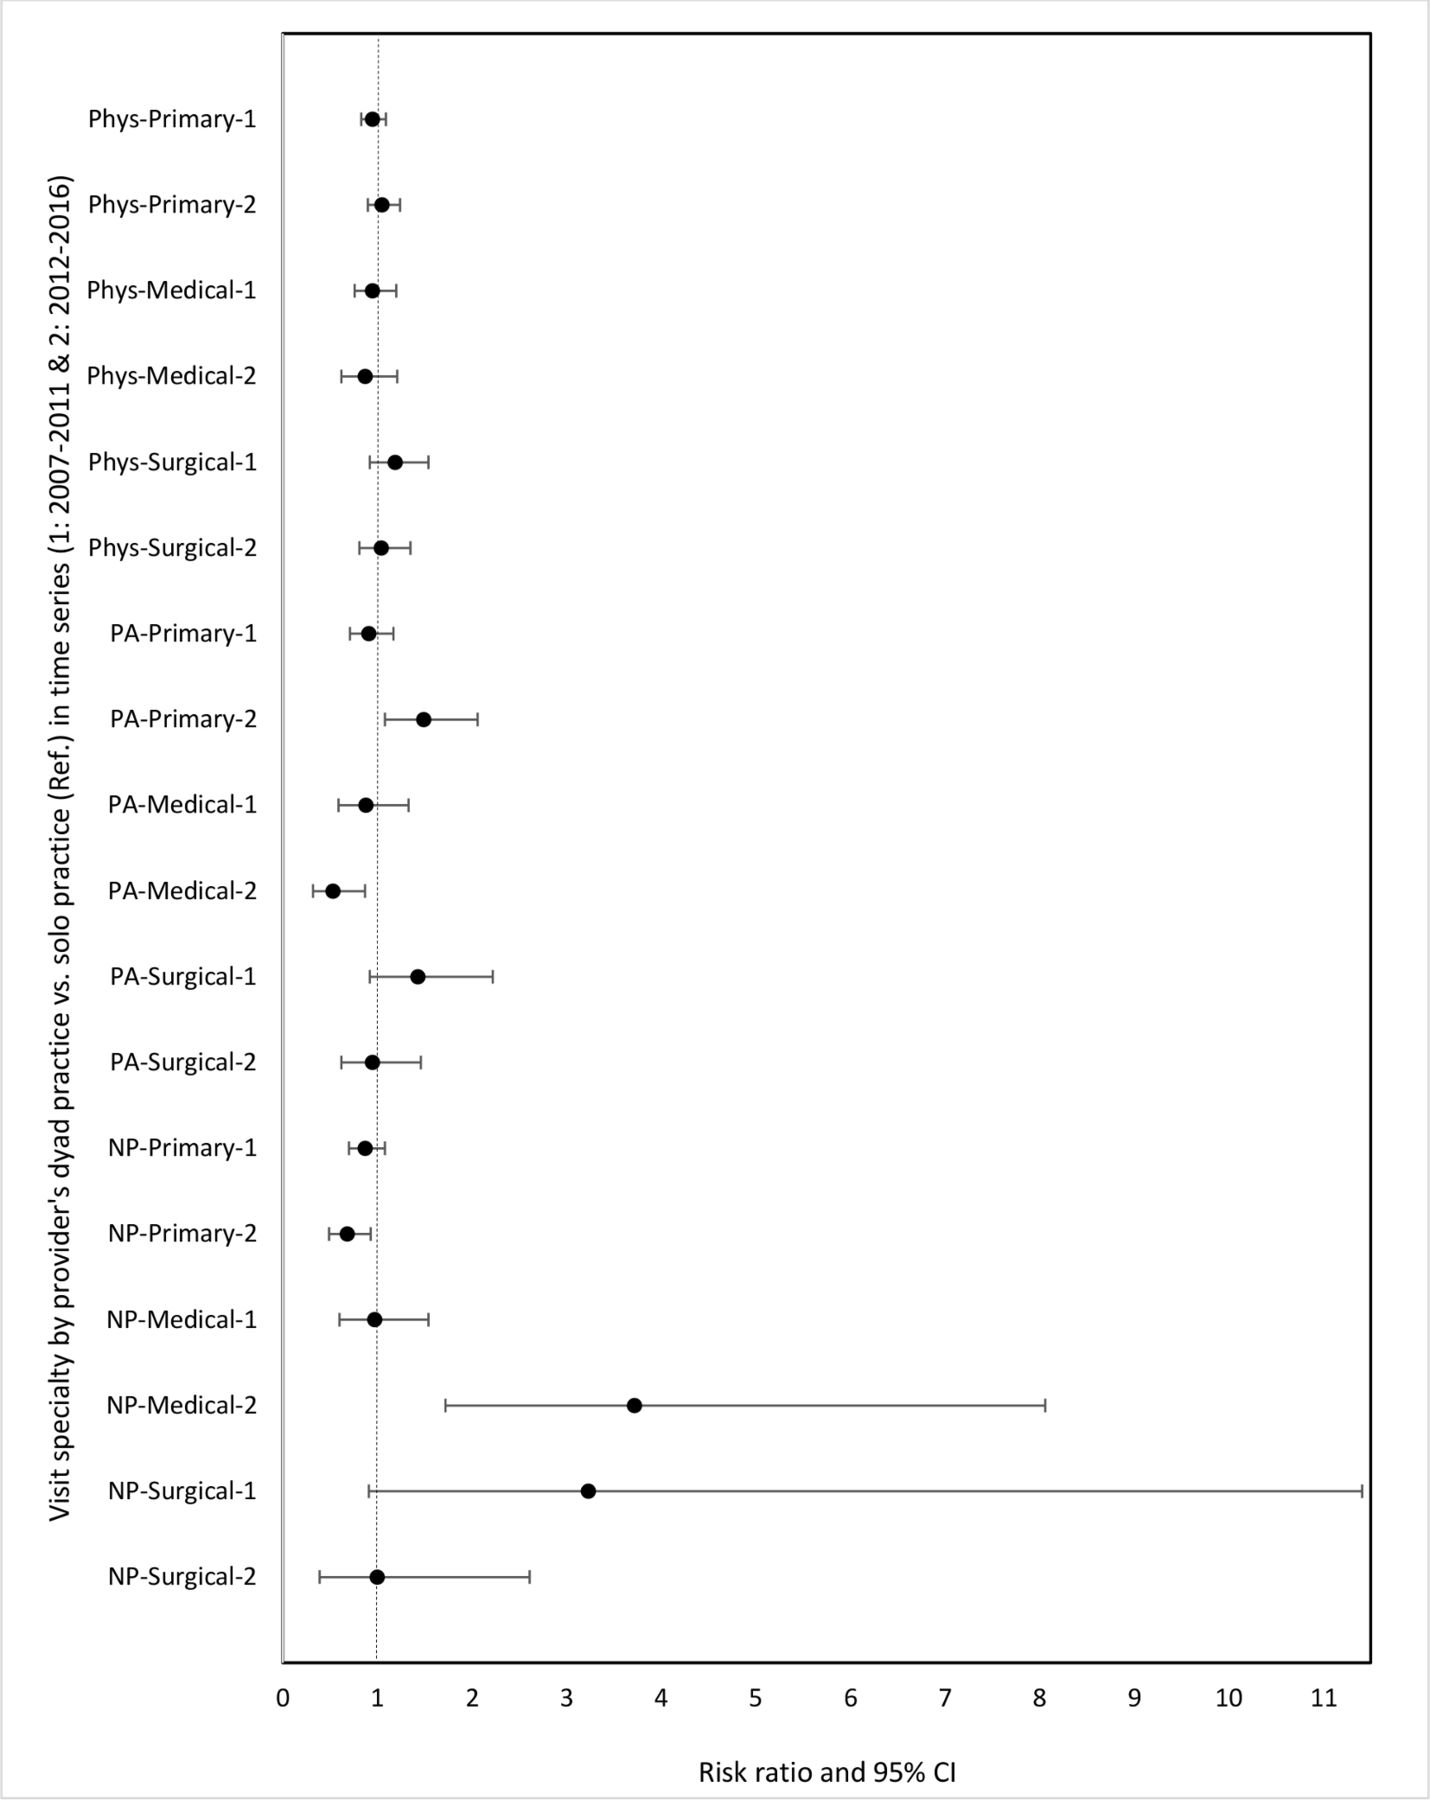
Regardless of provider type, the specialty of visits differed between the two time periods (p<0.01). Within recent years (2012–2016), proportionally less primary care visits occurred (52.7% vs 56.7%), and more visits with medical specialty (27.0% vs 22.7%) occurred. Surgical visits remained almost the same between these two timespans. Of note, solo PA visits had a significant change in specialty pattern—notably decreased visits with primary care specialty (37.6% vs 56.3%) and increased medical care and surgical care specialties (36.6% vs 25.0%), and (25.8% vs 18.7%), respectively. Figure 4 illustrates risk ratios of collaborative practice versus solo work (the reference group) per provider in each timespan independently, stratified by visit specialty (primary, medical and surgical). Within 2012–2016, PAs had a higher probability of having primary care visits in a dyad practice versus solo (RR 1.49, 95% CI 1.08 to 2.06), and less probability of a medical specialty visit in a dyad practice versus solo (RR 0.53, 95% CI 0.32 to 0.87). However, within same timespan, primary care visits were more likely as a solo NP (RR 0.68, 95% CI 0.49 to 0.93). For medical specialty care in 2012–2016, NPs had higher probability of working with a physician at a visit (RR 3.72, 95% CI 1.72 to 8.06).

Risk ratios for the association between specialty visit (primary, medical, surgical) and provider’s practice type ((dyad vs solo (Ref.)) in time series 1 (2007–2011) and 2 (2012–2016). NP, nurse practitioner; PA, physician assistant.
Discussion
The results of this analysis are consistent with other observations that collaborative practice has increased at physician offices in the USA.26 At the same time there have been fewer preventive and presurgical/postsurgical visits recorded at physician offices. Another important finding is the division of labour that seems to be occurring with American PAs and NPs. PAs are less represented in primary care and more in medical and surgical specialties than NPs. This shifting in roles and utilisation has been a US trend at least since 2000 and has been reported in a number of studies.27–29
The increased observation of PAs and NPs in POVs may be due to a number of reasons. For example, the ACA may have influenced the employment of PAs and NPs by physicians at a time when staffing expansion was needed. However, the market (demand) for PAs and NPs began decades before and has been increasing as healthcare service delivery has consolidated and the traditional ‘solo physician’ model is becoming an anachronism.16 Growth of PAs and NPs is underway. PAs graduated almost 10 000 and NPs graduated 22 000 in 2018.30 31
The interchangeability of PAs and NPs may be at work as well, since salaries are similar when roles are compared.32 33 Enabling PA and NP legislation by states also expanded during the study time frame, which may have facilitated greater utilisation.34 35
Changes in healthcare services, the patient population served by the PA, NP and physician workforce, or the growth of PA programmes all may partially explain our findings of increased collaborative practice over time. In terms of healthcare services, these changes have included consolidation of physician offices into medical centres, enlargement of hospitals, the emergence of retail clinics and outpatient surgery centres, and perhaps most germane to our current analysis, an increasing emphasis on team-based care.16 36 Additionally, the timing of our study, overlapping with the implementation and national roll-out of the ACA, also affords the possibility that this large-scale change in federal medical insurance policy may have impacted the growth of collaborative care. As a federal policy enactment, the ACA was supportive of PAs and advanced practice registered nurses (APRNs) and may have served as an accelerant for PA and NP programme growth.37 In terms of changes to the patient population, the increasing prevalence of chronic disease, coupled with an ageing population, produces increased complexity of care required, which may help explain some of the increased collaborative practice we observe in our study.38 Last, the increased growth in PA programmes, and the graduates they produce, may partially explain these findings. As of 2018 the BLS puts clinically employed PAs at 106 200 and NPs at 155 500.10 11 Their growth is projected from 2016 to 2026 at 36%, and 37%, respectively with physician growth somewhat lower at 13%.10 11 This forecast is predicated on increasing demand for healthcare services and decreasing annual physician productivity.39 40 The growing number of studies on the ability of PAs and NPs to manage complex patients with the same outcome as physicians is not only reassuring but informs a wide variety of health systems that their inclusion in team-based medicine may be in the patient’s best interest as much as the system’s best interest.41–44
Two additional theories that might explain the rise in the observed collaborative medical care services are economic and social. The economic explanation is that a visit with a PA or NP conjoined with a physician is reimbursed by Medicare at 100% of the prevailing community rate. The PA or NP that sees the patient as a sole provider is reimbursed for that visit at 85% of the prevailing rate.45 The policy stipulates that services must be rendered under the direct supervision of a physician, meaning the physician must be present in the office suite and immediately available.46 Since the median wage of a PA or NP is less than half that of a family physician, this 15% discount in federal reimbursement is considered negligible by some employers.27 Furthermore, reimbursement of PA and NP services occurs in full in the extensive private insurance system in the USA.
The social explanation is that consumers of medical services are more accepting of diverse types of providers as primary care undergoes changes in style and organisation.40 This opens more opportunities for physician practices as well as medical centres, clinics and other settings to employ PAs and APRNs.47 After a half century of PAs and NPs providing high-quality healthcare in the USA, they appear to be well integrated into collaborative relationships in physician office medicine.48 We also suggest this broad, 10-year observation, sets the stage for more granular investigation about physician-PA or NP collaboration, what it means, and where the margins of collaboration remain. There are suggestions that collaboration contributes to job satisfaction and may decrease burnout rates in family medicine.49–51 Ultimately, teasing apart the underlying reason for increased collaborative practice is difficult as the extant literature is largely silent on this topic.
With regard to the observed decrease in preventive care, we found the decline consistent with other Medicare visits since 2013. Such reduction in preventive care has been the subject of some investigation.52 A growing shortage of primary care providers and insufficient reimbursement for preventative visits are speculated.
Our study has some limitations. Although the NAMCS is a rich, reliable and widely used database, in existence since 1973 and frequently drawn on for various and sundry questions about health services, the question on provider type may not be equally valid for all providers. The NAMCS samples physician offices9 and it excludes PAs and NPs who work autonomously with their own schedule of patients or those with independent practices. Also the NAMCS includes office-based physicians who do not employ PAs or NPs.
In summary, we used a national dataset with a robust sampling technique that has been validated in a large number of studies over half a century. Second, the longitudinal nature of the data and the large number of nationwide samples allow for exploration of trends over time. Lastly, our examination of proportions rather than absolute numbers permits us to identify changes in POVs and collaborative care reliably enough to identify temporal changes in populations.9 What emerged in this study was a trend in healthcare staffing that corroborates other observations that a variety of medical providers may improve flexibility and adaptability of service delivery.49–51 With an improved NAMCS survey methods, expanding current sampling units to PAs and NPs, the stage is set for exploring this observation.
Conclusions
We find that collaborative practice, involving a PA or an NP and a physician, is a growing practice in POVs. Not only is the presence of PAs and NPs more visible in physician office settings, but their share of visits appears to be rising. The underlying cause, efficiency and productivity of solo versus collaborative practice in POVs remains to be evaluated.
References
Footnotes
Twitter @s.najmabadi
Contributors SN, TJH and RSH were involved in the data analysis, interpretation and drafting the manuscript. All authors reviewed/edited the manuscript and approved the final version.
Funding The authors have not declared a specific grant for this research from any funding agency in the public, commercial or not-for-profit sectors.
Competing interests None declared.
Patient and public involvement Patients and/or the public were not involved in the design, or conduct, or reporting, or dissemination plans of this research.
Patient consent for publication Not required.
Ethics approval As we used the NAMCS publicly available data, not containing identifying variables, this study was determined exempt from review by the authors’ Institutional Review Board (IRB 00124136).
Provenance and peer review Not commissioned; externally peer reviewed.
Data availability statement Data are available in a public, open access repository. NCHS has a public use linkage to access NAMCS, 1973–1992 and NAMCS, 1993–2016. The majority of NAMCS variables are publicly available. Accessing restricted NAMCS variables, through CDC Research Data Center (RDC), is possible. We used publicly available data.