Article Text

Abstract
Background A living-donor kidney transplant is the best treatment for most people with kidney failure. Population cohort studies have shown that lifetime living kidney donor risk is modified by sex, age, ethnicity, body mass index (BMI), comorbidity and relationship to the recipient.
Objectives We investigated whether the UK population of living kidney donors has changed over time, investigating changes in donor demographics.
Design We undertook a cross-sectional analysis of the UK living kidney donor registry between January 2006 to December 2017. Data were available on living donor sex, age, ethnicity, BMI, hypertension and relationship to recipient.
Setting UK living donor registry.
Participants 11 651 consecutive living kidney donors from January 2006 to December 2017.
Outcome measures Living kidney donor demographic characteristics (sex, age, ethnicity, BMI and relationship to the transplant recipient) were compared across years of donation activity. Donor characteristics were also compared across different ethnic groups.
Results Over the study period, the mean age of donors increased (from 45.8 to 48.7 years, p<0.001), but this change appears to have been limited to the White population of donors. Black donors were younger than White donors, and a greater proportion were siblings of their intended recipient and male. The proportion of non-genetically related non-partner donations increased over the 12-year period of analysis (p value for linear trend=0.002).
Conclusions The increasing age of white living kidney donors in the UK has implications for recipient and donor outcomes. Despite an increase in the number of black, Asian and minority ethnic individuals waitlisted for a kidney transplant, there has been no increase in the ethnic diversity of UK living kidney donors. Black donors in the UK may be at a much greater risk of developing kidney failure due to accumulated risks: whether these risks are being communicated needs to be investigated.
- living kidney donors
- living-donor kidney transplantation
- registry analysis
This is an open access article distributed in accordance with the Creative Commons Attribution Non Commercial (CC BY-NC 4.0) license, which permits others to distribute, remix, adapt, build upon this work non-commercially, and license their derivative works on different terms, provided the original work is properly cited, appropriate credit is given, any changes made indicated, and the use is non-commercial. See: http://creativecommons.org/licenses/by-nc/4.0/.
Statistics from Altmetric.com
Strengths and limitations of this study
This study is a cross-sectional analysis of the UK living donor registry which collects data on the entire UK population of living donors.
It has a very large sample size (n=11 651) and the amount of missing data was very small.
The study is limited to a descriptive analysis of routinely collected data.
Comorbidity data are poorly recorded. This limited assessment of comorbidity and is something that could be addressed to ensure collection of better quality, coded comorbidity data.
Introduction
A living-donor kidney transplant (LDKT) is the best treatment in terms of life expectancy and quality of life for most people with kidney failure.1–7 The healthcare costs associated with LDKTs are less than for both dialysis and deceased-donor transplants.8 9 LDKTs reduce the number of individuals on waiting lists for deceased-donor transplants and therefore offer the possibility of transplantation to more patients, who would otherwise be dialysis dependent.10 Research over the last 6 years has attempted to better define the risks of living donation. Population cohort studies have suggested that the risks of donating a kidney, although real, are very small.11–14 Absolute 15-year incidence of kidney failure for white kidney donors is estimated at <1% but donor risk is modified by sex, age, ethnicity, body mass index (BMI), comorbidity and relationship to the recipient.14
Although UK LDKT activity is in the top third worldwide, it falls significantly below that of the USA and the Netherlands.15 In 2017, the LDKT rate in the UK was 15 per million population (pmp) compared with 18 pmp in the USA, and 32 pmp in the Netherlands.15 Only 20% of those listed on the UK transplant waiting list receive an LDKT each year.4 Certain individuals with renal disease appear to be particularly disadvantaged. The proportion of Black, Asian and minority ethnic (BAME) patients on the kidney-only transplant waiting list in the UK has increased.16 However, patients from BAME groups wait on average 6 months longer to receive a kidney transplant than White patients, and people from Black and Asian individuals in the UK are approximately 40% less likely to receive an LDKT when compared with white people with kidney disease.16–18 Older people with kidney disease are also less likely to receive an LDKT when compared with younger patients,18 and women are less likely to receive an LDKT when compared with men.19 20
In this study, we analysed UK living donor registry data to describe the UK living donor population from the last 12 years. The recipients of kidneys from older living donors in the USA have been shown to be at higher risk of graft loss, compared with recipients of younger living donor kidneys.21 The median age of the UK prevalent dialysis population is increasing22; we aimed to investigate if this was reflected in the living donor population, which might have implications for recipient outcomes. Donor nephrectomy complication rates have been reported as higher in donors with hypertension than those without,23 and in African Americans compared with other races.24 We aimed to investigate whether the UK population of living kidney donors has changed over time, investigating changes in donor demographics including age, ethnicity, sex and comorbidity. We aimed to identify whether the proportion of donations from higher risk donors has changed.
Methods
Study design, setting and data sources
In this large cross-sectional study, we analysed UK living donor registry data on all living kidney donations as reported to NHS Blood and Transplant (NHSBT) from January 2006 to December 2017. Information on every living kidney donation that occurs in the UK is collected by NHSBT, which is regulated under section 251 of the National Health Service (NHS) Act 200625 and the Health Service (Control of Patient Information) Regulations 2002.26 As such it has been granted permission by the UK’s Secretary of State to collect identifiable patient data without individual patient consent. Only anonymised data (all patient identifiers removed) was shared with the research team.
Patient and public involvement
As this study was a descriptive analysis of routinely collected data, the research was undertaken without patient and public involvement.
Participants and study size
We included all living kidney donors who had been reported to NHSBT between January 2006 and December 2017. Data were requested, and with permission extracted, from the UK Transplant Registry, held by NHSBT. No data linkage was required.
Variables
Living kidney donor demographic characteristics (sex, age, ethnicity, BMI and relationship to the transplant recipient) were extracted and compared for donor cohorts across the years of donation activity. Ethnicity was coded using the UK’s Office for National Statistics 2001 census categories: White (White British, White Irish, other White), Black or Black British (Black Caribbean, African, other Black), Asian or Asian British (Indian, Pakistani, Bangladeshi, other Asian), Chinese or other ethnic group, mixed (White and Black Caribbean, White and Black African, White and Asian, other mixed). Hospital code (non-identifiable) was also extracted for analysis. Comorbidity data are entered as subjective free text by hospital teams. Text entries were searched for a record of donor hypertension using Stata to identify text “HYPERTENS”, “TENSION”, “HIGH BLOOD PRESSURE”, “INCREASED BLOOD PRESSURE”, “HIGH BP”, “HPN”, “RISE BP”. Entries recording “PULMONARY HYPERTENSION” and “WHITE COAT” were not included as recording hypertension. Other comorbidities were listed infrequently: three individuals were recorded as having diabetes mellitus. Due to the low numbers for other comorbidities, only hypertension was included in the analysis.
Statistical methods
Binary and categorical variables were described using frequencies and percentages. Means and SDs were calculated for normally distributed continuous variables. Medians and IQRs were calculated for continuous variables whose distribution was not normal. The χ2 test and one-way analysis of variance were used to compare donor characteristics over time and across ethnic groups.
Multivariable linear regression models (regression coefficients, 95% CIs and p values) were used to examine change in continuous variable donor characteristics (age and BMI) over time (across years of donation). Multivariable logistic regression models (ORs, 95% CIs and p values) were used to examine change in binary variable donor characteristics (sex, ethnicity: white vs other ethnic groups, and comorbidity: hypertension vs no hypertension) over time (across years of donation). Potential confounders for each model were identified a priori (reported alongside adjusted results). Living kidney donor assessment is carried out within renal and transplant units at NHS hospital trusts. As living kidney donors assessed in the same centre may be more similar than living kidney donors assessed at another centre, we derived robust standard errors to account for clustering by renal unit. Non-directed donors were excluded from the analysis of donor–recipient relationship.
All statistical analyses were carried out in Stata V.15.27 We performed a complete case analysis and then undertook a sensitivity analysis using multiple imputation using chained equations to derive 40 imputed datasets per group, for the exposure variable and potential confounders and then combined using Rubin’s rules using the multiple imputation procedure in Stata V.15.27 The report was written with reference to The Strengthening the Reporting of Observational Studies in Epidemiology Statement: guidelines for reporting observational studies.28 The clinical and research activities being reported are consistent with the Principles of the Declaration of Istanbul as outlined in the ‘Declaration of Istanbul on Organ Trafficking and Transplant Tourism’.
Results
Between January 2006 and December 2017, 11 651 LKDs were reported to NHSBT (table 1). The annual number of living kidney donations between 2006 and 2019 as reported by NHSBT is shown in figure 1.
Characteristics of UK living kidney donors 2006–2017

Number of UK living kidney donors 2006–2017.
Missing data
The amount of missing data was very small. Sex was missing for 0.05% of living donors, age was missing for 0.05%, ethnicity was missing for 0.1% of participants, BMI missing for 3.6% and the relationship between the donor and the recipient was not recorded for 0.06% of directed donors.
Sex
A greater proportion of donors were women (53%), but this proportion did not change significantly over time (online supplementary figure S1). There was weak evidence that the proportion of donors who are women varied between ethnic groups (χ2 p=0.05). There were more female donors than male donors across all ethnic groups apart from individuals whose ethnicity is classified as ‘black’ (table 2). Among this group, over the 12-year period more men than women donated.
Supplemental material
Sex of UK living kidney donors across different ethnic groups*
Age
Between 2006 and 2017, the mean age of donors increased (unadjusted regression coefficient per 1+ year 0.23 (95% CI 0.12 to 0.33) p<0.001; figure 2). This association remained after adjustment for possible confounders sex and ethnicity (adjusted regression coefficient per 1+ year 0.23 (95% CI 0.14 to 0.32) p<0.001).

Mean age of UK living kidney donors 2006–2017.
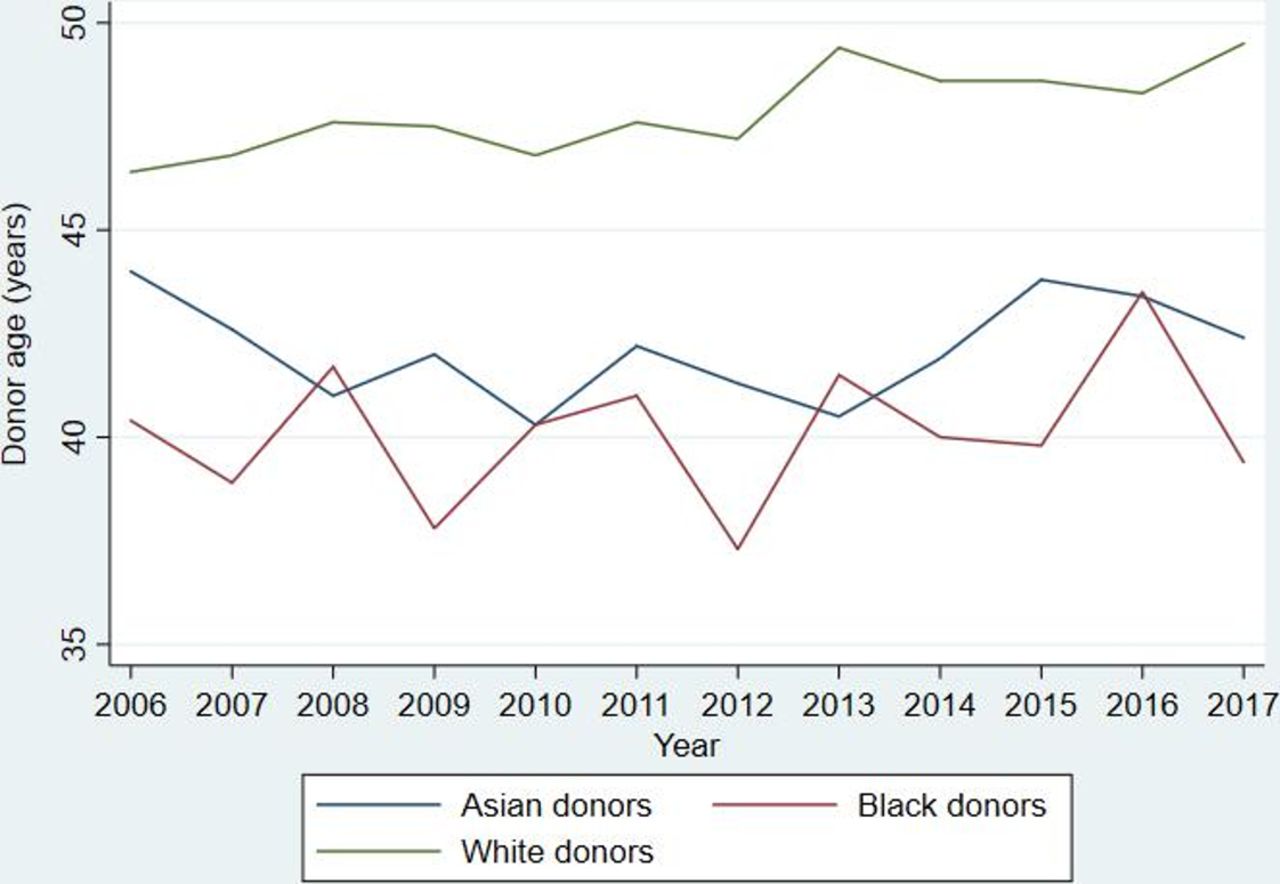
The proportion of donors aged ≥65 years increased from 4% to 10% (p value for linear trend <0.001; table 3). The mean age of donors from black and Asian and ethnic groups was lower than in white groups (figure 3).
Proportion of UK living kidney donors from different age groups 2006–2017

Mean age of UK living kidney donors by ethnic group.
Ethnicity
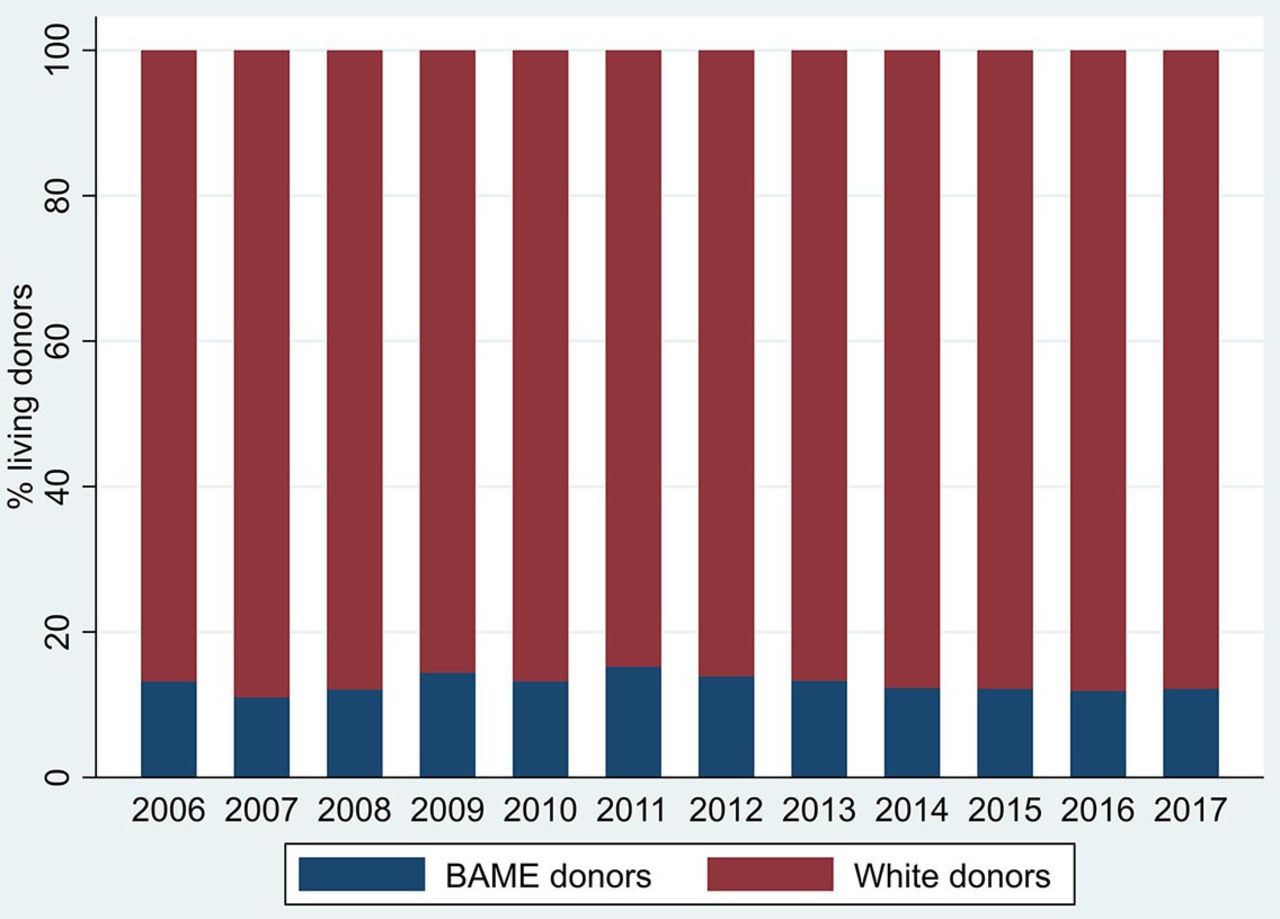
No difference in the number or proportion of donors from BAME ethnic groups was observed over the 12-year period (likelihood of donor being BAME vs white adjusted OR per 1+ year 1.00 (95% CI 0.93 to 1.08) p=0.93, p value for linear trend=0.61; figure 4 and table 4).
Ethnicity of UK living kidney donors 2006–2017.
Number of UK living kidney donors from different ethnic groups 2006–2017
Body mass index
Between 2006 and 2017, 18% of UK living kidney donors had a BMI ≥30 kg/m2 at donation (WHO category ‘obese’; table 1). Mean BMI did not change over time (unadjusted linear regression coefficient −0.02 (95% CI −0.05 to 0.02) p=0.29). There was weak evidence that mean BMI differed across ethnic groups (one-way analysis of variance p=0.04). This was largely as a result of the Chinese/South East Asian population having lower BMIs (online supplementary table S1).
Blood pressure
A minority of donors had a diagnosis of high blood pressure (3%). The proportion of donors with hypertension did not change over time (likelihood of donor having hypertension per 1+year OR 1.02 (95% CI 0.96 to 1.08) p value=0.47).
Donor–recipient relationship
The proportion of non-genetically related non-partner donations (eg, friends) increased over the 12-year period of analysis (p value for linear trend=0.002). There was evidence that the donor–recipient relationship differed between different ethnic groups (χ2 p<0.001, one-way analysis of variance p<0.001; table 5). A greater proportion of black donors are siblings to their recipient, compared with all other ethnic groups.
Donor–recipient relationship across ethnic groups: all directed UK living kidney donors 2006–2017
The associations did not significantly differ between the complete cases analysis and the analyses with missing variables imputed (online supplementary table S2).
Non-directed ‘altruistic’ donors
Between 2006 and 2017, 623 non-directed altruistic donors (NDAD) donated. There was a yearly increase in the number of NDAD donations from 2006 to 2014, before a subsequent drop and possible plateau (online supplementary figure S2). The mean age of NDADs was 54 years (SD 14). The oldest NDAD was 85 years and the youngest was 20 years. There was no evidence that the mean age of NDADs differed between years of donation (p=0.6). Ninety-eight per cent of NDADs were white, and 48% were women.
Discussion
We have described the characteristics of the cohort of individuals who donated kidneys in the UK between 2006 and 2017. We have demonstrated that over the 12-year period the donor profile changed as a greater proportion of donations from older donors occurred: this change in donor profile has implications for both recipient and donor outcomes.
We have reported differences in donor characteristics across different ethnic groups: Black living kidney donors were younger than donors from all other ethnic groups, and a greater proportion were siblings to their recipients and were men. No change in the number of donations from BAME donors was observed.
In the UK, mean donor age increased between 2006 and 2017, largely as a result of an increase in the proportion of donors aged ≥65 years of age. This change may reflect that the UK population with kidney failure is ageing, and therefore their peer and potential donor pool is also older. Recent research from the USA has reported an interaction between ethnicity and age, suggesting that the risk of kidney failure 20 years after donation is higher in older White donors but higher in younger Black donors.29 30 Therefore, our findings of increasing age in the white donor pool, and the sustained low age of black donors have implications for both donor outcomes, and mandates robust living donor follow-up, in order to accurately inform future living donors and clinicians as to the potential risks of donation. Why older BAME individuals are less likely to become living kidney donors warrants investigation.
Ethnicity
Compared with the general UK population, patients from ethnic minority backgrounds are over-represented on the kidney transplant waiting list, with 34% of patients on the waiting list classified as being from BAME ethnic backgrounds, compared with 11% of the general population.4 In this study, we found no evidence of an increase in the number or proportion of living donors from BAME groups between 2006 and 2017. In 2016, NHSBT in the UK commissioned the National BAME Transplant Alliance to allocate funding to projects designed to increase the number of LDKTs among BAME communities in the UK. Twelve awards have been made to patient-led, clinical, and charitable groups31 to undertake projects including raising awareness in specific religious communities such as the Muslim Community in Yorkshire, and the Jain community in London, as well as the use of peer volunteers to engage patients and their families in discussions about living donation and transplantation at home.31 Strategies and interventions to increase donation from ethnic minority populations need to be thoroughly evaluated to ensure that we have good evidence as to both whether an intervention has been effective, and, equally importantly, how the intervention was effective. Alongside this work further research is required to understand better the barriers that may be contributing to the ethnic inequity in donation and transplantation. Only with this understanding can evidence-based interventions be developed to increase donations from BAME individuals.
Findings from our cohort study were concerning regarding the current population of Black living donors. Black donors are already at a higher risk of developing kidney failure following donation,14 as are younger donors,14 men29 30 and those who are related to their recipient.12 In this study, we found that Black donors in the UK are younger than donors in other ethnic groups, more likely to be siblings of their recipient, and a greater proportion are men. The combination of these four higher risk factors means that Black donors in the UK may be at a much greater risk of developing kidney failure, and life-long follow-up and analysis of these outcomes for these donors is absolutely essential. Research to better understand the reasons for these ethnic differences is also required, as well as evaluation of whether and how these risks are communicated to potential donors.
Body mass index
Mean donor BMI did not change over the period of analysis despite increasing obesity in the general population.32 However, 18% of UK living kidney donors did have a BMI ≥30 kg/m2: a systematic review and meta‐analysis of short‐term outcomes for living donors identified a higher creatinine rise in obese donors with a BMI ≥30 kg/m2,33 and analysis of Scientific Registry of Transplant Recipients data has suggested that living kidney donors with a BMI >30 kg/m2 had an 86% increased risk of kidney failure compared with those with lower BMIs (adjusted HR 1.86; 95% CI 1.05 to 3.30).34 Whether UK donors with higher BMIs are adequately counselled regarding these increased risks should be investigated, in addition to determining their long-term outcomes.
Comparison with the other donor populations
An analysis of a registry of French living kidney donors (n=3877) has reported a similar increase in donor age between 2007 and 2017. As in our analysis, the French did not observe an increase in the BMIs of living donors, but a greater proportion of the UK donor population is obese compared with the French donor population (18% vs 11.3%). This may reflect the difference in prevalence of obesity between the two countries, but whether obese donors are accepted at all centres in France should be examined.35 Compared with the UK donor population, a greater proportion of French living kidney donors are women compared with the UK donor population (62.3% vs 53%).36
The UK living kidney donor population also differs in clinical and demographic characteristics to a corresponding population of USA living kidney donors.13 37 38 A greater proportion of living kidney donations in the UK are from older donors than in the USA: in an analysis of USA living donors from 1994 to 2011, only 4.2% of donors were 60 years or older,13 compared with 17.3% in this cohort.
A greater proportion of living kidney donors in the USA are from non-white individuals (25.4% in USA cohort vs 13.0% in the UK).13 As in our study, non-white donors in the USA are more likely to be younger than white donors.37 A greater proportion of living donors in the USA are obese (BMI ≥30 kg/m2) at donation (25.2% in USA vs 17.4% in UK).13
Our understanding of the risks of donation is largely based on USA data.13 14 30 39 Compared with USA data, the UK population of living kidney donors is older, less ethnically diverse, with a smaller proportion of donors classified as obese. These differences limit the generalisability of USA donor risk data from observational research to the UK population. Therefore, we would expect the incidence of kidney failure after donation to be lower in the UK than in the USA.
Future research
Further research is required to understand if differences in the donor populations of different ethnic groups are due to the choices and preferences of the donor population or due to the influence of clinicians and clinical practice policies.
Living kidney donation and transplantation occurs in a dynamic environment: in addition to emerging research on the long-term risks of donation, the UK’s economic climate and its government policy and legislation change. England will move to an ‘opt-out’ system of deceased organ donation in 2020: previous studies have shown that a move to an opt-out policy can have a negative impact on numbers of living kidney donations40 and therefore the impact of this change on living kidney donations must be monitored.
Acknowledgments
The authors would like to thank the reviewers for the time taken to review an earlier version of this manuscript. They are grateful for their suggestions which have helped them to improve the paper.
References
Footnotes
Contributors CW conceived of and designed the study, CW and AR applied for the bespoke dataset, CW contributed to data analysis and interpretation, provided feedback on the article and approved the submitted version. PKB performed the data analysis and interpretation, wrote the first draft of the article and subsequent revisions. MR accessed the dataset, contributed to study design, data analysis and interpretation, provided feedback on the article and approved the submitted version. KW, LB, AR and AC contributed to study design, provided feedback on the article and approved the submitted version. PKB and CW act as guarantors. The corresponding author attests that all listed authors meet authorship criteria and that no others meeting the criteria have been omitted.
Funding The authors have not declared a specific grant for this research from any funding agency in the public, commercial or not-for-profit sectors.
Competing interests PKB is the current holder of a Wellcome Trust Clinical Research Career Development Fellowship award. PKB has previously been recipient of a Kidney Research UK project grant unrelated to this study. CW reports grants from Northern Counties Kidney Research Fund, grants from Teesside Extralife, grants from Principle Sounds, outside the submitted work. LB reports personal fees from Chiesi Pharmaceuticals, outside the submitted work. KW, AC, MR and AR have nothing to disclose.
Patient consent for publication Not required.
Provenance and peer review Not commissioned; externally peer reviewed.
Data availability statement No additional data are available.