Article Text

Abstract
Objective To identify the relationships between county-level area deprivation and patterns of both opioid prescriptions and drug-poisoning mortality.
Design, setting and participants For this retrospective cross-sectional study, we used the IQVIA Xponent data to capture opioid prescriptions and Centres for Disease Control and Prevention National Vital Statistics System to assess drug-poisoning mortality. The Area Deprivation Index (ADI) is a composite measure of social determinants of health comprised of 17 US census indicators, spanning four socioeconomic domains. For all US counties with available opioid prescription (2712 counties) and drug-poisoning mortality (3133 counties) data between 2012 and 2017, we used negative binomial regression to examine the association between quintiles of county-level ADI and the rates of opioid prescriptions and drug-poisoning mortality adjusted for year, age, race and sex.
Primary outcome measures County-level opioid prescription fills and drug-poisoning mortality.
Results Between 2012 and 2017, overall rates of opioid prescriptions decreased from 96.6 to 72.2 per 100 people, while the rates of drug-poisoning mortality increased from 14.3 to 22.8 per 100 000 people. Opioid prescription and drug-poisoning mortality rates were consistently higher with greater levels of deprivation. The risk of filling an opioid prescription was 72% higher, and the risk of drug-poisoning mortality was 36% higher, for most deprived compared with the least deprived counties (both p<0.001).
Discussion Counties with greater area-level deprivation have higher rates of filled opioid prescriptions and drug-poisoning mortality. Although opioid prescription rates declined across all ADI quintiles, the rates of drug-poisoning mortality continued to rise proportionately in each ADI quintile. This underscores the need for individualised and targeted interventions that consider the deprivation of communities where people live.
- public health
- health policy
- substance misuse
This is an open access article distributed in accordance with the Creative Commons Attribution Non Commercial (CC BY-NC 4.0) license, which permits others to distribute, remix, adapt, build upon this work non-commercially, and license their derivative works on different terms, provided the original work is properly cited, appropriate credit is given, any changes made indicated, and the use is non-commercial. See: http://creativecommons.org/licenses/by-nc/4.0/.
Statistics from Altmetric.com
Strengths and limitations of this study
The Area Deprivation Index (ADI) was standardised to ensure that all variables were scaled equally prior to weighting.
The work accounted for changes in demographics and ADI quintiles over time using yearly demographic estimates and census indicators from American Community Survey.
This study is limited by potential reverse causality bias.
Introduction
The drug epidemic has incurred great personal, societal and economic costs,1 driven, in part, by the widespread availability and use of prescription opioids.2 In 2017, there were over 191 million dispensed opioid prescriptions,3 approximately 47 600 opioid-related deaths4 and 70 237 drug-poisoning deaths4 in the USA. Overdose deaths continue to be the leading cause of injury-associated mortality and, over the past decade, have exceeded traffic fatalities.5 To date, the primary strategy for reducing drug-poisoning mortality has been limiting the inappropriate use of prescription opioids; yet, the relentless rise in drug-related mortality continued to contribute to the decline of life expectancy in the USA since 2015.6 7
Understanding factors associated with drug-related mortality, and identifying at-risk populations, is critical to developing and targeting interventions aimed to reduce it. While the drug epidemic has impacted all segments of society, recent studies identified young and middle-aged white men as populations disproportionately affected by drug-poisoning mortality.8 9 Other studies noted the greatest rise in drug-poisoning and overall mortality in areas where rurality intersects economic distress.6 10 Similarly, the association between county-level poverty and higher rates of opioid prescribing was previously demonstrated in a 2014 study of disabled Medicare and Medicaid beneficiaries,11 though this was not examined in the general US population or linked directly to drug-related mortality. Nevertheless, addressing this epidemic will require sophisticated policy and public health approaches that consider a breadth of fundamental social determinants of health and cannot be fully captured by singular constructs such as age, race, sex or income. This is especially important for a complex and multifaceted public health problem such as the drug use epidemic, which is likely caused by a multitude of factors, affects all members of society and is fueled by both prescription and illicit drugs.
A variety of policies and public health campaigns have been implemented in an effort to curb the epidemic of opioid overdoses and other drug-related morbidity and mortality, including the introduction of state prescription drug monitoring programmes and the 2016 Centers for Disease Control and Prevention (CDC) opioid-prescribing guidelines.2 Though most of the focus has been on prescription opioids, other non-opioid prescription and illicit drugs, such as heroin and fentanyl, have also contributed to the increase in drug-poisoning deaths12 over the past two decades. Thus, the two outcomes—opioid prescribing and drug-poisoning mortality—should be tracked in parallel to assess the impact of limiting opioid use on overall drug mortality. Historically, areas with higher opioid prescription rates also experienced higher drug-related mortality,11 but recent intensive policy and public health efforts aimed at reducing opioid prescribing may have inadvertently created a divergence between opioid prescribing and drug-poisoning mortality, particularly in areas where opioid use may be low, but mortality due to non-opioids remains high. There is, therefore, a need for a contemporary population-level evaluation of current trends in opioid-prescribing practices and drug-related mortality to identify populations at greatest risk of harm from opioid and non-opioid misuse.
The Area Deprivation Index (ADI) is a validated composite measure of social determinants of health that can be used to quantify socioeconomic disadvantage for granular census-based regions.13 The ADI is comprised of 17 US census indicators spanning four domains: poverty, education, housing and employment.14 County-level indicators of economic disadvantage reflect general resource availability, safety, education quality, employment opportunity and social support,15 all of which contribute to the physical, emotional and financial health of communities and their residents. Despite the potential individual and public health implications of area-level deprivation for a wide range of clinical and public health outcomes, composite area-based measures have not been widely used to inform healthcare policy or clinical practice due to previously inaccessible national geospatial data.13 In this study, we address a pressing public health need and pursue a critical knowledge gap by examining the relationships between county-level area deprivation and patterns of both opioid prescriptions and drug-poisoning mortality in the USA between 2012 and 2017. By examining the drug epidemic through the lens of county-level deprivation, this work contributes to the evidence base for informing clinical, public health and policy interventions targeted at highest-need areas and populations.
Methods
Study design
We retrospectively analysed county-level summary measures of opioid prescriptions, drug-poisoning mortality and population demographics from 2012 to 2017 using the IQVIA Xponent prescription database,3 CDC National Vital Statistics System data16 and American Community Survey (ACS) estimates,17 respectively. These data are publicly available and contain no identifiable information; thus, this work was exempt from institutional review board approval.
Study population
All US counties with opioid prescription and drug-poisoning mortality data available each year between 2012 and 2017 were included in the study sample. Counties without data for all 6 years of the study were excluded from the sample.
Patient Involvement
No patients or members of the public were directly involved in the design, conduct, reporting or dissemination plans of the research.
ACS estimates
County demographic information necessary for ADI derivation was ascertained from 2012 to 2016 and from 2013 to 2017 5-year ACS estimates; the 5-year estimates are single year estimates based on 60 months of data.17 The ADI was derived using 17 county-level indicators and calculated separately each year for each US county, as deprivation indices may change over time (online supplementary table S1). The acs R package (V.2.1.3) was used to connect to the Census Application Programming Interface to obtain data from the ACS.18 The ACS is an annual survey conducted by the US Census Bureau which randomly samples housing units and provides population-level estimates representative of the non-institutionalised US population.17 In-depth survey methodology is available from the Census Bureau.17
Supplemental material
Outcomes
IQVIA Xponent data were used to obtain county-level opioid prescription rates from 1 January 2012 to 31 December 2017. The Xponent database includes all prescriptions issued by approximately 50 000 retail pharmacies across the USA irrespective of insurance coverage (ie, prescriptions are captured whether paid for with commercial insurance, Medicaid, Medicare or cash). Sampled pharmacies dispense nearly 90% of all retail prescriptions in the USA; information on drugs filled by mail order pharmacies is unavailable.3
Opioid prescription data from 2012 to 2017 was available for 2712 counties (figure 1). The annual rate of opioid prescriptions was calculated as the total number of prescriptions dispensed in a county per 100 residents as estimated by the ACS.3 Opioids, identified using National Drug Codes, included: buprenorphine, codeine, fentanyl, hydrocodone, hydromorphone, methadone, morphine, oxycodone, oxymorphone, propoxyphene, tapentadol and tramadol. Methadone dispensed through maintenance therapy programmes was not included.
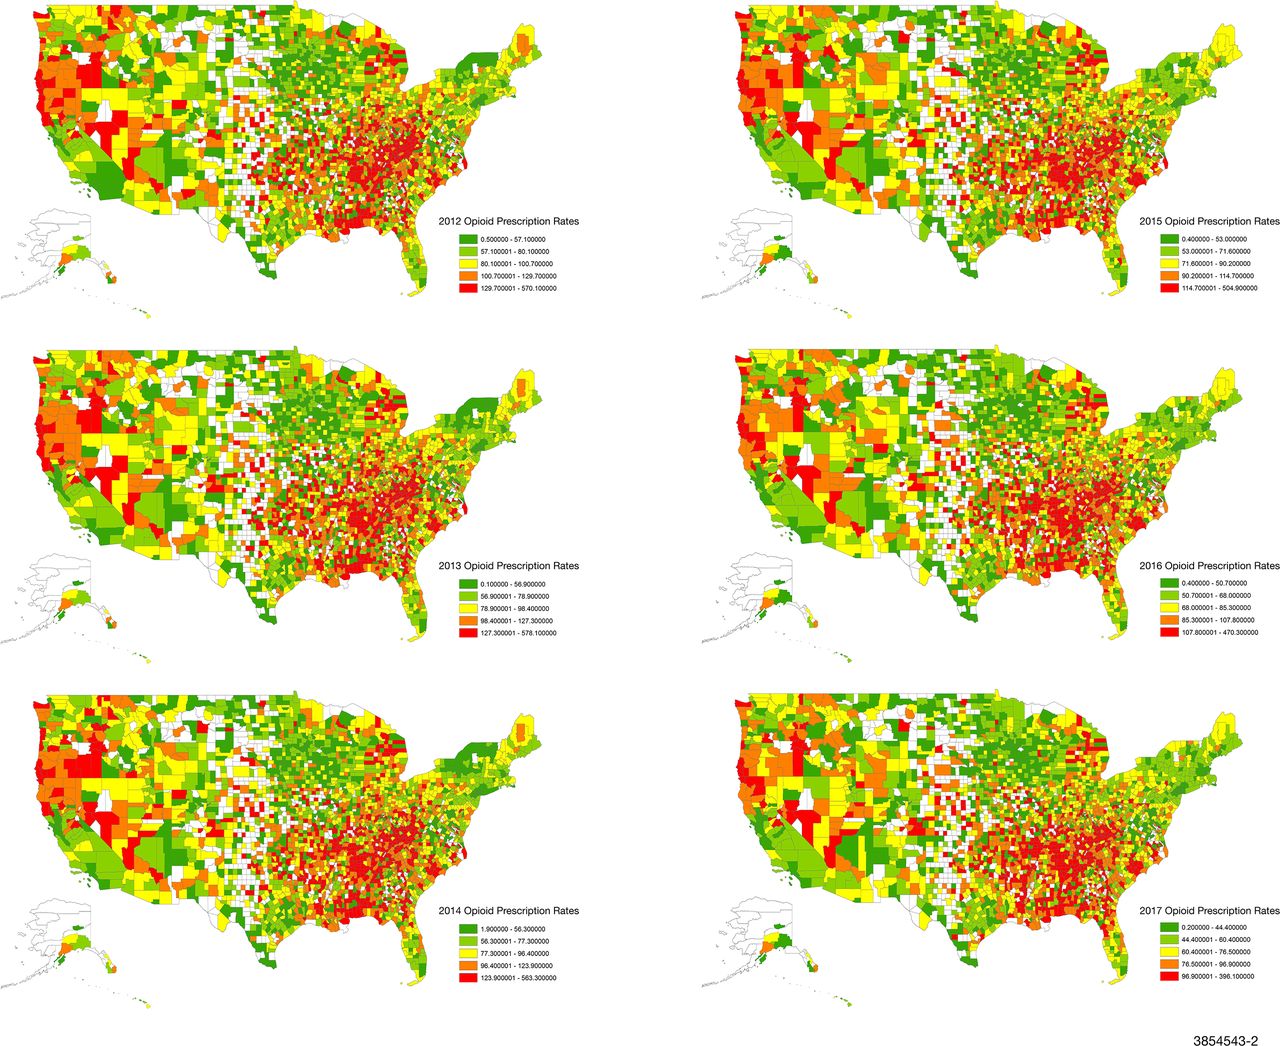
Opioid prescription rates across US counties from 2012 to 2017. 2712 of 3142 US counties with available opioid-prescribing data are shown. All rates are expressed per 100 people.
The CDC National Center for Vital Statistics data were used to obtain drug-poisoning mortality rates between 1 January 2012 and 31 December 2017; these data were available for each year for 3133 counties (figure 2). The CDC performs hierarchical Bayesian methods with spatial and temporal random effects to generate adjusted county-level drug-poisoning mortality rates per 100 000 residents.19 Drug-poisoning deaths related to opioid and non-opioid drugs were classified on the basis of International Classification of Diseases, Tenth Revision (ICD-10) codes and included deaths with unintentional (X40–X44), suicide (X60–X64), homicide (X85) and undetermined intent (Y10–Y14).16

Drug-poisoning mortality rates across US counties from 2012 to 2017. 3133 of 3142 US counties with available mortality data are shown. All rates are expressed per 100 000 people.
Role of the funding source
The funding sources for this study had no role in study design, data collection, data analysis, data interpretation or writing of the report. The corresponding author had full access to all data in the study and final responsibility for the decision to submit for publication.
ADI derivation
We calculated modified ADI scores, using the Singh method,14 for all 3142 counties in the USA using 5-year ACS estimates (figure 3). Variables were selected using a factor analysis approach14 20 21 and missing values were substituted using single imputation. All variables were transformed to a rate per capita for the county. To improve on published ADI methodologies and prevent distortion of ADI by larger continuous variables such as income, we standardised these proportions to a mean of 0 and SD of 1, thereby ensuring that all variables in the modified ADI were scaled equally prior to weighting. Each variable was then multiplied by its respective weight obtained from the factor score coefficient (online supplementary table S1), and the 17 weighted measures were summed for each county to obtain the base score. The base scores were then standardised to a mean of 100 and SD of 20. ADI was divided into quintiles for all analyses, with higher ADI values (quintile 5) representing greater deprivation.

Area Deprivation Index (ADI) quintiles presented for all 3142 US counties from 2012 to 2017. ADI was calculated using 5-year American Community Survey estimates and all US counties were included.
Statistical analysis
We used negative binomial regression to examine the relationships between ADI and opioid prescription rates and drug-poisoning mortality from 2012 to 2017, controlling for over-dispersion of outcome estimates and county population size using an offset term. We used Huber-White robust SEs clustered at the county level to adjust SEs for repeated county observations and variation. Independent variables in the models included ADI quintile, per cent county-level estimates for age, per cent white, per cent male and year. The specific independent variables were chosen based on previous literature suggesting an area-level association between those demographic indicators and greater opioid use or drug mortality.6 8–11 Predicted margins for adjusted prescription rates and drug-poisoning mortality were assessed by ADI quintile across all years.22
Analyses were conducted using SAS V.9.4 (SAS Institute) and Stata V.15.1 (StataCorp LLC, College Station, Texas, USA). Opioid prescription rates, drug-poisoning mortality and ADI at the county-level were visually represented with geographic information system maps created in ArcMap V.10.7 using Census TIGER/Line shapefiles.
Results
Association of area-level deprivation with opioid prescription rates
Opioid prescription rates were significantly higher among counties in the highest ADI quintile (Q5: most deprived) compared with those in the lowest quintile. The risk of filling an opioid prescription was 72% higher in ADI Q5 than Q1 (IRR, 1.72; 95% CI (1.63, 1.82); p<0.001) (online supplementary table S2).
Overall, rates of filled opioid prescriptions declined over time, from 96.6 per 100 people in 2012 to 72.2 per 100 people in 2017. Analogously, the percentage and total number of counties with more than one opioid prescription per resident steadily declined over time: 40.3% (n=1093) in 2012, 38.6% (n=1047) in 2013, 36.9% (n=1001) in 2014, 31.5% (n=855) in 2015, 26.7% (n=723) in 2016 and 17.6% (n=477) in 2017.
Rates of opioid prescriptions appear to decrease between 2012 and 2017 within each ADI quintile (figure 4). The adjusted prescription rate for counties in the most deprived ADI quintile (Q5) decreased from 115.9 prescriptions per 100 people in 2012 to 86.6 in 2017 (IRR 0.75, 95% CI (0.73, 0.76); p<0.001) (online supplementary table S2). Adjusted rates calculated from the predicted margins suggest that each successively less deprived ADI quintile displayed a smaller decrease in the prescription rate. Although the absolute opioid prescription rate decrement was largest in ADI Q5, the proportion of the decrease was similar across all ADI quintiles.

Adjusted rates of opioid prescriptions by Area Deprivation Index (ADI) quintile from 2012 to 2017. Rates calculated from predicted margins adjusted for year, age, race and sex were calculated per 100 people.
Association of area-level deprivation with drug-poisoning mortality
In contrast to the decline in opioid prescription rates over time, the rates of drug-poisoning mortality rose steadily by 59% (IRR 1.59; 95% CI (1.56, 1.62); p<0.001) between 2012 and 2017 (table 1) and increased incrementally with higher ADI (greater deprivation). The drug-poisoning mortality risk was 36% higher in ADI Q5 than Q1 counties (IRR, 1.36; 95% CI (1.28, 1.44); p<0.001) (table 1). The association between ADI and drug-poisoning mortality appeared to be linear with rising deprivation resulting in the higher rates of drug-poisoning mortality (online supplementary figure S1).
Factors associated with drug-poisoning mortality in the USA, 2012–2017
Geospatial variation in ADI, opioid prescriptions and drug-poisoning mortality
As shown in figures 1–3, there were consistent and strongly demarcated spatial differences in both outcomes across ADI quintiles. The highest opioid prescription rates were seen in counties in southern states and Appalachia. Southwestern USA and Appalachia also saw high drug-poisoning mortality. There were no major visual geospatial changes in the patterns of deprivation, opioid prescriptions or drug-poisoning mortality during the study period.
Discussion
Social determinants of health underlie many causes of the ongoing epidemic and need to be considered when developing and implementing interventions seeking to address it. In this study, we demonstrated that area-level deprivation, as measured by ADI, is strongly associated with geospatial variation in opioid prescriptions and drug-poisoning mortality, and, as such, may be a powerful tool for identifying areas of greatest need as well as informing and contextualising future public health and policy interventions. We also found that while opioid prescriptions decreased over time, likely driven by the multifaceted policy and practice efforts to reduce them, persistent disparities in both prescription opioid use and drug-poisoning mortality remain. Deprived counties continue to have significantly higher rates of opioid prescriptions and drug-related mortality than less deprived counties. Moreover, despite reductions in opioid prescriptions, the rates of drug-poisoning mortality have continued to increase between 2012 and 2017, reinforcing the growing impact of drugs obtained outside of the healthcare system and missed opportunities to tailor and target interventions to those at highest risk for harm. By considering contextual factors and developing customised approaches using area-level indicators, harm reduction strategies could yield a more sustainable and meaningful impact for the communities they serve.
A number of state and federal programmes have been introduced over the past decade to increase public awareness, decrease access to prescription opioids, improve opioid use disorder treatment and expand access to naloxone for overdose reversal.23 The interventions targeting opioid prescribing (ie, state-controlled substance monitoring programmes) likely contributed to the decline in rates of opioid prescriptions between 2012 and 2017, but did not rectify the disparities associated with drug-poisoning deaths. Persistent disparities in opioid prescription rates may be attributed to higher prevalence of comorbidities and disability in deprived areas,24 difficulty accessing medication for opioid use disorder25 and a different experience of pain in the setting of lower health literacy26 and socioeconomic distress. Further efforts should focus on identifying alternative pain management strategies that are effective, affordable and accessible to all who need them, irrespective of where they live. At present, access to and reimbursement for non-pharmacologic pain management modalities remains limited,27 which may further exacerbate disparities in opioid use and misuse among disadvantaged US adults.
Although opioid-prescribing rates declined over time, the rates of drug-poisoning mortality appeared to rise steadily between 2012 and 2017. While this increase affected all ADI quintiles, it, too, was higher in the most deprived counties. This finding underscores the complexity of the opioid and drug use epidemic. First, current opioid-prescribing rates are not the sole driver of drug-poisoning mortality, as mortality has continued to rise while prescription rates have declined. Illegally obtained opioids, non-opioid prescription and illicit drugs, and high rates of addiction due to overprescribing, all play an important role in drug-related deaths.2 28 Second, high rates of drug-poisoning mortality result not only from greater availability of drugs, but also from greater probability of death with drug use. People living in deprived areas often have inadequate access to substance use disorder treatment and medications29–33 and limited access to healthcare,34 resulting from failure to expand Medicaid coverage, inadequate reimbursement for treatment35 36 and variation in types of providers able to prescribe and manage treatment.37 Third, as a result of structural violence and barriers, individuals living in deprived communities may be less likely to seek medical treatment due to stigma and criminalisation leading to the higher rates of drug-poisoning mortality.38 Reducing mortality will, therefore, require a wide range of interventions in addition to limiting opioid prescribing, including improving availability of and access to non-opioid pain management, social services, mental health and substance use treatment.
Consistent with prior literature, we found that higher proportions of male residents within a county were protective against both opioid prescriptions6 39 and drug-poisoning mortality.40 Women are more likely than men to be prescribed opioid medications and to be co-prescribed other medications that increase overdose risk40–42; women are also less likely to enter substance use disorder treatment programmes.43 Counties with fewer men may also reflect larger systemic issues such as higher incarceration rates among males.38 Incarceration not only interferes with the ability to seek substance abuse treatment, but is strongly associated with family disruption, unemployment, neighbourhood decline, chronic economic hardship and importantly, increased mortality from drug-use disorders.38
Our study has several key strengths, making it relevant and actionable to public health professionals, policy makers, payers and health systems. By leveraging ADI, our analyses highlighted the importance of understanding county resources and economic conditions that may affect both use of and mortality related to opioids and other drugs. We also identified the degree of deprivation associated with increased drug-poisoning mortality in spite of extensive efforts to curb opioid use/misuse. We improved on earlier ADI studies by modifying the ADI and accounting for changes in demographics and ADI quintiles over time using yearly demographic estimates and census indicators from ACS, which has not been done to date. This is also the first study to examine disparities in the opioid and non-opioid drug epidemic using ADI and applying it to most recent CDC mortality data, allowing us to explore contemporary trends in opioid prescription and drug-poisoning mortality rates at a granular level across the USA. Nevertheless, our findings are limited by potential reverse causality bias and the inability to identify causal relationships between ADI, opioid prescription rates and drug-poisoning death. We also did not capture all prescription opioids; methadone dispensed through maintenance therapy programmes and medications dispensed by mail-order pharmacies and hospitals were not included. Lastly, the SEs may be impacted by potential spatial autocorrelation and uncertainty in the modelled outcome rates.
Addressing the drug crisis requires multifaceted interventions that address the wide range of biomedical, psychosocial and socioeconomic factors contributing to this complex and evolving problem. Recent analyses have shown that current efforts aimed at decreasing opioid prescribing are not sufficient and may slow, but not meaningfully reverse, the rise in drug-poisoning deaths.2 Our work demonstrates the need to consider local factors when developing interventions related to opioid and non-opioid use. Policies should avoid a one-size-fits-all approach and be informed by indicators such as ADI to identify areas that may benefit from additional monitoring, specific resources and tailored interventions.
Acknowledgments
We would like to acknowledge Ezra Haber Glenn, Dr Cindy Crowson and Ricky Rojas for their programming and statistical guidance.
References
Footnotes
Twitter @shaheenkurani, @mollyjeffery
Contributors SK and NDS conceived and designed the study; SK and JI acquired data; SK, RGM, SC, LJFR analysed/interpreted the data; NDS, MMJ, JI and RG supervised data analysis. All authors refined the various versions of the full paper and approved the final manuscript. The corresponding author attests that all listed authors meet authorship criteria and that no others meeting the criteria have been omitted. SK and NDS are the guarantors.
Funding This work was supported in part by a Centre of Excellence in Regulatory Science and Innovation (CERSI) grant to Yale University and Mayo Clinic by the US Food and Drug Administration grant number U01FD005938. Its contents are solely the responsibility of the authors and do not necessarily represent the official view of the HHS or FDA. This work was supported by the Mayo Clinic Robert D. and Patricia E. Kern Centre for the Science of Healthcare Delivery. SK is supported by the National Institutes of Health Clinical and Translational Science Awards programme (TL1TR002380) and the Food and Drug Administration-funded Yale-Mayo Centre for Excellence in Regulatory Science and Innovation (CERSI) programme (U01FD005938). In the past 36 months, NDS has received research support through Mayo Clinic from the Food and Drug Administration to establish Yale-Mayo Clinic CERSI programme (U01FD005938); the Centres of Medicare and Medicaid Innovation under the Transforming Clinical Practice Initiative (TCPI); the Agency for Healthcare Research and Quality (R01HS025164; R01HS025402; R03HS025517); the National Heart, Lung and Blood Institute of the National Institutes of Health (NIH) (R56HL130496; R01HL131535); the National Science Foundation; and the Patient Centred Outcomes Research Institute (PCORI) to develop a Clinical Data Research Network (LHSNet). RGM is supported by the National Institute of Diabetes and Digestive and Kidney Diseases of the National Institutes of Health under award number K23DK114497. MMJ has received research support through Mayo Clinic from the National Heart, Lung and Blood Institute (R56HL130496 and R21HL140287), the Agency for Healthcare Research and Quality (R01HS025164), the American Cancer Society (131611-RSGI-17-154-01-CPHPS), the Food and Drug Administration-funded Yale-Mayo CERSI (U01FD005938), the National Centre for Advancing Translational Sciences (UL1TR 02377; U01TR 02743).
Competing interests All authors have completed the ICMJE uniform disclosure form at www.icmje.org/coi_disclosure.pdf and declare: MMJ’s spouse owns shares in Vireo Health.
Patient and public involvement Patients and/or the public were not involved in the design, or conduct, or reporting, or dissemination plans of this research.
Patient consent for publication Not required.
Provenance and peer review Not commissioned; externally peer reviewed.
Data availability statement Data are available in a public, open access repository. All data relevant to the study are included in the article or uploaded as supplementary information. All data are publicly available. Statistical code and datasets are available from the corresponding author at kurani.shaheen@mayo.edu or can be obtained from the following websites: https://www.census.gov/programs-surveys/acs; https://www.cdc.gov/nchs/data-visualization/drug-poisoning-mortality/index.htm; https://www.cdc.gov/drugoverdose/maps/rxcounty2017.html.