Article Text

Abstract
Objectives The continuing rise of smoking behaviours will inevitably lead to a further increase in hypertension prevalence. However, limited research has examined the impacts of changes in smoking status on blood pressure (BP). We sought to assess correlations between increases or decreases of males’ and females’ cigarette consumption on systolic blood pressure (SBP), diastolic blood pressure (DBP) and pulse pressure (PP), and to investigate the relationship between smoking status changes and changes in BP through a 15-year examination period.
Design Retrospective, cohort study.
Setting We used nationally representative secondary data collected in the years 2000, 2007 and 2015 by the Indonesia Family Life Survey.
Participants We measured the smoking habits, BP indices and other socioeconomic factors documented in the multiple follow-up surveys of a sample of 10 338 respondents.
Primary and secondary outcome measures The primary outcome was the means of SBP, DBP and PP. The secondary outcome was the changes from baseline in SBP and DBP.
Results Smoking caused different effects on male and female smokers. Female smokers who increased their daily cigarette consumption had significantly higher SBP and PP (p<0.001). During 15 years of follow-up, male and female smokers who decided to quit had the largest change of SBP (adjusted mean=16.64 mm Hg, SE=21.39 and adjusted mean=24.78 mm Hg, SE=23.25, respectively), whereas new male and female smokers exhibited the highest change of DBP (adjusted mean=2.86 mm Hg, SE=11.50 and adjusted mean=7.54 mm Hg, SE=14.39, respectively).
Conclusions Our study confirmed the adverse effects of smoking on BP, which can be used to inform efforts to tackle the growing cigarette epidemic and its negative effects on hypertension among former and new smokers and develop evidence-based tobacco control policies in Indonesia.
- hypertension
- public health
- epidemiology
This is an open access article distributed in accordance with the Creative Commons Attribution Non Commercial (CC BY-NC 4.0) license, which permits others to distribute, remix, adapt, build upon this work non-commercially, and license their derivative works on different terms, provided the original work is properly cited, appropriate credit is given, any changes made indicated, and the use is non-commercial. See: http://creativecommons.org/licenses/by-nc/4.0/.
Statistics from Altmetric.com
Strengths and limitations of this study
This retrospective cohort study included a larger sample than those of other studies and consistently measured subjects, which provides strong associations between dependent and independent variables.
An innovative approach allows us to better assess true exposure amounts and dose–response relationships by examining the relationship between increases and decreases of cigarette consumption and changes in blood pressure (BP) over time.
BP, measured three times by trained interviewers (usually nurses), improves the accuracy of that data.
The survey’s self-reported data concerning parental smoking might not reflect the true prevalence and could have been influenced by recall bias, which raises the possibility of under-reporting and non-differential misclassification bias.
Introduction
Hypertension is an enormous health burden and a main risk factor for deaths globally. In 2015, approximately 1.13 billion people (1 in 3 people) worldwide suffered from hypertension, and its prevalence continues to increase, particularly in low/middle-income countries (LMICs).1–4 It is estimated that there will be 1.5 billion people suffering from hypertension in 2025, and 9.4 million people will die annually from hypertension and its complications.5
Increased blood pressure (BP) levels contribute to the burden of cardiovascular diseases (CVD),5 6 among which two-thirds comprise strokes and half are coronary heart disease (CHD) events.7 Clinic based estimations that predict vascular diseases based on the American Heart Association include systolic blood pressure (SBP), diastolic blood pressure (DBP) and pulse pressure (PP).8 According to a 2017 report by the Institute for Health Metrics and Evaluation, smoking and increased SBP were among the three highest risk factors for premature death and disability among men worldwide based on disability adjusted life years for all age groups, and increased SBP was among the highest risk factors for women.9
Indonesia is an LMIC with a population of approximately 260 million people. The burden of CVD in the country has dramatically increased in recent decades: hypertension is among the main causes of death, CHDs, stroke and hypertensive coronary disease represented in excess of a third (0.5 million) of all mortality in 2015.10 The prevalence of hypertension in Indonesia increased from 25.8% in 2013 to 34.1% in 2018, with the highest rates among those 45 years and older (ranging from 45% to 55%); however, an alarming 34.1% rate was reported among those aged 18–30 years.11 12
The continuing rise of smoking behaviours in LMICs will inevitably generate a further increase in the health burden of hypertension. Cigarette smoking is a leading risk factor for CHD,13 lung cancer14 and stroke.15 The prevalence of smoking among adults aged 15 years or older in Indonesia was 33.8% in 2018, including 62.9% among men and 4.8% among women.11 12 16 17 There is an urgent need to apply health policies to reduce the prevalence of smoking and hypertension; however, there is inadequate population-based research on the long-term correlations between smoking and health in Indonesia.
Although there is some evidence that mean BP and hypertension prevalence have increased significantly among adults over past several decades, the association between smoking and BP is not univocal. Certain studies have demonstrated a positive link between these variables,18 19 whereas others have indicated an opposite relationship.20 21 Moreover, limited research has examined the impacts of smoking behaviour changes on BP. The present study extends previous research by implementing an innovative approach and study design whereby we investigated the relationship between smoking status changes with changes in BP over time. Specifically, this study evaluated changes from the baseline of smoking behaviour and changes in BP by assessing correlations between increases or decreases of males’ and females’ cigarette consumption on BP (SBP, DBP and PP) through a 15-year examination period. Using rich longitudinal data collected from the same individuals over multiple time points encompassing a span of 15 years enabled us to distinguish developmental sequences for stability and continuity over time, thereby benefitting our assessment of the temporal generality of the several core indicators of changes in BP. Findings from the study will contribute to better information to serve as a basis for evidence-based measures made by policy and programmatic decision-makers.
Methods
Data sources
We used nationally representative secondary data from the Indonesia Family Life Survey (IFLS), an ongoing prospective longitudinal cohort study. The first IFLS (IFLS1) was conducted in 1993/1994, IFLS2 and IFLS2+ was completed in 1997/1998, IFLS3 was fielded in 2000 and the fourth (IFLS4) and fifth surveys (IFLS5) were fielded in 2007/2008 and 2014/2015, respectively. In our study, we used IFLS data from the 2000, 2007 and 2015 surveys. IFLS3 drew its sample from IFLS1, IFLS2 and IFLS2+. The IFLS1 sampling scheme stratified on provinces and urban/rural locations, then randomly selected 321 enumeration areas within each of the 13 provinces chosen from a nationally representative sample frame used in the National Socioeconomic Survey (SUSENAS), a large-scale multi-purpose socioeconomic survey in 1993.22 The sampling approach in IFLS3 was to recontact all original previous IFLS households having living members the last time they had been contacted with a total of 10 574 households in 2000. They were interviewed, had all members died since the last time they were contacted, or had joined another IFLS household which had been previously interviewed. A recontact rate of 95.2% was thus achieved of all IFLS3 ‘target’ households. Of the contacted households, 10 435 households were actually interviewed in 2000, with 43 649 individuals currently living in it. Basic information on all persons is available in the household roster.23
Measurements
All adults aged 15 years or older were interviewed regarding their smoking habits in 2000. If smoking was indicated, then they were further asked about the average number of cigarettes smoked per day. Smoking habits, BP indices and other socioeconomic factors were measured at multiple follow-up surveys in 2000, 2007 and 2015. Over the course of IFLS3 to IFLS5, 10 426 individual respondents are found alive in all three waves. Among those, a total of 61 (0.58%) respondents who did not have their BP measured and 27 (0.26%) respondents who self-reported their medication use for hypertension during the 15 years of follow-up had to be eliminated from the sample. The final sample included 10 338 respondents.
We used the multiple baseline design during the 7-year duration (2000–2007) as the first period and the longer follow-up period of 15 years (2000–2015) as the second period. Non-smokers represent respondents who never smoked and former smokers from 2000 to 2007 (first period) and from 2000 to 2015 (second period). A decrease in the cigarette consumption was defined as a decrease in the number of cigarettes smoked daily from 2000 to 2007 (first period) and from 2000 to 2015 (second period). An increase in cigarette consumption was defined as an increase in the number of cigarettes smoked daily from 2000 to 2007 (first period) and from 2000 to 2015 (second period). We captured the increases or decreases of cigarette consumption in quantity for each period; however, the extent of the change was not determined. The definition of smoking status change was thus classified into four categories: (1) from non-smokers to non-smokers, (2) from smokers to non-smokers, (3) from non-smokers to smokers and (4) from smokers to smokers.
In all surveys, trained IFLS field teams measured each respondent’s BP indices, including SBP and DBP, three times from the right arm in a sitting posture. We calculated the means of SBP and DBP based on those three measurements, and PP was constructed as the difference between SBP and DBP. We considered several covariates for BP, namely, age, education, body mass index (BMI), household income, employment and residence.
Statistical analyses
Statistical analyses were performed with SPSS V.25.0. χ2 tests were used to test for differences among frequencies for the characteristics of the groups based on smoking status. We used analyses of variance to determine whether a difference in mean SBP, DBP and PP existed based on non-smokers and increased or decreased cigarette consumption. The analyses of changes in SBP and DBP according to smoking status change were performed using general linear model (GLM) analysis, adjusted for covariates. The statistical significance level was set at p<0.05.
Sensitivity analyses
For sensitivity analyses, we reran the analyses to assess whether the BP results related to smoking would change substantially if we included/omitted the adjustments of various covariates and interactions to ensure that they produced approximately the same results. We also tested the final model by including/omitting the adjustments of various covariates to the stratified analysis (by residence). The results of the sensitivity analyses remain robust for the stratified model; however, it is sensitive to BMI on the primary model (for DBP only).
Patient and public involvement
Patients and the public were not involved in this research.
Results
Simple relationships between baseline individual characteristics and smoking status
Table 1 shows the participants’ characteristics based on their smoking status in year 2000. Significant differences among smoking status were identified for all variables. The percentages of non-smokers, former smokers and smokers were 69.8%, 2.0% and 28.2%, respectively. Most current smokers (50.2%) and ex-smokers (63.3%) were older than 39 years, suggesting that the other two groups of participants (15–24 and 25–39 years old) tend to either maintain their current smoking status or never smoke at all. The difference between male and female smokers was staggering and clearly demonstrated that, as indicated in the introduction; most of the smokers were men (90.5%). Non-smokers tended to have lower education levels and lower income than current and ex-smokers. Compared with the never smoked groups and ex-smokers, most of current smokers (78.1%) had BMI <23 kg/m2, classified as ‘lean or healthy’, were more likely to be currently working (92.4%) and lived in rural areas (57.0%).
Participants and their family characteristics across the categories of smoking status at the baseline
BP index description in all three waves
A sample of 5908 women and 4430 men aged 39.4 years (SD=13.2) in 2000 had an average SBP of 123.6 mm Hg (SD=19.2), DBP of 79.9 mm Hg (SD=10.8) and PP 43.7 mm Hg (SD=14.3); aged 46.7 years (SD=13.3) in 2007, had an average SBP of 133.7 mm Hg (SD=22.1), DBP of 81.5 mm Hg (SD=11.4) and PP of 52.2 mm Hg (SD=16.5); and aged 53.6 years (SD=13.3) in 2015 had an average SBP of 139.6 mm Hg (SD=24.9), DBP of 82.6 mm Hg (SD=12.7) and PP of 57.1 mm Hg (SD=18.4).
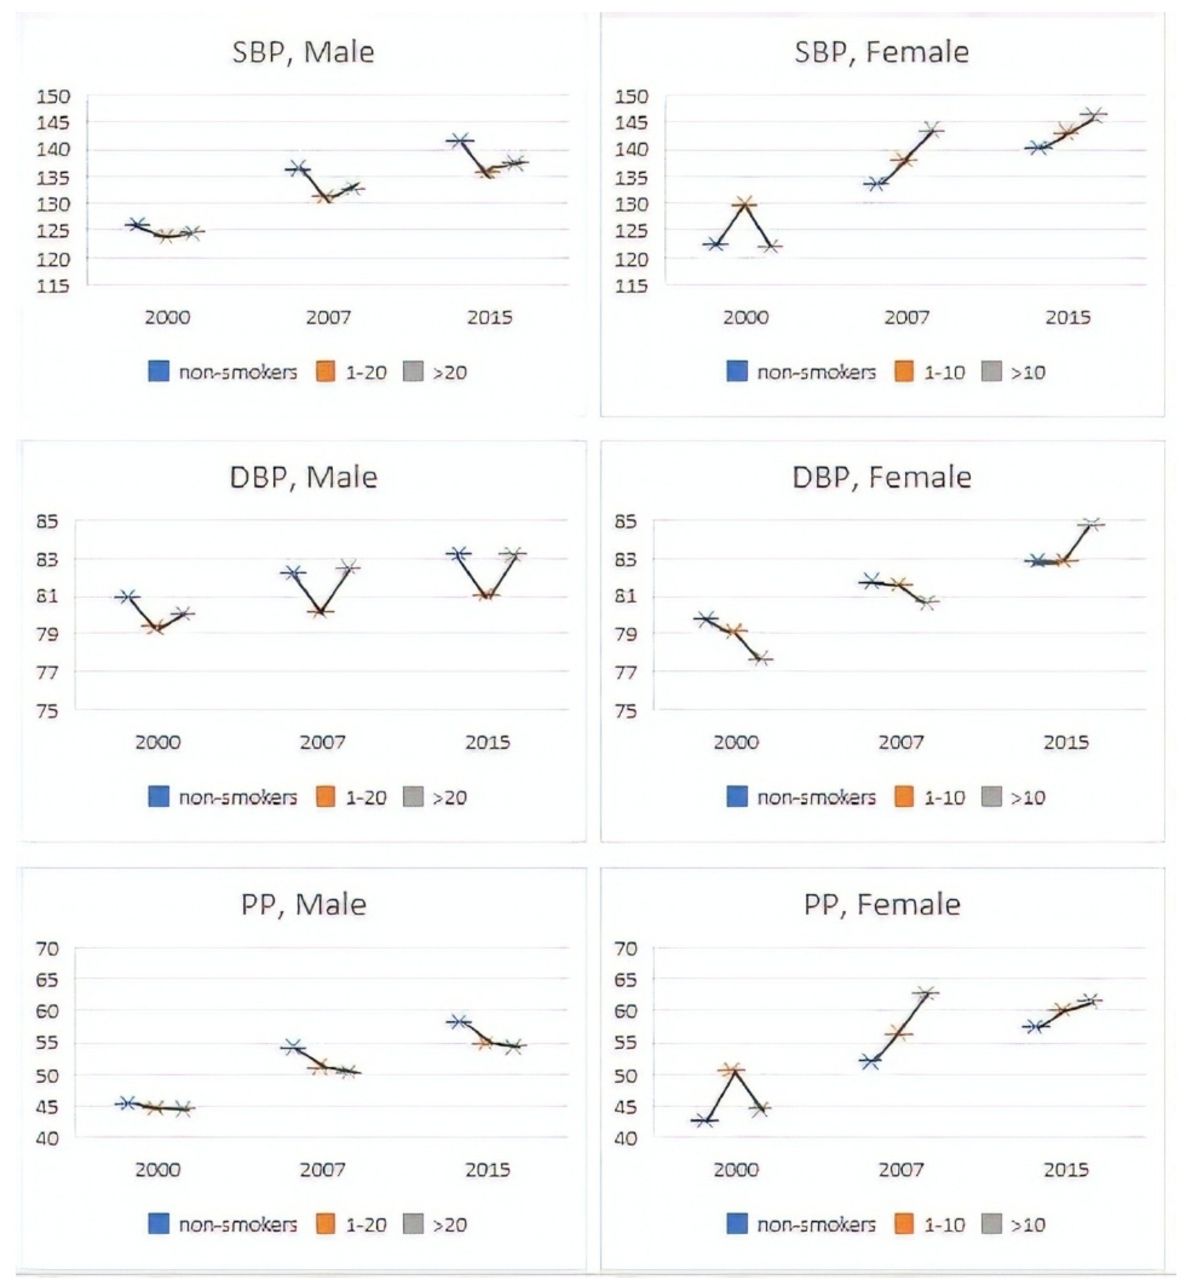
According to the gender classification in figure 1, male non-smokers had higher means of SBP, DBP and PP in 2000, SBP, 2007 and 2015 compared with smokers, regardless of the number of cigarettes they smoked, except for DBP in 2007. By contrast, female smokers generally had higher means of SBP and PP but lower means of DBP, with the exception of the year 2015, when female smokers had higher means of all BP indices compared with those who smoked less than 10 cigarettes per day and non-smokers.
Blood pressure indices in all three waves among male and female smokers. Non-smokers refer to respondents who never smoked and former smokers. Orange and grey colours represent the numbers of cigarettes smoked per day. DBP, diastolic blood pressure; PP, pulse pressure; SBP, systolic blood pressure.
Prospective analyses
Table 2 shows that smoking had different effects on the means of SBP, DBP and PP depending on biological sex. Smoking tended to lower males’ SBP and DBP, whereas it significantly increased BP among women. All PP values were within the normal range (40–60 mm Hg), except for PP among female smokers in the second period (from 2000 to 2015).
Means for SBP, DBP and PP in 2007 and 2015 in relation to cigarette smoking consumption among men and women using GLM
PP was significantly lower among male smokers than non-smokers, whereas it was higher among female smokers than non-smokers. Male smokers who increased their cigarette consumption per day had significantly lower SBP, DBP and PP (p<0.001). The associations between female cigarette consumption and BP indices were statistically significant for SBP and PP but not for DBP.
The results of multivariate analysis presented in table 3 show that women tended to experience higher mean changes in BP compared with men, regardless of their smoking status. Among men, non-smokers who ended up as new smokers experienced the largest changes in SBP (adjusted mean 9.31 mm Hg, SE=15.38) and DBP (adjusted mean 1.64 mm Hg, SE=10.16) over the 7 years of follow-up to 2007. Among women, continuous smokers had the highest changes in SBP (adjusted mean 16.07 mm Hg, SE=17.73) and DBP (adjusted mean 4.07 mm Hg, SE=8.68) during the same period. Over the longer follow-up period to 2015, men and women who quit smoking exhibited the largest changes in SBP (males’ adjusted mean=16.64 mm Hg, SE=21.39; females’ adjusted mean=24.78 mm Hg, SE=23.25). In contrast, male and female new smokers experienced the highest changes in DBP (males’ adjusted mean=2.86 mm Hg, SE=11.50; females’ adjusted mean=7.54 mm Hg, SE=14.39).
Smoking status change in relation to changes from baseline in SBP and DBP using the GLM
Discussion
The adult smoking prevalence in Indonesia was consistently high throughout this study, and men were significantly predominant among the smoking population. After checking study participants’ mean BP indices (SBP, DBP and PP) in 2007 and 2015, we found that smoking caused different effects on male and female smokers, such that smoking was identified as protective factor for BP among men, whereas it was a significant risk factor for BP (SBP and PP) among women. Many studies have been published on this topic; however, there is no firm consensus on the relationship between smoking and BP, and controversy on this issue is expected to persist in the near future due to multiple confounding factors.24 The results of this study align with study findings indicating a higher proportion of grades one and two systolic hypertension among non-smokers than smokers in Iran, as well as higher proportion of grade two diastolic hypertension.25 Taking into account biological sex stratification, the long-term effect is controversial. A retrospective study in Japanese men showed that the adjusted mean of change in current smokers’ blood pressure was lower than in the non-smokers’.26 Similar results also found that male smokers had lower means of SBP and DBP than male non-smokers.20 27 Another longitudinal research carried out in Swedish women found that the adjusted mean of change in current smokers’ blood pressure was higher than in non-smokers.28 In aged women, SBP increases more steeply in comparison to men, and this may be correlated with the hormonal changes during menopause.29 Not many previous studies have discussed the differences between men and women separately in relation to smoking and blood pressure. Therefore, our findings add to the existing body of knowledge. Further studies are required on the sex chromosome and genetic susceptibility to clarify the finding.
The current research findings also align with studies in Jordan and Sweden that showed that female smokers had significantly higher BP means than female non-smokers.28 30 A cohort study in the USA also found that female smokers were at a higher risk of hypertension.18 On the one hand, increasing cardiac output and peripheral vascular resistance cause BP to rise, which occurs before any increase in circulating catecholamines.31 On the other hand, lower BP among smokers is related to a more complex mechanism whereby the initial rise in BP caused by vasoconstriction is followed by a decrease in BP due to the depressant effects of nicotine.32 It has also been suggested that the significant loss of BMI is a main factor influencing lower BP among smokers in general as several studies have indicated that smokers who smoked 10–20 cigarettes per day have the leanest BMI.32 33
After controlling for confounding variables, such as age, occupation, wealth index, education, BMI and residence, our study correlated smoking cessation with rising SBP, whereas new smokers experienced significant increases in DBP. Previous studies have found a greater increase in SBP after smoking cessation than among those who continued to smoke,20 28 and other factors that could possibly affect SBP, such as food intake and weight gain, must also be considered.34 Many individuals report feeling greater stress after quitting smoking, whereas smokers often perceive themselves to be calmer and less stressed while smoking. It is also reported that weight gain while quitting smoking contributes to increase in BPs.35 In the case of new smokers, it is possible that the number of cigarettes smoked per day is relatively higher than among other smokers, which may cause an acute increase in DBP. Other factors such as sleep disorders, mood swings and excessive appetite could also contribute to rising DBP.
The high prevalence of hypertension in Indonesia represents an obstacle to the country’s efforts towards accomplishing the United Nations Sustainable Development Goals (SDGs), particularly SDG3’s target to reduce by 33% of unexpected deaths from non-communicable diseases by 2030. Any possible risk factors influencing hypertension must be addressed, including tobacco use. Indonesia is among only a very few countries that have not yet ratified the WHO’s Framework Convention on Tobacco Control, which explains the country’s lack of strong tobacco control policy as well as the high smoking prevalence. Tobacco control to protect current and future generations is the responsibility of all societal components, including individuals, communities and government.36 Smoke-free zones must be improved in Indonesia, and their successful implementation and enforcement will greatly depend on the existence of joint commitments across social sectors.
This study adds to a small body of literature that supports the incremental effects of smoking status changes on BP. To our knowledge, this investigation is among the first to assess the effects of smoking status changes on BP in men and women in Indonesia. This retrospective cohort study included a large sample of 10 338 subjects, which is larger than those of other studies, and it consistently measured subjects from the year 2000 (IFLS3) through 2007 (IFLS4) to 2015 (IFLS5), which provides strong associations between dependent and independent variables. With a larger sample size, besides minimising sampling errors and providing a more precise estimation in our final findings, the statistical power is potentially increased. We used extensive data to identify associations between smoking/non-smoking and smoking amounts and the changes in either smoking practice or amount and three BP indices (SBP, DBP and PP) after adjusting several covariates. This allowed us to better assess true exposure amounts and dose–response relationships. Moreover, the fact that BP was measured three times by trained interviewers (usually nurses) improves the accuracy of that data.
There were several limitations to our study. First, there are many other direct or indirect factors that contribute to BP fluctuations or changes during follow-ups among adults that could influence the results, such as sugar and food intake, coffee or tea intake, diet, drinking habits, comorbidities such as diabetes or other diseases, physical activity, frequency or intensity of smoking, stress, vasoconstriction, inflammation process and other variables that we could not include in this study due to their lack of availability. Understanding lags (time delays) between smoking and BP is essential to grasping the related dynamics and gleaning which factors cause changes in BP. Second, the survey’s self-reported data concerning parental smoking might not reflect the true prevalence and could have been influenced by recall bias, which raises the possibility of under-reporting and non-differential misclassification bias. Future research using the biomarkers of smoking exposure (eg, the levels of cotinine in urine or hair) could improve the accuracy of self-reported IFLS data.
Conclusion
In our study, smoking was significantly correlated with higher BP, particularly among former smokers and new smokers. Understanding the relationships between smoking status change and BP during different periods can be used to inform the development of evidence-based policies on tobacco control as a means of addressing the increasing cigarette epidemic in Indonesia, including raising cigarette prices and taxes, as well as expanding smoke-free zone policies in workplaces and public places. Educational programmes to prevent smoking should be continually implemented and participants in smoking cessation programmes have to be monitored and supported after completing them.
Acknowledgments
We are grateful to RAND Corporation for providing us with the IFLS data. The authors convey many thanks to Professor Dr Hasbullah Thabrany, MPH, DrPH for his critical review of our paper. This project was fully supported by funding from the Directorate of Research and Community Engagement of Universitas Indonesia. The funder had no role in any aspect of the analysis, drafting, review or approval of this manuscript.
References
Footnotes
Contributors Study concept and design: HA and SP. Statistical analysis: RIK. Analysis or interpretation of data: HA and RIK. Drafting of the manuscript: HA and RIK. Critical revision of the manuscript: HA, SP and H-WK. Writing, review and editing: HA, SP, RIK and H-WK. All authors contributed to the drafting, review and approval of this manuscript.
Funding This research was funded by The Directorate of Research and Community Engagement of Universitas Indonesia, grant number NKB-0262/UN2.R3.1/HKP.05.00/2019.
Competing interests None declared.
Patient and public involvement Patients and/or the public were not involved in the design, or conduct, or reporting, or dissemination plans of this research.
Patient consent for publication Not required.
Ethics approval The survey and its procedures were properly reviewed and approved by IRBs in the USA (at RAND) and in Indonesia at Gajah Mada University (UGM). Additional ethical review board approval was obtained from the IRB at Universitas Indonesia.
Provenance and peer review Not commissioned; externally peer reviewed.
Data availability statement Data are available upon reasonable request. The data are available from the Indonesia Family Life Survey (IFLS), collected between 2000 and 2015. The dataset are publicly available at RAND website (http://www.rand.org/labor/FLS/IFLS.html). The author granted access to the dataset by registering for access to the IFLS data download link.