Article Text

Abstract
Objectives We aimed to develop and internally validate a measure of multimorbidity burden using data from the Canadian Longitudinal Study on Aging (CLSA).
Design Data from 40 264 CLSA participants (52% men) aged 45–85 years (a mean of 63 years) were analysed. We used logistic regression models to predict overnight hospitalisation in the last 12 months in the development dataset (random two-thirds of the total) and used these to construct 10 multimorbidity indices (5 models, each treated with and without an age interaction term). Thirty-five chronic conditions were considered for inclusion in these models, in addition to age and sex. We assessed predictive and convergent validity for these 10 different multimorbidity indices in the validation dataset (remaining one-third of the total).
Results The absolute count of chronic conditions plus an interaction with age, displayed strong calibration properties, outperforming other candidate indices. Discrimination was modest for all of the indices that we internally validated, with C-statistics ranging from 0.66 to 0.68. The indices showed weak correlations (ie, convergent validity) with satisfaction with life, functional disability and mental health (absolute Pearson’s correlation coefficients ranging from 0.11 to 0.30) but generally moderate correlations with self-rated general health (0.32–0.45).
Conclusions We investigated alternative methods to measure the multimorbidity burden of individuals, tailored to the CLSA. Our findings show that an absolute count of conditions, along with an age interaction term, has the strongest calibration for overnight hospitalisation in the last 12 months. The utility of an age interaction term in measuring multimorbidity burden may be applicable to the study of chronic disease in cohorts other than the CLSA.
- epidemiology
- chronic disease
- Canadian Longitudinal Study on Aging
- comorbidity
- validation study
This is an open access article distributed in accordance with the Creative Commons Attribution Non Commercial (CC BY-NC 4.0) license, which permits others to distribute, remix, adapt, build upon this work non-commercially, and license their derivative works on different terms, provided the original work is properly cited, appropriate credit is given, any changes made indicated, and the use is non-commercial. See: http://creativecommons.org/licenses/by-nc/4.0/.
Statistics from Altmetric.com
Strengths and limitations of this study
The Canadian Longitudinal Study Aging is a large, population-based longitudinal cohort and will undoubtedly remain an important platform to study chronic disease in the general population for the next several decades as participant follow-up assessments accrue.
We carried out a robust and comprehensive assessment of 10 multimorbidity indices, comparing multiple measures of internal validity.
We were limited to a dependent variable in all regression models that was likely coarse, unable to discriminate between nuanced differences in outcome.
The overall performance of the multimorbidity indices we developed was improved, in particular calibration, through the inclusion of an age interaction term.
Introduction
Multimorbidity is defined as the co-occurrence of multiple chronic medical conditions in the same individual and affects at least 50% of individuals in the general population over age 65 years.1 According to a study conducted in Ontario, Canada, the prevalence of multimorbidity increased by an average of 40% across all age groups (from 17.4% to 24.3%) between 2003 and 2009.2 This prevalence will likely continue to increase as the elderly are projected to remain the fastest growing age demographic in high-income countries.3 An increase in the number of chronic medical conditions is associated with increased resource utilisation and mortality, as well as decreased functional status and quality of life.4
An accurate understanding of the prevalence and severity of multimorbidity in a population is fundamental to inform healthcare planning and policy-making, from frontline to tertiary social and medical services. As an important determinant of numerous health and well-being outcomes, it is also important to consider the effect of multimorbidity to allow for meaningful comparisons across populations. When evaluating healthcare utilisation, the efficacy of new healthcare policies, or comparing performance between different healthcare institutions or administrative units, controlling for differences in multimorbidity burden is essential.5 Considering the impact of coexisting chronic diseases on outcomes for colorectal surgery, for instance, is commonly done when comparing performance between hospitals.6
The Canadian Longitudinal Study on Aging (CLSA) provides a unique multidisciplinary resource to study multimorbidity in the ageing Canadian population. Launched in 2010, the CLSA is a national, prospective, population-based cohort study that includes over 50 000 participants aged 45–85 years at the time of recruitment, all of whom will be followed with periodic reassessments at 3-year intervals for up to 20 years.7 A validated measure of the overall multimorbidity burden among individuals, however, is not included in the CLSA.8 While the Charlson9 and Elixhauser10 indices are the most frequently used weighted scores in research settings, neither can be computed/derived using data from the CLSA (42%–47% of conditions required for their calculation are missing in the CLSA). Several recent publications using CLSA data have used an unweighted count of chronic diseases to quantify multimorbidity burden.11–13 Prior studies, however, have reported that an unweighted count of chronic diseases is a less valid measure of multimorbidity as compared with weighted indices.14–16 An absolute count potentially lacks face validity as it makes no distinction between the unequal effects of different conditions on outcome (eg, migraine is presumably associated with a smaller risk of hospitalisation than metastatic cancer). Therefore, a study of the performance of different approaches to measuring multimorbidity, applicable to the CLSA and potentially other cohorts, is required.
The goal of the present study was to develop a set of new indices to measure the multimorbidity burden of individuals in the CLSA cohort and to compare their internal validity with reference to their ability to predict hospitalisation.
Methods
The transparent reporting of a multivariable prediction model for individual prognosis or diagnosis statement was followed in reporting this study.17
Cohort description: the CLSA
The current study used the baseline CLSA data, collected on all participants during their first assessment, carried out between 2010 and 2015. All CLSA participants were asked to provide core information on demographics, lifestyle and behaviour, social, physical, clinical, psychological, economic and health status.7 The CLSA cohort included 51 338 participants at baseline. Excluded from the CLSA at baseline were residents in the three Canadian territories, persons living on federal First Nations reserves, full-time members of the Canadian Armed Forces, individuals living in institutions, those unable to respond in English or French, and people who were cognitively impaired.
The CLSA is divided into two subsamples: The tracking and the comprehensive cohorts. Together these are referred to as the full cohort. Participants in the tracking cohort (n=21 241) completed their data collection through a 60 min computer-assisted telephone interview. Participants in the comprehensive cohort (n=30 097) underwent an at-home 90 min face-to-face interview followed by a 2–3 hour assessment at one of 11 data collection sites across Canada. All assessments were carried out in either English or French, depending on the preference of the participant. There were three CLSA sampling frames: participants in the Canadian Community Health Survey 4.2, provincial health registration data and random digit dialling. Participants in the tracking cohort were recruited from all 10 Canadian provinces while participants in the comprehensive cohort were required to live within 25 km (50 km in low-density population areas) of a data collection site (located in seven provinces; that is, excluding Saskatchewan, New Brunswick and Prince Edward Island). The full cohort was used in the present analysis.
Patient and public involvement statement
Participants are a central part of the CLSA. Participant newsletters and CLSA-sponsored webinars update participants on the progress of the study cohort. CLSA governance includes the CLSA advisory council, including 10–12 members, with representatives from health charities and the private sector, as well as lay members. CLSA participants were not involved in the design and conduct of this current analysis of CLSA data; the identification of CLSA participants and our directly contacting them are strictly prohibited by our data sharing agreement with the CLSA.
Variables
A lifetime history of 33 chronic conditions is queried in the CLSA full cohort. These are captured using the self-report question stem: ‘Has a doctor ever told you that you have…’ Some of the condition variables are a combination of multiple conditions which were combined if there was sufficient pathophysiological similarity between them (all variables are described in online supplementary table 1). Tobacco smoking and regular alcohol consumption were treated as additional chronic conditions, bringing the total to 35. All condition variables are dichotomous, denoting either the presence or absence of the condition in question.
Supplemental material
Additional variables measured at the baseline assessment were life satisfaction, functional disability, as well as self-rated general health and mental health. Life satisfaction is the cognitive component of well-being (in contrast to the affective component that is reflected in outward manifestations). It is conceptualised as an overall assessment of one’s global quality of life.18 Life satisfaction is measured in the CLSA using the Satisfaction with Life Scale (SWLS), a 5-item self-report questionnaire scored on a 35-point scale. The SWLS correlates well with depression, perceived stress, self-esteem and negative effect.18 19 Functional disability is measured in the CLSA using the Older Americans Resources and Services measure of activities of daily living (ADL) scale.20 This is a 14-item self-report questionnaire, divided between physical/basic and instrumental ADLs, scored on a 28-point scale. The English-language and French-language versions of this questionnaire are highly correlated with healthcare professional assessments of functional autonomy.21 Self-rated general health status is assessed in the CLSA using the questionnaire item: ‘In general, would you say your health is excellent, very good, good, fair, or poor’. A meta-analysis of 22 studies demonstrated that such a question is a strong predictor of mortality.22 An almost identical item queries an individual’s ‘mental health’.
After the initial data collection interview, all CLSA participants were recontacted (planned for 18 months after the initial interview) as part of the ‘maintaining contact interview’. This was a 30 min computer-assisted telephone interview during which additional questionnaires were administered, including a new set of items to measure healthcare utilisation. We used the self-reported occurrence of any overnight hospitalisation (not including emergency department visits) in the preceding 12 months as our proxy for multimorbidity severity (data on the frequency of medical visits are not available). Healthcare utilisation is often used to construct and validate measures of multimorbidity.23 We excluded CLSA participants whose healthcare utilisation questionnaire was administered less than 12 months after the baseline interview, to ensure that the reported hospitalisation occurred after the report of chronic conditions. The administration of the chronic condition questionnaires (during the initial interview) and the healthcare utilisation questionnaire (during the maintaining contact initiative) was very unlikely done by the same CLSA research assistant, given the size and complexity of the CLSA data collection apparatus. Research assistants during the maintaining contact interview were generally not provided the opportunity to review the results of the previously collected chronic condition questionnaires.
Statistical analyses
The full cohort inflation analytical weights were used for the descriptive statistics and the regression analyses. These weights adjust for the age-stratified sampling strategy of the CLSA and the probability of inclusion in the CLSA (influenced by unequal sampling probabilities across sampling units and response rates) for each individual.24
To allow for internal validation, the full cohort was randomly divided into two datasets: a development dataset and a validation dataset (2:1 ratio). The regression model coefficients were estimated in the development dataset. We used occurrence of an overnight hospitalisation in the last 12 months as the dependent variable. We used 10-fold multiple imputation to handle missing data.25
We considered five predictive models, estimated using multivariable logistic regression. All variables were measured at baseline with the exception of hospitalisation which was queried at approximately 18 months later (minimum 12 months). All models were adjusted for age (as a continuous variable) and sex. Model 1 further included: the absolute count (ie, unweighted sum) of the total number of chronic conditions; model 2: the 35 chronic conditions, each treated as an individual dichotomous variable; models 3–5: all three began with the same predictor variables as in model 2, but we carried out variable selection using LASSO,26 stepwise selection based on the Akaike information criterion (AIC),27 or Bayesian model averaging (median probability model),28 respectively.
From models 2–5, multimorbidity indices (correspondingly indices 2–5) were built by assigning a weight to each of the chronic conditions. Each weight was obtained by dividing the corresponding untransformed regression coefficient (ie, log-odds) by the smallest absolute value among all coefficients and then rounding to the nearest single decimal place. The multimorbidity index ‘score’ for a participant is the sum of the weights for those conditions by which they are affected. For index 1, the index score is the unweighted sum of chronic conditions.
We evaluated the predictive criterion validity of each multimorbidity index by assessing model goodness of fit, discrimination and calibration in the validation dataset. These aspects of predictive performance were measured using Nagelkerke’s R2 of the model, Harrell’s C-statistic, the Pearson correlation between the predicted outcome probability and the observed outcome, and calibration plots with loess smoothers.29 A C-statistic of 1.00 denotes a measure that perfectly discriminates between individuals with different outcomes while a C-statistic of 0.50 denotes a measure that performs no better than chance. A calibration plot graphs the smoothed relationship between the observed outcomes and predicted probabilities. The diagonal line (slope equal to 1) represents perfect calibration.30 31 We hypothesised that the effect of multimorbidity on healthcare utilisation interacts with the effect of the age of a person and so we included an interaction term between each index and age in the regression models evaluating predictive validity. We tested the linearity of the relationship between continuous predictors and healthcare utilisation by introducing b-spline functions and observing whether this had any impact on model fit of the validation regression models (measured using AIC).
To evaluate convergent construct validity, we examined the correlation between the multimorbidity indices and constructs we expected a priori to correlate with the multimorbidity burden of an individual. These constructs were life satisfaction, functional disability, as well as self-rated general health and mental health. We assessed the correlation between the index and these additional constructs using Pearson’s correlation coefficient, stratified on sex. Correlations (absolute values) were characterised as very weak (0–0.19), weak (0.2–0.39), moderate (0.4–0.59), strong (0.6–0.79) or very strong (0.8–1.0).32
We used R V.3.4.2, along with the R packages mice,33 mitools,34 glmnet,35 Bayesian model averaging (BMA),36 pROC37 and regression modeling strategies38 to carry out the statistical analyses.
Results
Of the 51 338 CLSA participants, 88 were removed from the analysis because they were not aged between 45 and 85 at the time of enrolment. Of the remaining participants, 10 986 were removed because the healthcare utilisation questionnaire items were administered less than 12 months after the baseline data collection. The remaining 40 264 were split randomly according to a 2:1 ratio into the development dataset and the internal validation dataset (online supplementary figure 1). A description of the chronic condition variables used in this study is presented in the online supplementary table 1. There were no clinically relevant differences observed between the distribution of values between the development and validation datasets. We found 1.8% of participants with 0 chronic conditions, 10.6% with 1, 16.5% with 2, 17.1% with 3, 14.4% with 4, 11.1% with 5 and 20.0% with 6 or more conditions (examining only individuals with complete data).
The distribution of missing data is described in online supplementary table 1. The mean analytical weight, as well as the sex and age distributions between participants with versus without missing data did not reveal any clinically relevant differences (online supplementary table 2).
Online supplementary table 3 presents the estimated regression coefficients for the models from the development dataset. These five predictive models, as compared with a reference model including only age and sex, demonstrate small but consistent improvements in model fit, discrimination and correlation between predicted probabilities and observed outcomes. We did not find evidence of non-linearity between continuous predictors and healthcare utilisation using b-spline functions and comparing AIC.
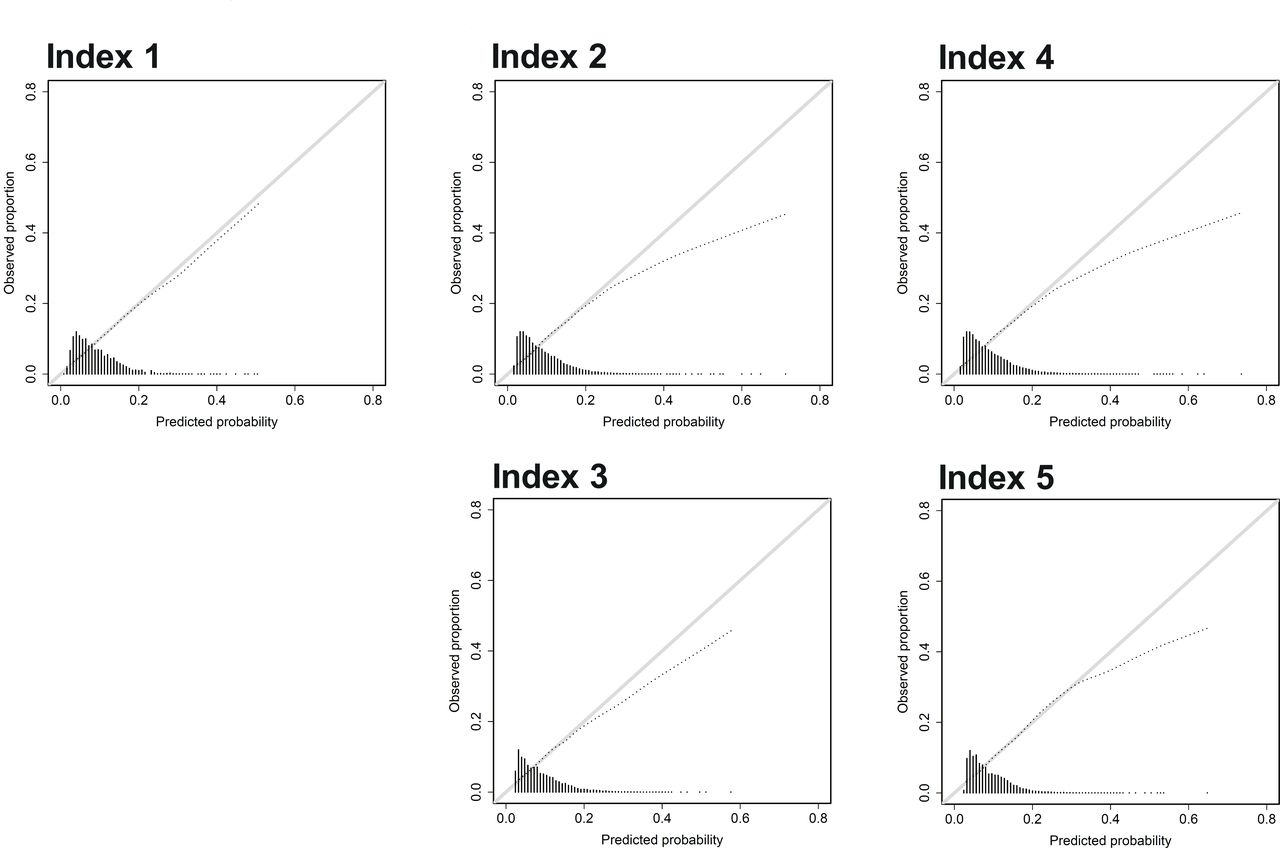
Index 1, but with an interaction term between the index and age, showed the strongest concordance between the predicted and the observed probability of hospitalisation (figure 1). The calibration plots without an interaction term are reported in online supplementary figure 2. For the remaining multimorbidity indices, calibration was poor, especially when above a predicted probability of 0.20, where the curves diverged from a slope of 1.0 (figure 1). The correlation coefficients between the predicted and the observed probability of hospitalisation were generally strong for all indices (greater than 0.80) (table 1). Model fit, measured using R2, was relatively weak for all indices. Discrimination was modest for all models (C-statistic=0.66–0.69) (table 1), although consistently higher than a model including only sex and age, with the exception of index 5 (table 1, online supplementary table 3).

Calibration plots for the five multimorbidity indices, each including an interaction term with age. A calibration plot graphs the smooth relationship between the observed outcomes and predicted probabilities. The diagonal line indicates perfect calibration.30 31 The histogram along the x-axis represents the relative count of individuals with the plotted predicted probability. The distribution of predicted probabilities varies between indices.
The five multimorbidity indices
All of the multimorbidity indices showed no more than weak correlations with satisfaction with life, functional disability and self-rated mental health (correlation coefficients=0.15–0.29) but generally moderate correlations with self-rated general health (correlation coefficients=0.35–0.45) (table 2). Stratification did not reveal subjectively large differences in correlation between men and women.
Convergent validity between the multimorbidity indices and relevant constructs*
Box 1 describes the derivation and method to calculate an absolute sum of chronic conditions that considers the interaction between index 1 and age. This allows for the calculation of an ‘age-adjusted’ sum of chronic diseases, as opposed to a simple absolute count.
Calculating a sum of chronic disease that considers the interaction with age
Recall that the regression model for index 1 in the validation dataset is:

where I is index 1 (the absolute sum of chronic conditions). Note that we can also write the above as:

This suggests that a new index taking the effect modification due to age into account is obtained by multiplying the usual index by the ‘adjustment factor’ λ, where:

For the regression model including index 1, β3=0.416 and β4=−0.004, therefore

Example
The ‘adjustment factor’ for a person who is aged 45 years is λ=1–0.00962*45=0.567. For a person who is aged 85 years, the ‘adjustment factor’ is 0.183.
Therefore, when considering the interaction between index 1 and age, for a person aged 45 years with 4 chronic conditions, the ‘age-adjusted sum of chronic diseases’ is 4*0.567=2.269 while for a person who is aged 85 years it is 0.731.
Discussion
We developed five multimorbidity indices using the baseline CLSA data and assessed their internal validity. An unweighted sum of 35 chronic conditions, combined with an interaction term between age and this sum, resulted in a highly calibrated index (ie, able to accurately predict the probability of hospitalisation in a population). The discrimination of the five indices (ie, their ability to determine whether a specific person is more likely to be hospitalised as compared with another person) was modest. There were no more than weak correlations with satisfaction with life, functional disability and self-rated mental health, while correlations with self-rated general health were larger but remained no better than moderate. We also present a method of calculating an absolute sum of chronic conditions that adjusts for the interaction with age, as opposed to a simple count, which could be used in future research. The precise age adjustment factors presented are specific to the CLSA database and may not be transportable to other databases although the mathematical approach is applicable to any database.
The modest discrimination that we found is consistent with multiple prior studies, including those studying the performance of the Charlson and Elixhauser indices. One systematic review summarised the predictive validity of three variants of the Charlson index, reporting C-statistics between 0.62 and 0.76 in numerous populations (predicting in hospital, 30 days and 1-year mortality).39 One study of almost 3500 community-dwelling adults found that the Charlson and Elixhauser indices resulted in C-statistics no higher than 0.695 for any hospitalisation or death in the year following the baseline assessment.14 Previous investigators have commented that multimorbidity models show a modest improvement in predictive performance as compared with regression models that consider only age and sex.14 40 This is likely related to the inherent challenge of reducing a complex construct into a single measure such as an index. Disease severity and duration, as well as the social determinants of health, are unaccounted for in most multimorbidity indices.41 In addition, the accuracy of chronic disease ascertainment in large databases is often wanting, relying on, for example, International Classification of Disease coding or self-reported questionnaires. Such challenges likely explain, at least in part, why some comparative studies have reported that an unweighted count of chronic diseases performs almost as well as an index based on a more complex regression model. Multimorbidity indices that are based on prescribed medications rather than diagnosed chronic conditions may perform better at predicting hospitalisation.23 These data are not yet available in the CLSA.
In spite of their limitations, multimorbidity indices, including an unweighted sum of chronic conditions, nevertheless remain recommended, especially in exploratory studies and analyses.23 39 42 This is due to their ease of use, that they standardise the operationalisation of multimorbidity, and facilitate comparisons between populations and studies. It is generally assumed that, although the ability of an index to measure the magnitude of a multimorbidity association is limited, they provide insight into the presence of such an association as well as its direction.39 42
Our study has several strengths. The CLSA is a large, population-based longitudinal cohort which includes data on 35 chronic conditions. The CLSA will undoubtedly remain an important platform to study chronic disease in the general population for the next several decades as participant follow-up assessments accrue. We studied three important aspects of predictive performance, as recommended: model fit, discrimination and calibration. We used three variable selection methods (LASSO, AIC-based stepwise selection and BMA), and examined the impact of adding interaction terms. Finally, in addition to studying predictive performance, we examined convergent validity, assessing the correlation of each index with measures of physical and mental health, as well as life satisfaction.
Our study has limitations. It is possible that healthy people are oversampled in the CLSA, although the sampling weights are meant to at least in part correct for this. Each chronic disease was treated as present or absent, with no measure of severity. As a result, we likely underestimated the impact of more severe cases given their relative rarity in this cohort. We used overnight hospitalisation within the last 12 months as the outcome as a proxy for multimorbidity severity on which we built our regression models and validated our indices. This outcome cannot distinguish between an individual with multiple hospital stays during this time period, a single but prolonged hospital stay or an individual who only spent a single night in hospital. The overall performance of the multimorbidity indices was likely also limited by the relative paucity of participants at high risk of poor outcome. A longer follow-up period would facilitate our ability to construct indices with higher predictive performance. Chronic diseases in the CLSA are self-reported by participants; therefore, there may be inaccuracies in case ascertainment. CLSA participants cannot be contacted to confirm their self-reported diagnoses. Prior validation studies have shown that self-report questions can accurately identify certain conditions such as multiple sclerosis.43
We developed and comprehensively examined the internal validity of five indices to measure the multimorbidity burden of individuals in the general population, particularly tailored for use in the CLSA. Prior research has shown that using predictive weights that are study (ie, database) specific generally improves the predictive performance of these indices.23 39 We show that an absolute count of chronic conditions, with an interaction term for age, has the greatest calibration. Our work lays the foundation for future multimorbidity research in the CLSA, a unique platform for the study of chronic conditions in the general Canadian population for the next several decades. The utility of an age interaction term in measuring multimorbidity burden may be applicable to the study of chronic disease in cohorts other than the CLSA.
Acknowledgments
This research was made possible using the data/biospecimens collected by the Canadian Longitudinal Study on Aging (CLSA). Funding for the CLSA is provided by the Government of Canada through the Canadian Institutes of Health Research under grant reference: LSA 9447 and the Canada Foundation for Innovation. This research has been conducted using the CLSA dataset Baseline Tracking version 3.2, Comprehensive version 3.2, under Application Number 161005. The CLSA is led by Parminder Raina, CW and Susan Kirkland.
References
Footnotes
ZW and LB contributed equally.
Contributors All authors contributed to the conception and design of the study and they also interpreted the data and critically revised the manuscript, approved its submitted version and accept responsibility for its content. M-PS and MK acquired the data. ZW and LB carried out the statistical analyses. MK drafted the manuscript.
Funding This study was funded by a grant from the Continuum de recherche program, of the Centre de Recherche de l’Université de Montréal (MR Keezer, nominated PI; MP Sylvestre, PI). MP Sylvestre, G Lefebvre and MR Keezer are supported by Fonds de recherche du Québec—Santé career awards.
Competing interests MK reports speaker and advisory fees for Eisai, Elsevier, Sunovion, Novartis, Sage Therapeutics, and UCB, unrestricted educational grants from UCB, and research grants from UCB and Eisai.
Patient and public involvement Patients and/or the public were not involved in the design, or conduct, or reporting, or dissemination plans of this research.
Patient consent for publication Not required.
Ethics approval Approval for this analysis of the CLSA data was obtained from the Research Ethics Board of the Centre de Recherche du Centre Hospitalier de l’Université de Montréal.
Provenance and peer review Not commissioned; externally peer reviewed.
Data availability statement Data may be obtained from a third party and are not publicly available. All CLSA data are accessible to researchers through data access requests, accepted on a triannual basis by the CLSA (https://clsa-elcv.ca/data-access).