Article Text

Abstract
Objectives The quality of ambulatory care in Switzerland is widely unknown. Therefore, this study aimed to evaluate the recently proposed quality indicators (QIs) based on a nationwide healthcare claims database and determine their association with the risk of subsequent hospitalisation at patient-level.
Design Retrospective cohort study.
Setting Inpatient and outpatient claims data of a large health insurance in Switzerland covering all regions and population strata.
Participants 520 693 patients continuously insured during 2015 and 2016.
Measures A total of 24 QIs were obtained by adapting the existing instruments to the Swiss national context and measuring at patient-level. The association between each QI and hospitalisation in the subsequent year was assessed using multiple logistic regression models.
Results The proportion of patients with good adherence to QIs was high for the secondary prevention of diabetes and myocardial infarction (glycated haemoglobin (HbA1c) control, 89%; aspirin use, 94%) but relatively low for polypharmacy (53%) or using potentially inappropriate medications (PIMs) in the elderly (PIM, 33%). Diabetes-related indicators such as the HbA1c control were significantly associated with a lower risk of hospitalisation (OR, 0.87; 95% CI, 0.80 to 0.95), whereas the occurrence of polypharmacy and PIM increased the risk of hospitalisation in the following year (OR, 1.57/1.08; 95% CI, 1.51 to 1.64/1.05 to 1.12).
Conclusions This is the first study to evaluate the recently presented QIs in Switzerland using nationwide real-life data. Our study suggests that the quality of healthcare, as measured by these QIs, varied. The majority of QIs, in particular QIs reflecting chronic care and medication use, are considered beneficial markers of healthcare quality as they were associated with reduced risk of hospitalisation in the subsequent year. Results from this large practical test on real-life data show the feasibility of these QIs and are beneficial in selecting the appropriate QIs for healthcare implementation in general practice.
- primary care
- quality indicators
- clinical guidelines
- quality in health care
- internal medicine
- public health
This is an open access article distributed in accordance with the Creative Commons Attribution Non Commercial (CC BY-NC 4.0) license, which permits others to distribute, remix, adapt, build upon this work non-commercially, and license their derivative works on different terms, provided the original work is properly cited, appropriate credit is given, any changes made indicated, and the use is non-commercial. See: http://creativecommons.org/licenses/by-nc/4.0/.
Statistics from Altmetric.com
- primary care
- quality indicators
- clinical guidelines
- quality in health care
- internal medicine
- public health
Strengths and limitations of this study
This study assessed a large set of evidence-based quality indicators (QIs) for primary healthcare in the Swiss context.
The predictive value of each QI on hospitalisation risk was also estimated.
Findings were based on a nationwide health insurance claims database covering all parts of Switzerland.
Claims data did not provide information about quality as reflected in patients’ satisfaction, communication or decision-making.
Introduction
Measuring and monitoring healthcare quality is a necessary precondition to draw healthcare providers’ attention to the patients’ need and to determine potential areas for improvement. It is the basis for the evaluation and implementation of targeted interventions to optimise the effectiveness and safety of healthcare. Since several quality measures in the literature are developed for measuring healthcare quality in the hospital setting or only at practice-level, defining quality standards for primary care at patient-level is required.1–6 These standards ensure high-quality care in all countries and also facilitate the mutual learning process in global healthcare systems. National quality standards in primary care have been developed in several Western countries such as the UK,7 Germany,8–10 Australia11 and the Netherlands.12 Considering the high healthcare expenditure (12.3% of the gross domestic product) in Switzerland, the country with the second highest life expectancy rate among the Organisation for Economic Co-operation and Development member states, the Swiss healthcare system is often considered as one of the most highly performing healthcare systems worldwide.13 However, the quality of Swiss healthcare is widely unknown. Switzerland does not have a national framework for measuring healthcare quality in primary care, and instruments for measuring and reporting quality of ambulatory services across Switzerland are insufficient.
Therefore, in 2016, we launched the Swiss Quality Indicator for Primary Care (SQIPRICA) Project, which aimed to provide the first nationwide applicable and evidence-based set of indicators to measure the quality of primary care at patient-level in Switzerland.14 An independent multidisciplinary international expert group (the SQIPRICA group) rated the potential quality indicators (QIs) derived from international evidence sources,8–10 and these QIs were adapted by the Swiss health system. Based on a consensus process, which explicitly included the patient perspective, a set of 24 QIs was identified. The QIs covered a wide range of domains in the Swiss primary healthcare setting, including general and disease-specific aspects such as drug safety, care for elderly, physicians’ efficiency and chronic disease management.
In this study, we measured the Swiss QIs in real-life settings and determined their association with an outcome at the patient-level. In contrast to evaluating the association between QIs and outcomes using aggregate data at the practice-level, analysis of individual patient-level data allows for the harmonisation of definitions and better adjustment of systematic differences of patient characteristics across subgroups.15 Moreover, the development of valid measures of healthcare quality often requires a strong association between QIs and patient-relevant outcomes; however, most internationally existing studies on quality frameworks neglected it.16 17 One largely unique and good example is the experience from the pay-for-performance scheme, which has already been successfully implemented in the UK at the national level.18 Additionally, previous studies evaluating quality measures were conducted only in selected care situations such as the treatment of symptomatic gallstones or the prevention and management of cardiovascular diseases.1 3 19 20
The present study aimed to evaluate the recently presented set of 24 QIs in primary care based on a nationwide, patient-level healthcare claims database in one of the largest health insurances in Switzerland and to determine the association between each QI and the risk of hospitalisation in the subsequent year at patient-level.
Methods
Study population and setting
We conducted a retrospective cohort study using the data from one of the largest health insurance companies in Switzerland, the Helsana Insurance Group. This patient-level database consists of anonymised pharmacy and medical and health services records of Helsana mandatory insured persons. Data can be considered representative for the general population, since ~15% of the total population in Switzerland are included (covering all parts of the country). Every resident of Switzerland has the choice to be insured with Helsana health insurance. According to the Swiss Health Law, every resident of Switzerland must be insured with a compulsory health insurance. The health insurers are privately organised and every Swiss resident can choose every health insurer. The obligatory health insurance provided is defined at the federal level and is similar for all health insurance companies; therefore, a high degree of generalisability of the data can be assumed. The longitudinal information includes patients’ sociodemographic characteristics, healthcare plan, prescribed drugs (substance, dose), laboratory tests, outpatient consultations and hospital discharges including diagnoses according to the International Classification of Diseases, 10th revision (ICD-10). The high quality of the Helsana database has been previously validated, and data were widely used to investigate the aspects of healthcare quality and several patient outcomes.21–24
Study subjects were considered eligible for inclusion in the study if they were aged ≥18 years in 2015 and continuously covered by mandatory insurance at the Helsana Group between 1 January 2015 and 31 December 2016. Subjects living abroad, nursing home residents and patients with missing values (eg, incomplete cases) were excluded. The study included all healthcare invoices submitted to Helsana health insurance for reimbursement; however, deductibles (ranging from 300 to 2500 Swiss francs (CHF)) and cost sharing with 10% of the annual healthcare costs (up to 700 CHF) are obligatory for every Swiss resident. In exchange for reduced premiums, the standard deductible of 300 CHF can be changed into a higher deductible of 500, 1500, 2000 or 2500 CHF. Nevertheless, the included invoices represent nearly all total medical expenses of the mandatory insured patients at Helsana since the majority of patients chose a low deductible (300 to 500 CHF), depending on the corresponding sample for each QI calculation from 70% (total sample) to 88% (sample of patients ≥65 years and with ≥1 medication prescription). However, most patients with a high chosen deductible still submitted their bills to Helsana and only ~3% of the additional out-of-pocket payments were not send in (according to internal Helsana analysis). Since the proportion of unsubmitted invoices is very small in patients receiving medical services, the (cost) data were slightly underestimated.
The health insurance market is regulated by governmental departments, and every health insurance company is obligated to guarantee insurance to every resident. The catalogue of health services reimbursed by basic mandatory health insurance is the same across the country and across all health insurance models.
Quality indicators
Development process
We used a total of 24 previously defined Swiss QIs at the patient-level. The QI development process was based on a comprehensive screening of existing clinical guidelines recommended by the German Association of Primary Care and Family Medicine (DEGAM, ‘Deutsche Gesellschaft für Allgemeinmedizin und Familienmedizin’), the German National Disease Management Guidelines (NVL, ‘Nationale VersorgungsLeitlinien’) and preexisting indicators from the QIs for Primary Care of the German Society of Quality Assurance (QISA, ‘Qualitätsindikatorensystem für die ambulante Versorgung’).8–10 In the absence of national guidelines, the German standards for quality in primary care were considered suitable for application since several structural similarities exist between the Swiss and German healthcare system (social health insurance system including a mix of public and private healthcare providers, German-speaking area). According to internationally established research methods for developing QIs in primary care, a six-step development process was implemented.25 In a first step, all recommendations for or against specific medical interventions of all currently existing DEGAM and NVL guidelines and all QISA quality indicators were extracted.8–10 As a second step, this list of potentially eligible items for QI was checked for operationalisability on Swiss health insurance claims data. In a third step, a multidisciplinary group of nine independent experts (SQIPRICA Working Group) rated the list of potential QIs for relevance for public health, clarity of definition, influence on measured aspect of care, risk of undesired effects and strength of evidence. As a fourth step, in face-to face workshop consensus on a preliminary set of QIs was reached. The fifth step was a feasibility test (descriptive analysis) using claims data of 950 000 adult persons with Swiss basic mandatory health insurance. As a sixth step, the final set of QIs was defined in an additional workshop. The final set of 24 indicators covered general and specific aspects of the quality in primary care. The general domains included two categories: (1) general quality aspects (QI.1, QI.2) and (2) efficiency of healthcare (QI.3 to QI.7). The specific aspects comprised the following three domains: (1) drug safety (QI.8, QI.9), (2) care for the elderly (QI.10 to QI.13) and (3) chronic disease management/the medication therapy of acute cardiovascular events (disease-specific, QI.14 to QI.24). Details of the development process are described elsewhere.14
Measurements
The calculation of the single QIs was performed in 2015 and can be described as follows: QI.1 and QI.2 relate to the general aspects and were thus calculated in the total sample. For the calculation of QI.3 to QI.24, additional specific inclusion criteria were applied: QI.3, QI.8 and QI.9 relate to patient subgroups with ≥1 prescription of each relevant medication class according to the WHO Anatomical Therapeutic Chemical (ATC) groups:26 proton pump inhibitors (PPIs), statins, angiotensin II (ATII) antagonists, ACE inhibitors, anxiolytics/sedatives/hypnotics and non-steroidal anti-inflammatory drugs (NSAIDs). QI.3 calculates the drug costs of the given ATC group divided by the sum of the received defined daily dose (DDD) per person/year. Considering that the distribution of costs was heavily skewed and that cost figures could not easily be translated in good or poor quality of care, we cut the range of costs into four (QI.3) and six (QI.2) equally populated cost groups (with one exception: since the high costs in QI.2 were significantly prevalent, we divided it into two high-cost groups; the groups of QI.2 were not equally distributed). QI.4 and QI.5 relate to the efficiency of general medication prescriptions; thus, they were calculated in a subsample of persons with ≥1 medication prescriptions irrespective of the drug class. QI.4 calculates the occurrence of prescribed generics versus the receipt of a prescribed original product with increased co-payment (20% vs 10%).27 QI.5 reflects the existence of prescribed inefficient me-too medications including analogue drugs with no or only marginal differences to already launched drugs or drugs with unclear therapeutic value. The assignment was based on classifications developed by Fricke and Klaus.28 29 QI.6 and QI.7 measure the number of different primary care physicians or specialists and were calculated in persons who had ≥1 physician (primary care/specialist physician) consultation. The quality of care for the elderly is displayed in QI.10 to QI.13 and was thus assessed in the subsample of persons aged ≥65 years. QI.10 and QI.11 reflect the drug safety in elderly patients with ≥1 medication prescription: QI.10 measures ‘polypharmacy’ (>5 different drug prescriptions in ≥1 quarter per patient/year) and QI.11 ‘potentially inappropriate medications (PIM)’ (≥1 PIM prescription in ≥1 quarter per patient/year). PIM was calculated based on ATC codes, the PRISCUS list (Latin for ‘time-honoured’), and Beers criteria and included medications that had to be avoided in elderly patients due to evidence of increased complications and poor outcomes.30 31 Another QI regarding care for the elderly was the influenza vaccination, which is displayed in QI.12. To determine the presence of hospitalisation for fractures near the pelvic joint (ICD-10 ‘S72.0x’, QI.13), the presence of ≥1 comorbidity (measured as pharmacy-based cost group, PCG) was applied as an additional criterion.32 33 QI.14 and QI.15 assessed the long-term therapy of systemic corticosteroids in two sequential quarters and the disease-specific hospitalisation (ICD-10 ‘J.44/45’) in patients with respiratory diseases (presence of the corresponding PCG). QI.16 to QI.20 relate to patients with diabetes mellitus (measured as PCG ‘diabetes’) and evaluated the annual control of glycated haemoglobin (HbA1c), lipid and kidney values, the eyes and the occurrence of hospitalisation. The secondary prevention of myocardial infarction (ICD-10 ‘I.21’) and stroke/transient ischaemic attack (TIA, ICD-10 ‘I.64’, ‘G.45’) with the use of acetylsalicylic acid (aspirin, ASS) and statins in the 12 months following hospital discharge was reflected in QI.21 to QI.24. A detailed description of each indicator is provided in online supplementary table S1.
Supplemental material
Baseline covariates and outcome
Several patient characteristics such as age, gender, region of residence (urbanisation, language), type of health insurance plan (deductibles ‘low: 300 to 500 CHF’ vs ‘high: >500 CHF’, supplementary/private insurance) and proxies for health status were obtained from the database in 2015. Patients’ individual health status was approximated by the number of patients’ chronic diseases and the incurred healthcare costs in the previous year (2014). According to the WHO ATC classification system, a total of 22 diseases were identified using the well-established pharmacy-based mapping approach for chronic conditions (PCGs).32 33 Conditions comprised bone diseases (osteoporosis), cancer, cardiovascular diseases (including hypertension), dementia, diabetes mellitus, epilepsy, glaucoma, gout/hyperuricaemia, HIV infection, hyperacidity-related disorders, hyperlipidaemia, iron deficiency anaemia, migraine, pain, Parkinson’s disease, psychological disorders, psychoses, respiratory illness, rheumatological conditions, thyroid disorders and tuberculosis. In the absence of systematically recorded clinical diagnoses in the entire Swiss outpatient setting, this mapping approach provides a direct measure of the treated chronic conditions and is a commonly used and reliable method to identify chronically ill patients in administrative databases.34 35 The summarised measure ‘number of chronic conditions’ was categorised into four groups (0 to 1, 2 to 3, 4 to 5, ≥6). Healthcare costs incurred in the previous year were calculated and considered as surrogate for the medical history of the patients reflecting disease severity. They include all costs reimbursed by Swiss basic mandatory health insurance, excluding cost sharing of cantonal authorities and insured person (co-payments, deductibles). The outcome of interest was all-cause hospitalisation in 2016 (follow-up), defined as an overnight hospital stay within the year.
Statistical analysis
Sociodemographic variables and other baseline characteristics of the total study sample were summarised using descriptive statistics. Categorical variables were presented as percentages and continuous variables as means (SD). According to the definition of QIs, we computed the overall 16 subgroups to determine the percentage of patients meeting the corresponding QI. To validate the calculated QIs, for each QI, a multiple logistic regression model was performed to assess the independent association between QIs at baseline (2015) and all-cause hospitalisation at follow-up (2016); with exception of QIs that are already clearly utilisation measures (QI.1, QI.13, QI.15, QI.18). All performed regression models were controlled for the following patient characteristics: gender, age, region of residence, type of health insurance plan, proxies for health status (number of chronic conditions, healthcare costs in the previous year (2014)). The selection of the included independent variables was based on the current Swiss risk equalisation model.36 Besides age and gender, the regional variables were also included since the Swiss healthcare system is regulated at regional level (by canton); additionally, proxies for health status were defined as covariables because they strongly influence health outcomes.21 We included the summarised measure ‘number of chronic conditions’ (categories: 0 to 1, 2 to 3, 4 to 5, ≥6) as control variable because it reflects a simple index for chronic disease status. In literature, this kind of indexes is a very helpful and effective instrument to measure patients’ health status and to reflect co-morbidity status.21 Using a comprehensive morbidity measure in every QI-analysis increased the comparability of our QI results.
Moreover, all regression models were separately performed for high-risk beneficiaries which were defined as follows: (1) Patients suffering from at least two chronic conditions simultaneously, and (2) Patients with at least two chronic conditions and high costs. The cut-off point of two conditions was used because studies have shown that the co-occurrence of two of more (chronic) conditions within one patient has a high impact on future adverse health outcomes such as hospitalisation.37 38 Patients with high costs were defined as the top 20% of patients incurring the highest healthcare costs in the previous year.39 40 We did not correct for multiple comparisons, since the selection of the QIs was theoretically based (derived from German national guidelines and adapted to the Swiss system by the SQIPRICA Working Group), and did not depend on the observed results. All 24 QIs were statistically tested and all results were reported. The QIs reflect different aspects of the healthcare quality and exist independently of each other. Statistical analyses were performed using the statistical programme R V.3.5.0 (R Development Core Team 2018). Significance was determined at a level of 0.05.
Patient and public involvement
Since we analysed already recorded health insurance claims data, patients or the public were not involved.
Results
A total of 520 693 patients were eligible for analysis in the baseline year (2015). Table 1 shows the patient characteristics of our study cohort. There were slightly more women (53%) than men (47%), and the mean age was 54 years. Regarding the geographical distribution, most persons lived in urban regions (66%) and approximately a quarter of the population in the Latin-speaking areas of Switzerland. Almost 30% of the sample chose a deductible class greater than 500 CHF, and approximately a fifth chose a supplementary/private health insurance plan. The annual mean healthcare costs of basic mandatory health insurance per patient amounted to 4848 CHF in the previous year. Moreover, 41% of the study population had two or more chronic conditions as assessed using PCGs.
Patient characteristics (n=520 693)
Table 2 presents the number of persons in the various subpopulations who required the calculation of the Swiss QIs. We defined the number of patients with respiratory disease and diabetes mellitus and revealed a prevalence of approximately 10% and 7%, respectively. When the analytical sample was based on patients with a specific event (myocardial infarction, stroke or TIA), the number of eligible patients was 1284 and 518, respectively. Online supplementary table S2 describes the outcome (hospitalisation) for each subsample used for the calculation of the QIs. Approximately 15% of the patients with at least one medication prescription in the baseline year (2015) were hospitalised in the following year (2016), whereas the proportion of hospitalised patients receiving specific medications such as PPIs, statins and ATII antagonists was higher (22%).
Supplemental material
Patient inclusion criteria relevant for the calculation of the quality indicators (n=520 693 (total; corresponding to QI.1 and QI.2))
Table 3 depicts the 1-year prevalence of QIs measuring the general aspects and efficiency. QI.1 measures emergency hospital admission that contributes a rate of 4% in the total analytical sample. QI.2 divides the sample into six groups according to their annual medication costs (total): more than half of the sample incurred 420 CHF or less in the year 2015. Regarding the efficiency of medication prescription, the costs per DDD of PPIs and statins were considerably higher than the costs of ATII antagonists and ACE inhibitors (QI.3). A generic medication was prescribed to approximately 20% of the patients (QI.4). Approximately 70% of the drug users were prescribed an inefficient me-too medication according to the classification of Fricke and Klaus (QI.5). QIs attributed to patients’ consultation behaviour revealed that only 5% consulted three or more different primary care physicians (QI.6) and that, in contrast, 16% had consultations with at least four different specialist physicians (QI.7).
Quality indicators (QI.1–7), part 1: general aspects and efficiency
Table 4 displays the prevalence of QIs related to drug safety, care for the elderly and disease-specific QIs. QI.8 and QI.9 indicate the risk for overuse of anxiolytics/sedatives/hypnotics and NSAIDs, respectively. Approximately a quarter of each medication user group received three or more packages. QIs covering the aspects of care for the elderly (QI.10 to QI.13) revealed a relatively high proportion of persons aged ≥65 years who received polypharmacy (QI.10, 53%) and PIM (QI.11, 33%), whereas a modest percentage of elderly patients received an influenza vaccination (QI.12, 18%) or a hospitalisation for fracture near the pelvic point (QI.13, 0.3%). Regarding chronic disease management, a considerable number of patients with diabetes mellitus received guideline-based healthcare (QI.16, HbA1c: 89%; QI.17, ophthalmological control: 50%; QI.19, control of lipid values: 64%), and only a small number of patients with respiratory diseases underwent a long-term therapy of corticosteroids (QI.14, 2%) or were hospitalised due to disease-specific complications (QI.15, 1%). ASS and statins were administered in the majority of patients after an acute myocardial infarction (QI.21 and QI.22, ~90%) and in three-quarters of the patients with stroke or TIA (QI.23 and QI.24, ~75%).
Quality indicators (QI.8–24), part 2: specific aspects (drug safety, care for elderly and diseases-related)
Figure 1 displays the multivariate regression results estimating the association between the QIs measuring general and efficiency aspects and patients’ all-cause hospitalisation risk in the following year. After adjusting for sociodemographic characteristics and proxies for health status, all QIs except for QI.3 (categories of costs per DDD of relevant drug classes) indicated validity since their presence in a patient was associated with statistically significant increased risk of hospitalisation in the following year. Analysis of QI.2 showed a significant positive association: the higher the medication costs, the higher the risk of hospitalisation in the following year. Costs per DDD in selected ATC drug classes were not relevantly associated with hospitalisation risk (QI.3). Prescription of generics (QI.4) and prescription of me-too medications according to the classification of Fricke and Klaus (QI.5) indicated a slight increase in hospitalisation risk (OR, 1.09/1.17; 95% CI, 1.07 to 1.12/1.14 to 1.20). Additionally, the more primary care physicians consulted (QI.6), the higher the risk of hospitalisation in the following year, which was similar for the number of specialist physicians consulted (QI.7).
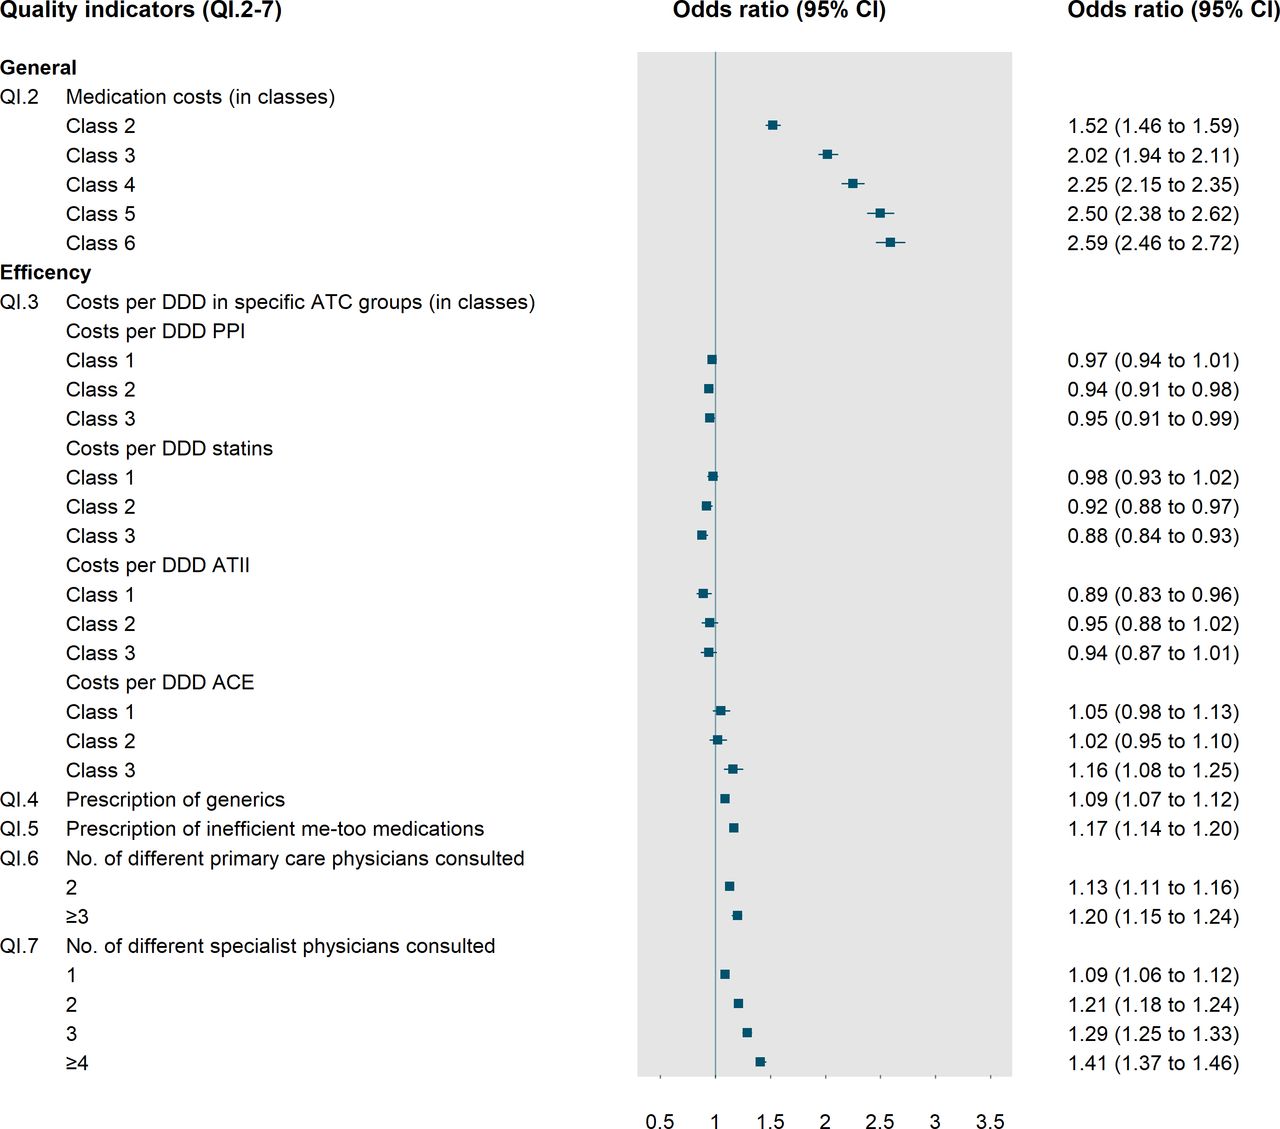
Quality indicators (QI.2–7), general aspects. ATC, anatomical therapeutic chemical; ATII, angiotensin II; DDD, defined daily dose; PPI, proton pump inhibitor.
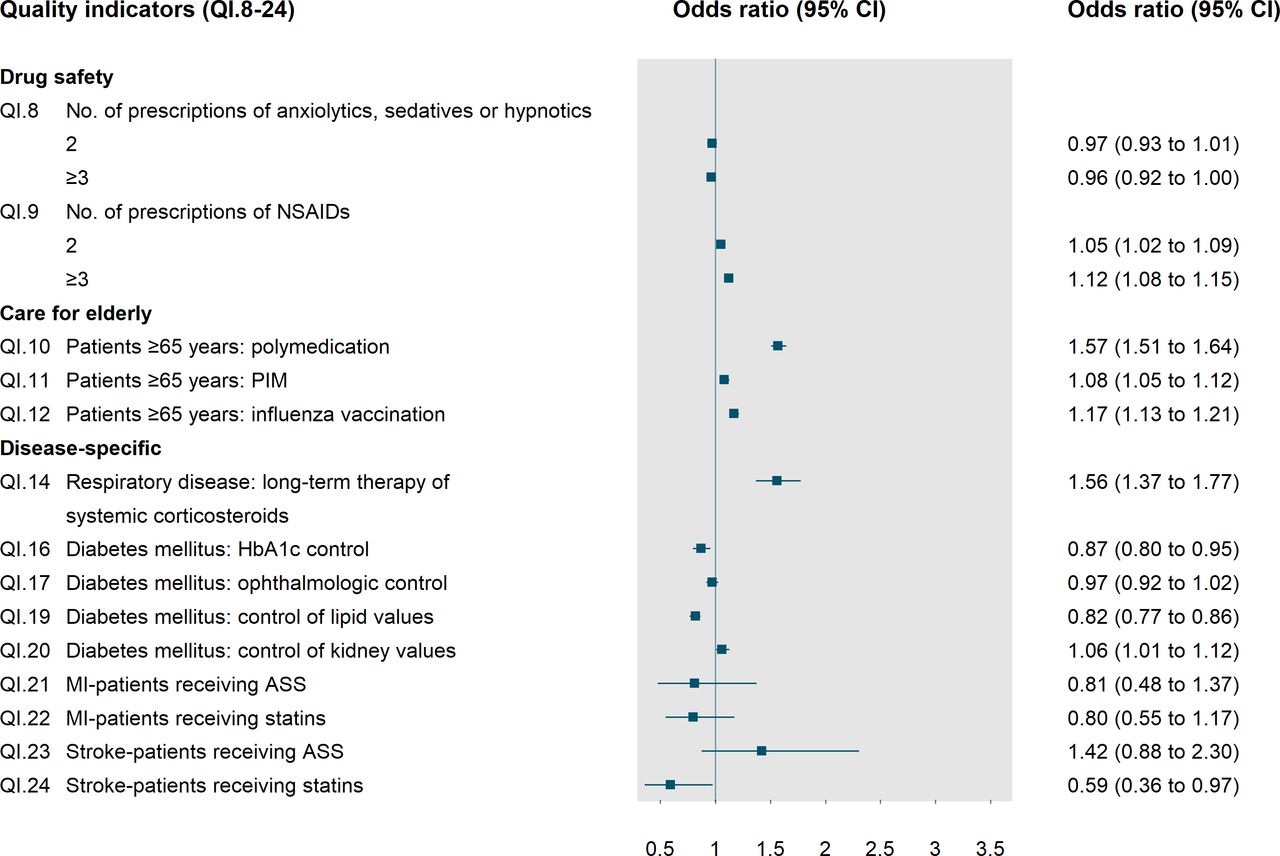
Figure 2 displays the estimates for QIs relating to specific aspects of care. The number of prescriptions of anxiolytics, sedatives or hypnotics (QI.8) was not associated with hospitalisation in the following year. In contrast, the more prescriptions of NSAIDs a patient received at baseline (QI.9), the higher was his or her probability of hospitalisation in the following year (OR, 1.05/1.12; 95% CI, 1.02 to 1.09/1.08 to 1.15). Moreover, the indicators displaying the quality of care for the elderly, such as receiving polypharmacy (QI.10) or PIM (QI.11), were statistically significantly associated with the odds of hospitalisation (OR, 1.57/1.08; 95% CI, 1.51 to 1.64/1.05 to 1.12). Patients who had received an influenza vaccination (QI.12) were more likely to be hospitalised than were patients who did not receive an influenza vaccination. Long-term therapy of systemic corticosteroids (QI.14) in patients with respiratory disease was strongly associated with hospitalisation in the following year (OR, 1.56; 95% CI, 1.37 to 1.77). Chronically ill patients had lower rates of hospitalisations when they received the measures of secondary prevention. In patients with diabetes, HbA1c control (QI.16) and control of lipid values at baseline (QI.19) were statistically significantly associated with a decreased risk of hospitalisation in the following year (OR, 0.87/0.82; 95% CI, 0.80 to 0.95/0.77 to 0.86). Ophthalmological control (QI.17) was not associated with hospitalisation risk. In contrast, control of kidney values (QI.20) was associated with a slight increase of the odds of hospitalisation. With respect to the secondary prevention of stroke or TIA, patients after stroke or TIA who received statins (QI.24) were less likely to be hospitalised in the following year than were non-users of statins (OR,0.59; 95% CI, 0.36 to 0.97).
Quality indicators (QI.8–24), specific aspects. All regression models were controlled for: age, sex, region of residence (rural/urban), Latin-speaking area (yes/no), deductible class (low/high), supplementary/private insurance (yes/no), number of chronic conditions, healthcare costs in the previous year (in cost classes). ASS, aspirin; HbA1c, glycated haemoglobin; NSAIDs, non-steroidal anti-inflammatory drugs; PIM, potentially inappropriate medication.
Online supplementary tables S3,S4 show the results of regressions for high-risk beneficiaries defined as patients with ≥2 chronic conditions and patients with high costs and ≥2 chronic conditions. Overall, the regression results were quite similar to the results based on the total sample, but with some larger and some smaller ORs in these high-risk groups. Especially, QIs reflecting drug safety in elderly patients were stronger associated with the hospitalisation risk in both high-risk groups: the OR of polypharmacy (QI.10) and PIM (QI.11) were larger than in the high-risk groups compared with the total sample (polypharmacy: OR, 1.57; 95% CI, 1.51 to 1.64 (total) vs OR, 1.71/1.94; 95% CI, 1.65 to 1.77/1.82 to 2.07 (high-risk); PIM: OR, 1.08; 95% CI, 1.05 to 1.12 (total) vs OR, 1.15/1.17; 95% CI, 1.11 to 1.19/1.11 to 1.23 (high-risk)). Additionally, in contrast to the total sample the high-risk group analysis showed a significant association between ≥3 prescriptions of anxiolytics, sedatives or hypnotics (QI.8) and the hospitalisation risk in the following year (OR, 0.96; 95% CI, 0.92 to 1.00 (total) vs OR, 1.07/1.06; 95% CI, 1.02 to 1.11/1.01 to 1.12 (high risk)). Furthermore, ORs of the number of different primary care physicians consulted (QI.6) were larger in the high-risk groups than in the total sample (OR, 1.20; 95% CI, 1.15 to 1.24 (total) vs OR, 1.25/1.23; 95% CI, 1.19 to 1.30/1.16 to 1.31 (high-risk)). On the other side, a few ORs were smaller or even not significant in the high-risk group analysis. For example, compared with the regression results of the total sample indicators reflecting medication costs such as QI.2 and QI.3 showed no significant association with the future hospitalisation risk in the high-risk group analysis (eg, QI.2 (class 6): OR, 2.59, 95% CI; 2.46 to 2.72 (total) vs OR, 0.82/0.001; 95% CI, 0.07 to 9.34/0.92 to 1.11)).
Supplemental material
Supplemental material
Discussion
To the best of our knowledge, this is the first study that evaluated a large set of evidence-based QIs at a national level and determined the association between QI results and patient-relevant outcome measures. This is an important step toward proving data on healthcare quality and quantifying and comparing different quality aspects. The study revealed a clinically relevant and, in most cases, statistically significant association between the presence of QIs at patient-level and the risk of hospitalisation.
The previously presented set of 24 QIs that were based on evidence from the German guidelines and adapted to the Swiss healthcare system, resulting in the establishment of the multidisciplinary SQIPRICA Working Group panels, includes process indicators (16), healthcare cost indicators (4) and outcome indicators (4). In general, a broad spectrum of QIs indicated a close association with patient outcome. In particular, the indicators relating to chronic illness care, care for the elderly, medication use and relatively simple measures of coordination (number of healthcare physicians) are considered beneficial predictors of a beneficial outcome. Diabetes process and outcome indicators such as the annual control of HbA1c were significantly associated with a lower risk of hospitalisation in the following year. This finding is strongly consistent with the results of previous investigations showing a clear decrease in hospital admissions by improvements in quality of diabetic management.41 42 Moreover, the compliance to indicators reflecting the quality of care in patients with respiratory diseases showed a positive association with outcomes, which is consistent with the result of previous studies.43 44
Furthermore, the present study emphasises the relevance of adverse drug reactions in the context of healthcare quality. Consistent with previous studies, polypharmacy and PIM were highly prevalent in patients aged 65 years or older, leading to an increased risk of hospitalisation and indicating intolerances and drug interactions among the elderly.22 45 46 Moreover, analyses of the high-risk groups showed a stronger association between polypharmacy or PIM and the hospitalisation risk in the following year compared with the total sample. This finding indicates the very high risk of adverse drug reactions in vulnerable patient groups and stresses that the awareness of drug safety should be urgently increased especially in high-risk patients suffering from multimorbidity and/or patients with high healthcare costs as indicator for a high burden of disease.47 48 Additionally, estimates referring to the different physician consultations revealed a relatively simple, but potent, predictor of outcome, which is consistent with the results of previous studies, indicating a better coordination in terms of the benefit of continuity of care together with improved quality of care.49 50 Interestingly, compared with ASS use, the use of statins after stroke or TIA was found to be highly protective (QI.24). Generally, for QIs relating to clinical events, the number of cases tends to be significantly small in a small country such as Switzerland for the comparison of practices, physician networks or regions (QI.21–24).
Additionally, the influenza vaccination was not positively associated with the outcome, which can be explained as follows: First of all, there is only a small proportion of patients who received an influenza vaccination (18%), which may reflect the inconsistent practice resulting from unclear medical recommendations in Switzerland. Moreover, we assume that the patients with influenza vaccination had a higher risk of hospitalisation since they reflect the sample with a high burden of disease. The results are likely to depict a selection of highly morbid patients. This explanation is in line with current study results from Switzerland which showed that influenza vaccination was significantly associated with a low self-reported health status and the occurrence of several chronic diseases such as diabetes mellitus and lung diseases (bronchial asthma, chronic bronchitis and emphysema).51
Prescription of generics (QI.4) and prescription of me-too medications (QI.5) indicated a slight increase in hospitalisation risk. We assume that these two measures are not useful in the Swiss healthcare system. The operationalisation of these QIs is not suitable since the two indicators are not markers for generics but rather for patient characteristics. Both were imported from Germany, where the market and the incentives for generics are different, and the definition of me-too drugs is also market-specific. Further research is needed to refine indicators reflecting inefficient medication prescriptions. In contrast, costs per DDDs do not seem to be negatively associated with quality, which is considered a positive finding when increasing the cost-efficiency of medication prescription.
Strengths and limitations
The present study has several strengths. First, it responds to the current public debates on quality assurance in ambulatory care. Second, this study evaluated the given Swiss adapted quality indicators for the first time in the Swiss healthcare setting and provides new insights for the stakeholder. Furthermore, the study findings might therefore contribute to encourage researchers to also evaluate their indicators and to publish the results. This might also help to increase acceptance of indicators and to increase transparency related to the development and evaluation of these measures. Third, the study was based on a large real-life data set of a broad spectrum of patients from all parts of Switzerland. Claims are available nationwide and underlie a standardised format and relatively high level of data control mechanisms. Fourth, the present project was based on a triangular approach consisting of (1) evidence from highly reliable sources, (2) adaptation to the local context and inclusion of the patient perspective and (3) data-based evaluation. However, several limitations also need to be considered. First, our study population was not entirely representative of the general Swiss population and had minor differences regarding sex, age groups and the region of residence, but the Helsana population covers insurers from all parts of Switzerland and includes all age groups and patient subgroups.52 53 A recently published Helsana study could show that the Helsana population is only slightly older (mean percentage difference (mean diff.) of all age groups: 0.04%), had a slightly higher percentage of women (diff.: 0.4%) and very slightly varied regarding overrepresentation/underrepresentation of persons in only a few cantons (eg, canton Geneva; mean diff. of all cantons: 0.64%).52 Second, considering the nature of claims data information about quality as reflected in patients’ satisfaction, communication and decision-making were not addressed. Third, clinical diagnoses from the outpatient setting were not available for adjustment in multivariate models. However, we used the well-established PCGs as proxies for ambulatory diagnoses to adjust for the differences in the risk of hospitalisation. Fourth, our results displayed the quality of healthcare from the mandatory health insurance perspective and did not include data from supplementary private insurance data. However, the basic mandatory insurance catalogue in Switzerland covers all services used for the present analysis. Finally, although we carefully adjusted for all variables that might interfere with hospitalisation risk available in our database, it is not possible to verify the causal association due to the cohort study design.
Implications for future studies
Several future research issues can be derived from our findings: Contrary to clinical events or relatively rare situations, future studies should predominately focus on highly prevalent chronic conditions (additional QIs). For the first attempts of implementation, it seems to be reasonable to focus on QIs reflecting chronic care and drug safety. Future QIs that focus on coordination and continuity of care would be also highly relevant. Moreover, the set of QIs might be supplemented by QIs derived from other sources such as the smarter medicine initiative. Additionally, the aspect of intersectoral problems, care coordination and interdisciplinary collaboration is not yet explicitly targeted in the current set of QIs. However, the issue is of increasing importance and a matter of ongoing political discussion.54 Additionally, the present study indicates that QIs focussing on specific clinical events such as myocardial infarction or stroke are limited by relatively small numbers of cases, which is even more relevant when small units such as care regions or specific patient strata should be monitored. Future studies are required to identify additional QIs targeting highly prevalent chronic conditions or clinical situations. Moreover, most of the indicators in the current set focussed on processes. Future studies are required to identify additional QIs measuring the quality of outcomes. Additionally, certain QIs such as influenza vaccination should be improved, supplemented or refined. Finally, future studies should evaluate if and how QIs derived from health insurance claims are supplemented with QIs derived from other sources (patient surveys, official statistics).
Conclusions
This is the first practice test of a previously proposed set of QIs that are principally available across Switzerland as they are based on the standardised format of Swiss health insurance claims data. The study revealed that constructing these indicators is feasible. Quality as measured by these QIs varies. The majority of QIs, in particular QIs reflecting chronic care and medication use, are considered beneficial markers of quality of care as they were associated with reduced risk of hospitalisation in the subsequent year. Furthermore, the study indicates that some QIs, such as influenza vaccination, require reevaluation and further refinement. In conclusion, the study is beneficial in identifying the starting points for initiatives to improve the quality of primary care in Switzerland. It provides further evidence when utilising the health insurance claims data available across all regions, healthcare settings and patient populations for assessing, monitoring and exchanging data on the quality of primary care.
Acknowledgments
We thank the Wiley Editing Service for professional proofreading of the manuscript.
References
Footnotes
Collaborators The Swiss Quality Indicator for Primary Care (SQIPRICA) Working Group members were: Dr med Felix Huber, Medical Director, MediX Group Practices Zürich, Zürich, Switzerland; Rahel Meier, MSc, Research Associate, Institute of Primary Care, University of Zürich, Switzerland; Dr med Jan von Overbeck, Cantonal Physician, Canton of Bern, Bern, Switzerland; Dr Oliver Reich, Head of Santé24, Swica Insurance, Winterthur, Switzerland; Professor Dr med Thomas Rosemann, Director, Institute of Primary Care, University of Zürich, Switzerland; Felix Schneuwly, Head of Public Affairs Swiss Online Comparative Service Comparis, Zürich, Switzerland; Professor Dr Martin Scherer, Director Department of General Practice/PrimaryCare, Hamburg University Medical School, Hamburg-Eppendorf, Hamburg, Germany; Professor Dr med Oliver Senn, Institute of Primary Care, University of Zürich, Zürich, Switzerland; Med Pract Daniel Tapernoux, Medical Advisor, Swiss Patient Organisation (SPO), Zürich, Switzerland.
Contributors All authors were involved in the study design. CAH, EB and MS conceived and designed the study. RR analysed the data. CAH drafted the manuscript. EB, RR, MS and the members of the Quality Indicator for Primary Care Working Group revised the manuscript. All authors participated in the interpretation of data, critically reviewed for important intellectual contents and gave the final approval of the version to be published.
Funding The authors have not declared a specific grant for this research from any funding agency in the public, commercial or not-for-profit sectors.
Competing interests None declared.
Patient consent for publication Not required.
Ethics approval According to the national ethical and legal regulation (the Swiss Federal Law of data protection), an ethical approval and patient consent were not required. Analyses were based on anonymised data.
Provenance and peer review Not commissioned; externally peer reviewed.
Data availability statement Data are available upon reasonable request. The data sets analysed in the study are not publicly available because they are part of the confidential Helsana health insurance claims database. Additional information not included in the paper is available from the corresponding author on reasonable request.