Article Text

Abstract
Objective To describe the evolution of the burden of chronic kidney disease (CKD) in Mexico by states, sex and subtypes from 1990 to 2017.
Design Secondary data analysis based on the Global Burden of Disease Study (GBD) 2017.
Participants Mexico and its 32 states. Data were publicly available and de-identified and individuals were not involved.
Methods We analysed age-standardised mortality rates, years of life lost (YLL) due to premature death, years lived with disability (YLD) and disability-adjusted life years (DALY), as well as the percentage of change of these indicators between 1990 and 2017.
Results From 1990 to 2017, the number of deaths, YLL, YLD and DALY due to CKD increased from 12 395 to 65 033, from 330 717 to 1 544 212, from 86 416 to 210 924 and from 417 133 to 1 755 136, respectively. Age-standardised rates went from 28.7 to 58.1 for deaths (% of change 102.3), from 601.2 to 1296.7 for YLL (% of change 115.7), from 158.3 to 175.4 for YLD (% of change 10.9) and from 759.4 to 1472.2 for DALY (% of change 93.8). The highest burden of CKD was for Puebla and the lowest for Sinaloa. It was also greater for men than women. By subtypes of CKD, diabetes and hypertension were the causes that contributed most to the loss of years of healthy life in the Mexican population.
Conclusions Mexico has experienced exponential and unprecedented growth in the burden of CKD with significant differences by states, sex and subtypes. Data from the GBD are key inputs to guide decision-making and focus efforts towards the reduction of inequities in CKD. These results should be considered a valuable resource that can help guide the epidemiological monitoring of this disease and prioritise the most appropriate health interventions.
- epidemiology
- nephrology
- health policy
- public health
This is an open access article distributed in accordance with the Creative Commons Attribution Non Commercial (CC BY-NC 4.0) license, which permits others to distribute, remix, adapt, build upon this work non-commercially, and license their derivative works on different terms, provided the original work is properly cited, appropriate credit is given, any changes made indicated, and the use is non-commercial. See: http://creativecommons.org/licenses/by-nc/4.0/.
Statistics from Altmetric.com
Strengths and limitations of this study
This is the first study in Mexico that jointly analyses the burden of chronic kidney disease (CKD) for premature death and disability for a period of 28 years (1990–2017).
From the Global Burden of Disease Study 2017, it was possible to show the wide disparities in the burden of CKD by states, sex and subtypes.
The main limitation is that the basis of the analysis was based on a secondary source that uses various models to correct and adjust national and subnational data, since the country does not have a registry of people with CKD.
Introduction
Chronic kidney disease (CKD) is considered as an epidemic, especially in low-income and middle-income countries where a greater number of cases have been documented.1–7 Of all the chronic non-communicable diseases, CKD has had one of the most rapid recent increases around the world.2 4 5 8 Between 1990 and 2017, the global standardised mortality rate increased by 41.5%, jumping from 11.4 to 16.1 deaths per 100 000 inhabitants.9 In 2016, CKD was the 16th leading cause of years of life lost (YLL) due to premature death worldwide, and if current trends continue, it will move to 5th place by the year 2040.10
Mexico has the 6th highest CKD mortality rate in the world.9 In 2017, CKD was the 2nd leading cause of death, only behind coronary artery disease; while in 1990, CKD was the 11th cause of death.9 Although Mexico does not have a CKD patient registry, it is estimated that in 2017 around 14.5 million people may have this illness, with an incidence rate of 394.2.9 The excessive growth of CKD prevalence has been related to the accelerated demographic and epidemiological changes in Mexico.11 The percentage of people 65 years of age or older increased from 5.3% in 1990 to 7.4% in 2019, and it is estimated that by 2050, it will reach a 16.8% of the total population.12 Also, diabetes and hypertension—two of the main causes of CKD—are highly prevalent in Mexico. According to data from the 2018 National Health and Nutrition Survey, 10.3% of the population 20 years of age or older reported having been diagnosed with diabetes and 18.4% with hypertension.13 That same survey found that 75.2% of adults in Mexico were overweight or obese,13 which are one of the main risk factors for developing non-transmittable diseases.
Life expectancy at birth in Mexico has increased marginally (especially for men) and with noticeable differences among states.12 Between 2000 and 2020, life expectancy at birth increased from 72 to 72.4 years for men and from 77.4 to 78.1 for women.12 Homicides, diabetes and CKD are the main causes of death that have contributed to the stagnation of life expectancy and to strengthen the gaps within the country.11 14 However, despite CKD’s epidemiological significance, there is little research related to the behaviour of the disease between men and women. Most national research has focussed on specific subnational regions and at certain points of time. This is partly as a result of scarce available information and shows only a partial view of the problem. For these reasons, the objective of this study is to describe the evolution of the burden of CKD in Mexico by states, sex and subtypes from 1990 to 2017. We expect that the results help to guide public policy that leads to an effective reduction of the incidence, prevalence and mortality of CKD, and provide decision makers with current information that allows them to focus resources where they are most needed.
Methods
Overview
This study consists of a secondary data analysis using the Global Burden of Disease Study (GBD) 2017,9 a project of the Institute for Health Metrics and Evaluation at the University of Washington.15 The GBD 2017 provides estimates of incidence, prevalence and years lived with disability (YLD) disaggregated by year, sex, cause and location between 1990 and 2017.3 16–18 Similarly, this study offers an independent estimate of disease burdens for 195 countries and territories, and uses a standardised, replicable approach in adherence to the Guidelines for Accurate and Transparent Health Estimates Reporting.16–19 Further, it includes 359 diseases and injuries, and 84 risks or combinations of risks,16–18 and employs different methods to correct coding errors, as well as the underreporting of deaths. The corrections made for misclassification and miscoding rely on evidence in medical literature, expert opinions and statistical techniques to assign the most probable causes of death to each entry.15
CKD was defined as a permanent loss of renal function, as indicated by an estimated glomerular filtration rate (eGFR) of <60 mL/min/1.73 m2 or albumin to creatinine ratio >30 mg/g.2 Cause of death from CKD was attributed using the International Statistical Classification of Diseases and Related Health Problems (ICD) 9-Version (codes: 403–404.9, 580–583.9, 585–585.9, 589–589.9, 753–753.3, 775.1) and 10-Version (codes: D63.1, E10–E11.9, I12–I13.9, N00–N08.8, N15.0, N18–N18.9, P70.2, Q61–Q62.8).16Data were disaggregated by CKD subtypes (type 1 diabetes (T1D), type 2 diabetes (T2D), arterial hypertension (AH), glomerulonephritis (GN) and other causes (OTH)) for comparison purposes.
Patient and public involvement
Patients and public were not involved in the recruitment and conduct of this study. The data used in this study are publicly available.
Measures of burden
GBD 2017 estimates mortality, YLL, YLD and disability-adjusted life years (DALY) rates with systematic methods previously published.10 18 20 21 GBD CKD death data consist of vital records and verbal autopsy data. In the GBD garbage codes, deaths with non-specific codes, deaths assigned to ICD codes that could not be underlying causes of death or deaths assigned to intermediate but not underlying causes of death were redistributed by age, sex, location and year to the most likely causes of death. The age-standardised mortality rate per 100 000 people was adjusted via the direct method applying the World Health Organization (WHO) global age structure. This method is a weighted average of the age-specific rates, for each of the populations to be compared that allows comparisons over time and states regardless of the size and age structure of the population.22 YLL are a measure of premature death within a group, calculated by subtracting the age at which a person in a given age group dies from the highest achievable life expectancy each year for that age group. A standard life expectancy at birth is used for this measure, derived from the lowest mortality rate found worldwide by sex and age, and representing the age to which any one in any country or region may hope to live.23 YLD were calculated as the product of the estimated prevalence of diabetes and a comorbidity-adjusted disability weight. DisMod-MR 2.1, a Bayesian meta-regression tool, was used to estimate the co-occurrence of different diseases by simulating 40000 individuals in each location–age–sex–year combination as being exposed to the independent probability of having any of the sequelae included in GBD 2017, based on disease prevalence. DALY quantify the health loss due to diabetes by measuring the difference between a current situation and an ideal situation in which everyone lives to the age of the standard life expectancy and in perfect health. DALY were calculated by adding the YLL and the YLD.17
Point estimates and 95% uncertainty intervals (UI) are reported. UI account for the variance in the parameter estimation, and incorporate the uncertainty accrued in the data collection, model selection and from other sources during the estimation process. The UI were based on 1000 model runs for each quantity of interest, with the mean considered to be the point estimate and the 2.5th and 97.5th percentiles.20 In some cases, the percentages of change in the indicators between 1990 and 2017 are presented.
Results
In Mexico, from 1990 to 2017, the number of deaths, YLL, YLD and DALY due to CKD increased from 12 395 to 65 033, from 330 717 to 1 544 212, from 86 416 to 210 924 and from 417 133 to 1 755 136, respectively. Age-standardised rates went from 28.7 (95% UI 28.3–29.3) to 58.1 (95% UI 56.4–59.5) for deaths (% of change 102.3), from 601.2 (95% UI 592.4–612.3) to 1296.7 (95% UI 1258.6–1327.4) for YLL (% of change 115.7), from 158.3 (95% UI 119.1–197.5) to 175.4 (95% UI 132.0–219.0) for YLD (% of change 10.9) and from 759.4 (95% UI 718.1–800.4) to 1472.2 (95% UI 1 420.2–1528.9) for DALY (% of change 93.8).
Analysis by states
From 1990 to 2017, the CKD mortality rate rose by 50% or more in every Mexican state. In Quintana Roo alone, the rate increased by 212% (95% UI 185.5–239.4). In 2017, Puebla had the highest CKD mortality rate (77.9, 95% UI 72.8–82.8), and Sinaloa the lowest (34.1, 95% UI 31.5–36.7); Puebla’s rate was 2.3 times higher than that of Sinaloa. Also, in 2017, 11 states had CKD mortality rates higher than the national rate: Puebla, Tlaxcala, Tabasco, Veracruz, Estado de México, Morelos, Guanajuato, Chiapas, Quintana Roo, Chihuahua and Coahuila (figure 1).
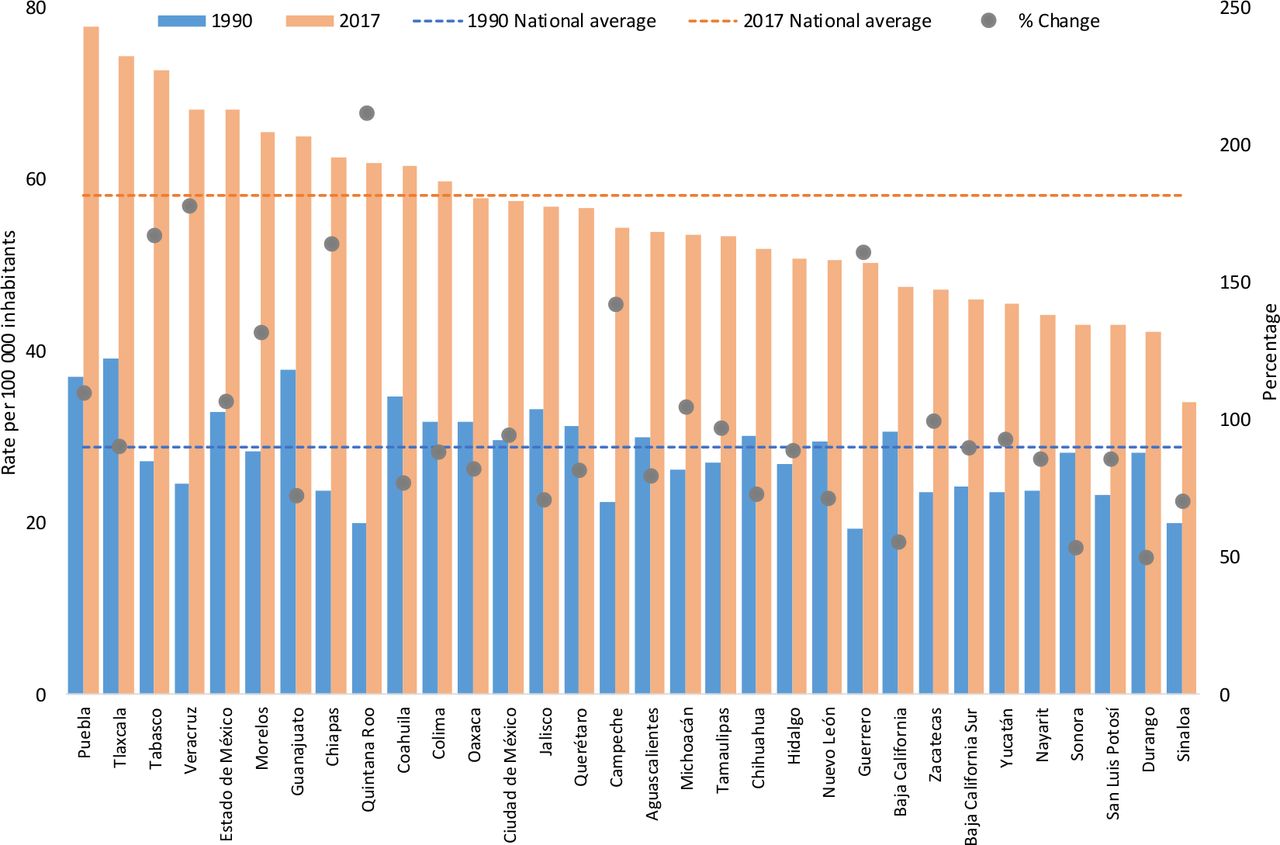
Age-standardised chronic kidney disease mortality rate by states, and per cent change between 1990 and 2017.
The maps displayed in figure 2 show the YLL and YLD rates by state in 2017, and the percentage of change of those rates between 1990 and 2017. Puebla, Tlaxcala and Tabasco had the highest YLL rates, also making them the states with the highest DALY rate in 2017. However, the most significant increases in YLL from CKD occurred in Chiapas, Quintana Roo, Tabasco and Veracruz; while the smallest changes in this rate were seen in Baja California, Durango, Sinaloa and Sonora (all states in northern Mexico). Although the YLD rates were much lower than YLL rates in every state, in states such as Guanajuato, the Estado de México, Tabasco and Veracruz, the YLD rate was over 186. Chiapas, Quintana Roo and Veracruz showed the highest YLD rate increase during the period studied, while Chihuahua, Durango and Morelos showed the least increase. Hidalgo was the only state in which the YLD rate from CKD decreased, by 6.2%.
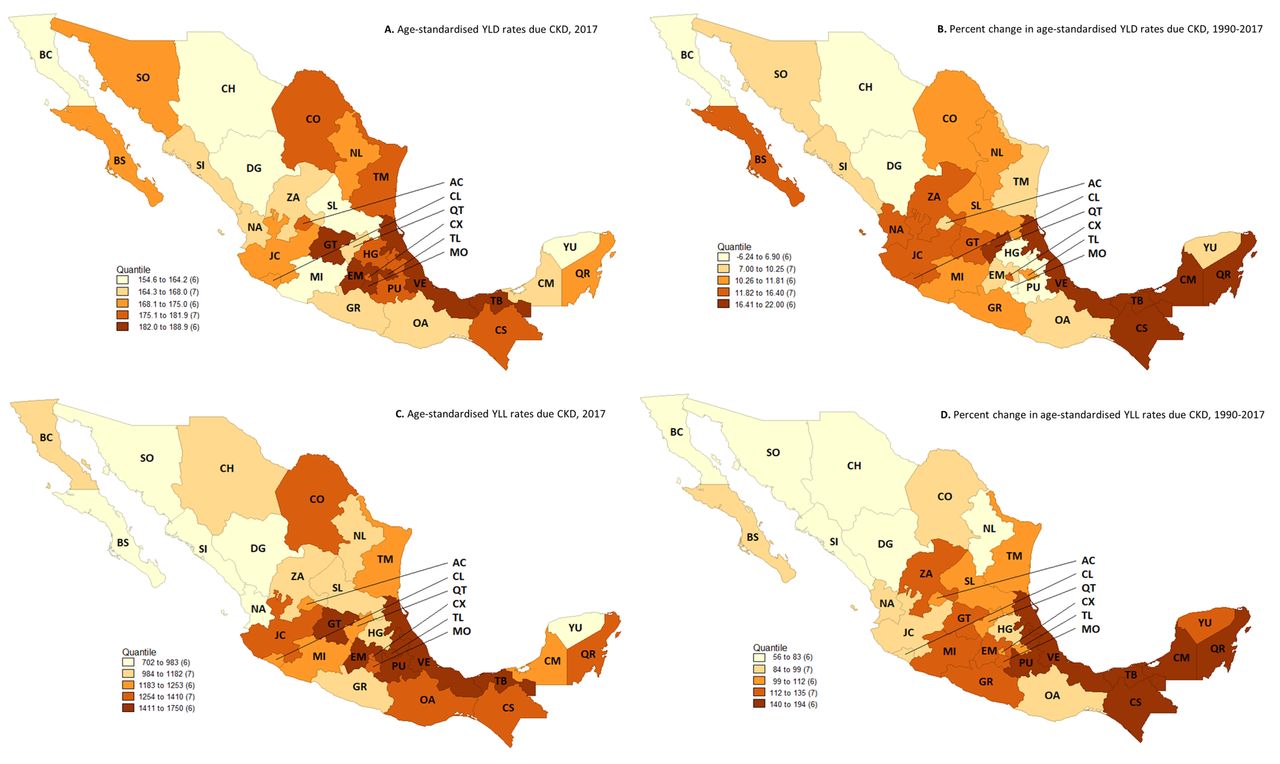
Maps of age-standardised years lived with disability and years of life lost rates due to chronic kidney disease in 2017, and per cent change from 1990 to 2017. AC, Aguascalientes; BC, Baja California; BS, Baja California Sur; CM, Campeche; CS, Chiapas; CH, Chihuahua; CO, Coahuila: CL, Colima; CX, Ciudad de México; DG, Durango; EM, Estado de México; GT, Guanajuato; GR, Guerrero; HG, Hidalgo; JC, Jalisco; MI, Michoacán; MO, Morelos; NA, Nayarit; NL, Nuevo León; OA, Oaxaca; PU, Puebla; QT, Querétaro; QR, Quintana Roo, SL, San Luis Potosí; SI, Sinaloa; SO, Sonora; TB, Tabasco; TM, Tamaulipas; TL, Tlaxcala; VE, Veracruz; YU, Yucatán; ZA, Zacatecas; YLL, years of life lost; YLD, years lived with disability.
Analysis by sex
Mortality rates for men and women showed a similar behaviour at the beginning of period, but in 2008 the male rate increased at a faster pace. Between 1990 and 2017, the CKD mortality rate increased by 122.3% for men and 84.4% for women. In 2017, the CKD-standardised mortality rate was 64.9 (95% UI 61.6–67.3) for men and 52.2 (95% UI 50.5–53.7) for women.
Disaggregating by subtypes of CKD, male mortality rate exceeded in all cases female mortality in 2017. However, until 2010 mortality rate for T1D and T2D was higher for women, but as of 2011 the pattern changed. The largest gap in the mortality rate between men and women was due to AH, GN and OTH (see online supplementary figure 1).
Supplemental material
As observed nationally, in most states the death rate from CKD was higher for men compared with women. The states where CKD mortality rates in 2017 were slightly higher for women were Campeche, Chiapas, Coahuila and Quintana Roo. The male mortality rate increased by more than 100% in 22 states, while in women these figures only occurred in seven states (in ascending order): Quintana Roo, Veracruz, Tabasco, Chiapas, Guerrero, Campeche and Morelos (table 1).
Age-standardised chronic kidney disease mortality rate by states and sex, and per cent change between 1990 and 2017
Analysis by CKD subtypes
In 2017, the distribution of CKD deaths by cause was 29.1% due to T2D, 23.1% due to AH, 21% due to GN, 20.2% due to OTH and 6.6% due to T1D. This year, the mortality rates were 17.2 (95% UI 14.9–19.7) due to T2D, 14.1 (95% UI 12–16.3) due to AH, 11.8 (95% UI 10–13.9) due to GN, 11.5 (95% UI 9.6–13.5) due to OTH and 3.5 (95% UI 2.7–4.4) due to T1D. For all subtypes of CKD, the mortality rates have increased by over 80% since 1990.
Table 2 presents the YLL and YLD rates for CKD, for total and by subtypes, as well as the per cent of change for these indicators between 1990 and 2017. Two findings should be highlighted: (1) the YLL rate was markedly higher than the YLD rate for all CKD causes and (2) CKD due to T1D represented the smallest health burden, while CKD due to OTH and CKD due to T2D had the largest burden in Mexico. Looking at rate changes for CKD from 1990 to 2017, the YLL rate increased by 115.7% (95% UI 107.6–121.8), and the YLD rate increased by 10.9% (95% UI 4.3–16.5). By 2017, the YLL accounted for about 88% of the total DALY rate.
Years of life lost and years lived with disability rates and per cent change for chronic kidney disease subtypes in Mexico, 1990 and 2017
Disparities among states for mortality rates by subtypes are shown in figure 3. Although the main contributor for CKD deaths is T2D, followed by AH, and OTH increased their importance more than half of the states, except in Baja California Sur, Guanajuato, Quintana Roo and Sinaloa, where the CKD rate due to T2D increased most; and in Colima, Morelos, Sonora, Tamaulipas and Tlaxcala, where the CKD rate due to AH increased most (see online supplementary table 1).

Age-standardised chronic kidney disease mortality rates by states and subtypes in Mexico, 1990 and 2017. T1D, type 1 diabetes; T2D, type 2 diabetes; GN, glomerulonephritis; AH, arterial hypertension; OTH, other causes.
Discussion
This study presents for the first time in Mexico an integral analysis of CKD’s associated deaths, premature deaths and disability burden by states, sex and subtypes. The results reaffirm the severity of the grave and growing problem that is CKD.11 24 25 This study reveals a broad heterogeneity in the disease’s behaviour in the Mexican states, reinforcing long-prevailing regional health inequities.11 This occurs in a context characterised by accelerated demographic processes, a dissonant epidemiological transition and profound socioeconomic disparities.11 12 24 25
The most striking feature of these results is the staggering increase of the CKD mortality rate between 1990 and 2017. During this period, the increase was 2.8% globally, 33% in Latin America and the Caribbean and 102.3% in Mexico. In addition, seven states of the country appear on list with the highest mortality rates from this cause in the world: Puebla (1), Tlaxcala (2), Tabasco (3), Veracruz (5), Estado de México (6), Morelos (8) and Guanajuato (10).9 This remarkable rise seems to be irreversible in the short term as CKD is one of the least treated of all non-communicable diseases, and thus where one of the largest health divergence is found. According to González-Pier et al, CKD mortality rate in Mexico will decrease only by 16.4% by 2030,26 an insufficient change if we consider the goal of reducing premature deaths by 40% proposed in the sustainable development goals.27 28
We also found that men have a greater mortality rate for CKD than women, and the gap continues to increase, especially since 2008, when ICD-10 came into effect in the country, possibly resulting in a better registry of this cause of mortality. It is known that CKD prevalence is higher in women, but men have a higher mortality rate at all levels of eGFR, though this difference disappears for patients on renal replacement therapy (RRT).8 29 30 However, recently it was reported that in most regions, the mortality rate due to diabetic kidney disease was higher for women,31 contrary to what has happened in the Mexican population in recent years. As we found in this study, female mortality rate from diabetes (type 1 and 2) was exceeded by that of men since 2010. While the death rate of women seems to decrease gradually, that of men is rising. This coincides with the fact that mortality due to T2D in people aged 15 years or older in Mexico has increased by around 50% for men and 10% in women between 1990 and 2017.32 The data also indicate that Mexican men receive less information regarding this disease than women, in addition to that, in general, people with T2D do not take controls to avoid or delay their complications, such as physical activity or modify the diet.33
The differences by sex have been under-analysed, and little is known about the role that gender has regarding the progression and outcome of the various chronic diseases,8 29 31 therefore, it is necessary that future research explores this subject in depth. This gender approach from nephrology has been incipient to understand the behaviour of CKD to establish focalised and personalised interventions. Despite this situation, some authors argue that in the pathophysiological expressions of CKD in both men and women, environmental factors and social determinants interact to determine the occurrence, progression and outcomes of the disease.8 29 31 It is possible that male higher CKD mortality in Mexico is explained by their lower use of health services, a lower adherence to treatments and psychological variables that influence their healthcare habits. These are hypothesis that must be addressed, researched and corroborated in future analysis.
In this study, we confirm that, as in worldwide, in Mexico diabetes and hypertension are the main contributors of CKD deaths accounting for half of these deaths. International data show that up to 30% of adults aged 20 years or older with diabetes develop nephropathy,6 while 25% of CKD cases are attributed to hypertension.34 These facts stress the need of screening of CKD in people with diabetes and hypertension in the primary healthcare setting. Nevertheless, in Mexico there is an underreporting of cases due to the lack of a national registry of patients with CKD and other conditions, which limits the possibility of accurately estimating the consequences of these diseases on the health of the population.24 25
It is important to mention the growing burden of CKD due to other causes, like the ‘mesoamerican nephropathy’. The combination of environmental and behavioural risk factors is making Mexican states become CKD hotspots, with levels higher than other countries in the world.35–38 Mexico is regarded as an endemic geographic region where air pollution increases CKD prevalence. In 2016, the age-standardised DALY rate per 100 000, attributable to ambient fine particulate matter was 408.4 (95% UI 283.82–551.84).39 Several authors argue the need to promote and deepen about the origins hitherto ‘unknown’ of the CKD, to identify potential risk factors and highly vulnerable populations that lack specific diagnostic interventions and attention.35–39
On the other hand, these variations in CKD burden of disease among Mexican states are strongly determined by the subdiagnosis related with this and other chronic diseases, and by limitations in healthcare availability, access and quality.24 25 40 41 The country’s most marginalised areas—where the highest increase of CKD patients is found—are home to the lowest concentrations of health resources (clinics, doctors, nurses, medical equipment and so on),40 41 resulting in late diagnoses and suboptimal treatment. Mexico has few nephrologists and dialysis and haemodialysis centres, and almost all of them are in the nation’s main urban centres, prohibitively far from many patients. In 2017, the country reported having 920 nephrologists, of whom 21% (193) were affiliated with the Ministry of Health.42 Of these 193, 43 were in Mexico City, the capital, while 20 other states had fewer than six of these specialists.42 These statistics place Mexico far below international standards.43–45
Finally, the Mexican health system is inadequate to prevent and give appropriate care to CKD patients. Access to dialysis and RRT is limited to access to social security services, but it is not part of the essential public health package for people without health insurance. Screening is not a routine in the first level of attention, even for high-risk populations (people living with diabetes or hypertension). In these restricted conditions, those with CKD are among the nation’s poorest residents and have serious limitations in their access and continuity to RRT.1 24 25 46–48 Therefore, they must incur in catastrophic out-of-pocket spending for paying for their treatment, affecting their quality of life and often their own survival.25 One recent study reported that the 3-year mortality rate of CKD patients requiring RRT in Mexico who did not have social security was 56.7%.48 Those patients who did have a health service providing RRT showed a 3-year mortality rate of 38.2%.48 Thus, patients without health insurance were 2.64 times more likely to die from CKD than those who did.48 Therefore, socioeconomically disadvantaged populations present a disproportionate burden of CKD often amplified by the inability to receive adequate medical and health.1 24 46 48–52
Limitations and strengths
One limitation of this study is that available CKD information may be under-reported, owing to the high per cent of undiagnosed cases; however, the GBD methodology employs statistical techniques that decrease the biases inherent in the estimation of this information. It is necessary to continue to strengthen national registries in order to have more precise data on this disease and its consequences. Another limitation is that this is a descriptive study. Thus, it is required that future research addresses the main risk factors that influence the CKD burden of disease and its social determinants. As shown, the poorest states have the worst indicators. Strengths of this report’s findings include the analysis of CKD estimates of mortality and disability at the national and state level, as well as by sex and subtypes for a period of almost 30 years.
Conclusion
In the last 28 years, Mexico has experienced an exponential and unprecedented growth in the burden of CKD with significant differences by states, sex and subtypes. Data from the GBD are key inputs to guide decision-making and focus efforts towards the reduction of inequities in CKD. Given the lack of a national registry of people with renal disease, these results should be considered a valuable resource that can be used to help guide the epidemiological monitoring of this disease and prioritise the most appropriate health interventions for each context. In general, for the country, it is necessary to promote the knowledge of CKD—mainly in high-risk population, strengthen the diagnosis and control in early stages of the disease, reinforce institutional capacity through training of health personnel—especially the first level of care, increase the formation of nephrologists, expand the supply and quality of RRT, encourage kidney donation, as well as ensure immunosuppression. Likewise, it is essential to decentralise dialysis and haemodialysis units, particularly in most poor states, to have a nominal patient registry and to design financing schemes that guarantee comprehensive care, in order to reduce catastrophic expenses and impoverishment derived from this disease.
References
Footnotes
MA-B and RV-O are joint first authors.
Twitter @rafavaldeznefro, @mario_rojas
Collaborators Andrés Quintero-Leyra, Sofía Rodríguez-Contreras.
Contributors MA-B, CD-C and RV-O conceived and designed the study. LC-H and MFR-H extracted and systematised the data. MR-R, LG-R and DM-L interpreted and analysed the results. MA-B, CD-C, MCG-R, LG-R and MR-R wrote the draft of the paper. CD-C and LC-H contributed to the elaboration of the figures. All authors participated actively in the review process and made significant contributions to the final version of the manuscript.
Funding This research was supported by the DGAPA/UNAM, through of Program to Support Research Projects and Technological Innovation (PAPIIT) (Nº IA304119).
Map disclaimer The depiction of boundaries on this map does not imply the expression of any opinion whatsoever on the part of BMJ (or any member of its group) concerning the legal status of any country, territory, jurisdiction or area or of its authorities. This map is provided without any warranty of any kind, either express or implied.
Competing interests None declared.
Patient consent for publication Not required.
Ethics approval Ethical approval was not obtained because the data included in this study were publicly available and de-identified data.
Provenance and peer review Not commissioned; externally peer reviewed.
Data availability statement Data are available in a public, open access repository. All data relevant to the study are included in the article or uploaded as supplementary information. The data used in this manuscript are available online through the GBD Data Visualisations: https://vizhub.healthdata.org/gbd-compare/.