Article Text

Abstract
Objectives We aimed to investigate the socioeconomic inequalities in the burden of underweight and overweight among children in South Asia. We also examined other factors that were associated with these outcomes independently of household’s socioeconomic status.
Design Nationally-representative surveys.
Settings Demographic and Health Surveys from Bangladesh, India, Pakistan, Maldives and Nepal, which were conducted between 2009 and 2016.
Participants Children aged 24 to 59 months with valid measurement for height and weight (n=146 996).
Primary exposure and outcome measures Primary exposures were household’s wealth index and level of education. Underweight and overweight were defined according to the WHO and International Obesity Task Force definitions, respectively.
Results Underweight prevalence was 37% in Bangladesh, 38% in India, 19% in Maldives, 29% in Nepal and 28% in Pakistan. Bangladesh, India and Nepal had similar overweight prevalence (between 2% and 4%) whereas Pakistan (7%) and Maldives (9%) had higher prevalence. Households with higher wealth index or education had lower odds of having underweight children. Adjusted ORs of underweight for richest versus poorest households were 0.4 (95% CI: 0.3 to 0.5), 0.5 (95% CI: 0.5 to 0.6), 0.5 (95% CI: 0.2 to 1.4), 0.5 (95% CI: 0.3 to 0.8) and 0.7 (95% CI: 0.5 to 1.1) for Bangladesh, India, Maldives, Nepal and Pakistan, respectively. Compared with poorest households, richest households were more likely to have overweight children in all countries except Pakistan, but such associations were not significant after adjustment for other factors. There were higher odds of having overweight children in households with higher education in Bangladesh (OR 2.1 (95% CI: 1.3 to 3.5)), India (OR 1.2 (95% CI: 1.2 to 1.3)) and Pakistan (OR 1.8 (95% CI: 1.1 to 2.9)) when compared with households with no education. Maternal nutritional status was consistently associated with children’s nutritional outcomes after adjustments for socioeconomic status.
Conclusions Our study provides evidence for socioeconomic inequalities for childhood underweight and overweight in South Asian countries, although the directions of associations for underweight and overweight might be different.
- double burden
- underweight
- overweight
- under-five children
- socioeconomic status
- South Asia
This is an open access article distributed in accordance with the Creative Commons Attribution Non Commercial (CC BY-NC 4.0) license, which permits others to distribute, remix, adapt, build upon this work non-commercially, and license their derivative works on different terms, provided the original work is properly cited, appropriate credit is given, any changes made indicated, and the use is non-commercial. See: http://creativecommons.org/licenses/by-nc/4.0/.
Statistics from Altmetric.com
Strengths and limitations of this study
This is the first study to investigate the double burden of malnutrition among children aged under 5 years in South Asian countries, using nationally-representative samples.
We used height and weight information which were measured by trained research personnel.
Use of International Obesity Task Force classification to define overweight ensures cross-comparison of estimates with those from other regions.
Although we adjusted for several child, household and maternal factors when examining the associations of socioeconomic status with underweight and overweight, we did not have information on many dietary and lifestyle factors that could modify those associations.
We examined the effects of other factors on childhood underweight and overweight after adjustment for household’s socioeconomic status.
Introduction
Double burden of malnutrition implies the presence of both undernutrition and overnutrition (overweight or obesity) either at the individual, household or population level.1 At the individual level, an undernourished child can be overweight or obese when they reach adulthood, whereas at household level coexistence of undernourished and overweight children or adults can be possible. At the population level, double burden of malnutrition indicates the presence of both undernutrition and overnutrition in the same community, country or region. Undernutrition can be assessed by underweight (low weight-for-age), wasting (low weight-for-height) and stunting (low height-for-age).2 Wasting and stunting reflect acute weight loss and long-term growth restriction, respectively; whereas underweight indicates wasting, stunting or both.
Double burden of malnutrition is an emerging problem in the low- and middle-income countries (LMICs), including South Asian countries.1 3 Historically, these countries have a considerable burden of undernutrition in children,4 5 for example, according to the World Report on Nutrition 2018,6 approximately 39% of all stunted children were from this region. But there has been growing evidence that the number of children with overweight and obesity is also increasing in recent years in South Asian countries, particularly due to economic growth, rapid urbanisation and adoption of western lifestyles.7–10 Ensuring optimum nutrition in early years of life is an important public health agenda, mainly because both undernutrition and overnutrition in these years are associated with a wide range of morbidities in early life as well as in later life.11 12
Understanding the socioeconomic inequalities in nutritional outcomes in LMICs is essential to seize programme and policy opportunities to address malnutrition in both forms. The associations of socioeconomic status with undernutrition and overnutrition might be different in LMICs to those in high-income countries. In high-income countries, overweight in children is associated with poorer socioeconomic conditions,13–15 but it is not clear whether lower socioeconomic status can increase the likelihood of children with overweight in LMICs too. It has been consistently shown that children in poorer households are more likely to be underweight than those in richer households.16 17 Moreover, identifying other factors that might influence nutritional outcomes independently of socioeconomic status will help to develop effective public health interventions.
While many studies separately examined the burden of undernutrition or overnutrition, studying both outcomes together in a population can inform the relevant stakeholders on seizing intervention and policy opportunities to tackle childhood malnutrition in more holistic ways. So far, studies looking at the issue of the double burden of malnutrition in South Asian countries focussed mainly on the coexistence of overweight or obese mother and underweight or stunted child within the same household.16 18 19 While studying double burden of malnutrition, it is also essential to study the burden and underlying factors of childhood underweight, stunting and wasting because they are very different constructs of undernutrition. To the best of our knowledge, no study looked at the double burden of malnutrition among children aged under 5 years in South Asian countries.
This study uses data from the Demographic and Health Surveys (DHS), which provide nationally-representative estimates for a wide range of monitoring and impact evaluation indicators in the areas of population, health and nutrition.20 While these surveys provide the prevalence of underweight and overweight among children by socioeconomic status, it is essential to understand the associations between them taking account of other factors that might confound such associations. In this study, we aimed to investigate the associations of household’s wealth index and highest education level with the prevalence of underweight and overweight among children aged 24 to 59 months in five South Asian countries. Also, we explored which other factors can influence childhood underweight and overweight independently of household’s socioeconomic status.
Methods
Study design and data sources
This study is based on the latest DHS data from five South Asian countries, namely Bangladesh, India, Pakistan, Maldives and Nepal. Other countries in the South Asian regions (eg, Afghanistan, Bhutan and Sri Lanka) were not included in this study because of either DHS was not conducted, or anthropometric data for children were not available. The included surveys were conducted in 2014, 2015 to 2016, 2009, 2016 and 2012 to 2013 for Bangladesh, India, Maldives, Nepal and Pakistan, respectively.
DHS are nationally-representative household surveys which are usually conducted about every 5 years. These surveys provide data for a wide range of monitoring and impact evaluation indicators in the areas of population, health and nutrition. A DHS is conducted by a national implementing agency, which can be any bonafide governmental, non-governmental or private-sector organisation and has enough experience in the execution of surveys that are national in scope. Technical assistance throughout the whole process is provided by the DHS programme.20
DHS is usually based on a two-stage stratified sampling of households. In the first stage, sampling census enumeration areas are selected using probability proportional to size sampling technique through statistics provided by the respective national statistical office. In the second stage, households are selected through systematic random sampling from the complete listing of households within a selected enumeration area.21
Informed consent to participate in the study is taken from the participant, or from the parent or guardian if anthropometric measurements are taken from a child. The data files are freely available from the programme website. We received authorisation from the DHS programme for using the relevant data sets for this analysis. The data we received were anonymised for protection of privacy, anonymity and confidentiality.
These surveys have a very high response rate, usually 90% and above. Detailed questionnaires of included surveys are available in the final report of each survey. We used the children's record (coded as ‘KR’ in DHS programme) data sets which contained information about children born in the last 5 years prior to the survey (aged 0 to 59 months). The present analysis is based on children aged 24 to 59 months who had a valid measurement of their weight and height. We excluded children aged less than 24 months because most of the available classification system for defining childhood overweight starts from 24 months.22 23 Flowchart of study participants included in this analysis is given in online supplementary figure S1.
Supplemental material
Anthropometric measurement, and defining undernutrition and overnutrition
In DHS, height and weight of the children were measured by trained personnel using standardised instruments and procedures. Lightweight SECA scales (Hamburg, Germany) with a digital screen, designed and manufactured by the UNICEF, were used to measure weight. The height/length was measured by boards, produced by Shorr Productions (Maryland, USA). In children with height less than 85 centimetres, the recumbent length was measured, whereas standing height was measured for taller children. Body mass index (BMI) was calculated by dividing body weight (kg) by squared height (m2).
While each indicator of child undernutrition reflects distinct aspects undernutrition, we assessed undernutrition mainly by underweight in this study. Childhood underweight indicates the overall population's nutritional status, and is a composite indicator which can encompass stunting, wasting or both. According to the WHO guidelines,2 a child with weight-for-age less than two standard deviations (−2 SD) from the median of the reference population was considered as underweight.
To define childhood overweight, we used the age-specific and sex-specific BMI cut-offs from the International Obesity Task Force (IOTF) classification system.23 24 According to IOTF, a child aged between 2 years and 18 years is classified as overweight if their BMI is larger than the age-specific and sex-specific BMI cut-off corresponding to an adult BMI of >25 kg/m2. Our definition of childhood overweight also included those with obesity and it is referred to hereafter as ‘overweight’ for simplicity.
Covariates
DHS collected information on a wide range of variables from the selected households using a face-to-face interview with the respondents conducted by trained personnel. DHS collected information on socioeconomic factors like the area of residence and household's wealth index. Place of residence (rural and urban) was defined according to country-specific definitions. Household's highest education level was based on the educational attainment of the child's mother and father. For household's wealth index, each national implementing agency constructed a country-specific index using principal components analysis from data on household assets including durable goods (ie, bicycles, televisions, etc) and dwelling characteristics (ie, sanitation, source of drinking water and construction material of house, etc).25 This wealth index was then categorised into five groups (ie, poorest, poorer, middle, richer and richest) based on the quintile distribution of the sample.
We also included indicators of child's exposure to nutrition-sensitive interventions (focussing on the underlying determinants of malnutrition) such as receiving vitamin A in the last 6 months and receiving the deworming drug in the last 6 months.26 Households with flush toilet, ventilated improved pit latrine, traditional pit latrine with a slab or composting toilet were considered to have improved access to sanitation, whereas households with improved access to drinking water were considered if they had connection (piped), public standpipe, borehole, protected dug well or spring or rainwater collection.
Statistical analysis
We conducted all analysis following the instructions given in the DHS guide to analysis.21 Considering the two-stage stratified cluster sampling in DHS, we applied Stata's survey estimation procedures (‘svy’ command) for the estimation of proportions, means and regression analysis.27
The per cent distributions for characteristics of included children are described as proportions, for each DHS survey. To estimate the prevalence of childhood underweight and overweight, we used sampling weights given in each DHS data set in order to get nationally-representative estimates. 95% CIs for prevalence estimates were calculated using a logit transform of the estimate. We also estimated the prevalence of childhood underweight and overweight by the levels of socioeconomic factors to assess the inequalities by those factors.
To examine the associations of socioeconomic factors (ie, household's wealth index and household's highest level of education) with the prevalence of childhood underweight and overweight, we used multiple logistic regression, separately for each included country. At first, these analyses were minimally-adjusted for child's age and sex; and then they were adjusted for the child's exposure to nutrition-sensitive interventions, area of residence, access to improved sanitation and to improved drinking water, number of under-five children in household, mother's age at first birth, mother’s height and mother's BMI. Missing data in the adjustment variables (usually less than 5%) were considered as separate categories so that the same children were compared in all analyses. To explore which factors can influence the prevalence of childhood underweight and overweight after accounting for household's socioeconomic status, we estimated the ORs for all child-level, household-level and maternal-level factors with adjustment for household's wealth index and highest level of education.
All analyses were additionally conducted for childhood stunting and wasting. Stunting and wasting were defined respectively as height-for-age less than two standard deviations (−2 SD) and weight-for-height less than two standard deviations (−2 SD) from the median of the reference population.2
All analyses were performed using Stata V.15.1 (Statacorp, College Station, Texas, USA). All statistical analyses were two-sided and p value <0.05 was considered as statistically significant.
Patient and public involvement
Patients and the public were not involved in the development of research questions, design of the study, recruitment and conduct of the study or dissemination of the study results.
Results
A total of 146 996 children aged between 24 and 59 months from five south Asian countries were included in this study. Table 1 shows the characteristics of the study population for each of these countries. There were almost equal distributions for both sex and age in all country samples. At least half of the children in all countries received vitamin A in the last 6 months. While Maldives and Nepal had excellent coverage (80% or more) for deworming drugs, only about one in three children received the deworming drug in India and Pakistan. Majority of the children were from the rural area except in Nepal, and the proportions varied widely between 43% and 86%. Overall, most of the households had access to improved sanitation and drinking water supply, except the percentages of household with access to improved sanitation are particularly low in Bangladesh and India. The proportions of household with no formal education were particularly high in India, Nepal and Pakistan. More than half of the households in Bangladesh and India had members who completed secondary or higher education. The samples from original surveys were divided into quintiles based on the household’s wealth index, and after relevant exclusions, the distributions remained more or less similar for this study. India, Maldives and Pakistan had households with a median of two children aged under 5 years, while Bangladesh and Nepal had a median of one child per household. Most mothers were less than 25 years old at their first birth. The prevalence of mothers with underweight was higher in Bangladesh (20%) and India (23%) than in other countries, whereas the prevalence of mothers with overweight was higher in Maldives (42%) and Pakistan (37%) than in other countries.
Sample characteristics in five demographic and health survey data, by country
As expected, the prevalence of underweight was much higher than the prevalence of overweight in all five countries (figure 1 and online supplementary table S1). India had the highest (38%) prevalence of underweight among children aged 24 to 59 months followed by Bangladesh (37%), Nepal (29%), Pakistan (28%) and Maldives had the lowest prevalence (19%). For overweight among these children, Bangladesh, India and Nepal had similar prevalence (between 2% and 4%) whereas Pakistan and Maldives higher prevalence, 7% and 9%, respectively. When we looked at the combined prevalence of both forms of malnutrition, India (42%) and Bangladesh (39%) had a much higher burden compared with other countries (Maldives (28%), Nepal (32%), Pakistan (36%)) (figure 1). The prevalence of underweight was particularly low in Maldives and Pakistan, but they had a higher prevalence of overweight. Bangladesh, India, Nepal and Pakistan had high prevalence of childhood stunting (between 42% and 48%), whereas only 17% of children in Maldives were stunted (online supplementary table S2). The prevalence of children with wasting was highest in India (18%) and lowest in Nepal (6%) (online supplementary table S3).

Prevalence of underweight and overweight, by country sampling weights provided by the Demographic and Health Survey and Stata’s survey estimation procedures were used to estimate country-representative prevalence. Corresponding 95% CIs of prevalence estimates are given in online supplementary table S2.
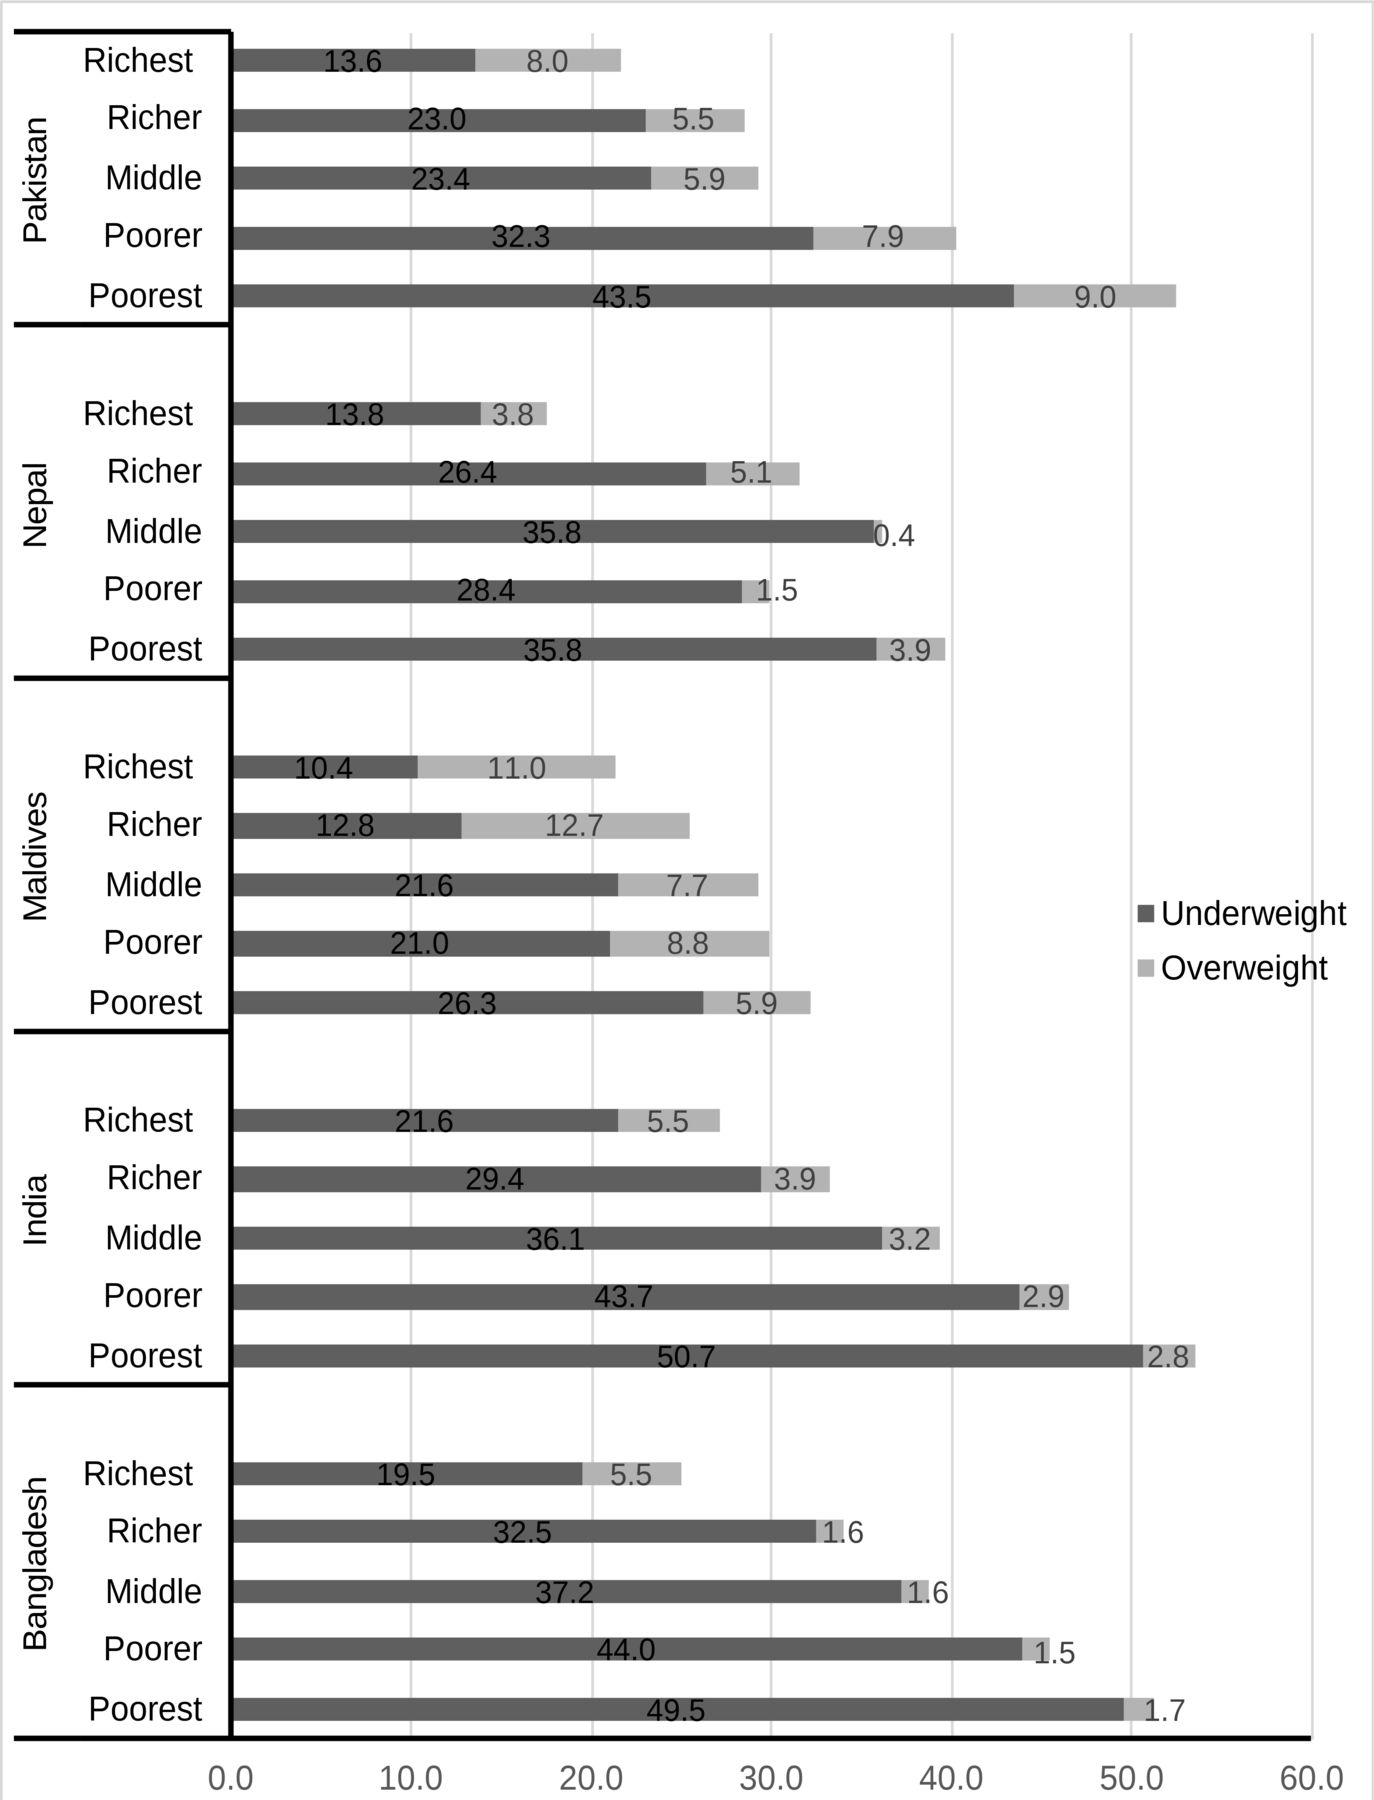
The prevalence of underweight and overweight varied widely according to both the household’s wealth index in all countries (figure 2). Between the poorest and the richest households, the burden of undernutrition decreased by more than half. On the other hand, the richest households in Bangladesh and India had almost two times higher prevalence of overweight than the poorest households. Such clear differences were not evident in Maldives and Nepal, while the richest households were less likely to have overweight children compared with poorest households in Pakistan. The prevalence of underweight and overweight according to the household’s highest education level followed similar country-specific patterns observed for wealth index (figure 3). Notably, children in households with higher education had higher burden of overweight in Bangladesh, India and Pakistan than children in no or little education. Similar trends were observed for stunting and wasting prevalence by household’s socioeconomic status (online supplementary tables S2 and S3).

Prevalence of underweight and overweight, by household’s wealth index. Sampling weights provided by the Demographic and Health Survey and Stata’s survey estimation procedures were used to estimate country-representative prevalence. Corresponding 95% CIs of prevalence estimates are given in online supplementary table S2.

Prevalence of underweight and overweight, by household’s highest level of education. Sampling weights provided by the Demographic and Health Survey and Stata’s survey estimation procedures were used to estimate country-representative prevalence. Corresponding 95% CIs of prevalence estimates are given in online supplementary table S2.
Table 2 shows the minimally-adjusted and fully-adjusted associations of household’s wealth index and highest education level with the prevalence of underweight and overweight. There was strong evidence of an inverse relationship between the household’s wealth index and the prevalence of underweight in children, which was not attenuated even after adjustment for a wide range of covariates except for Maldives and Pakistan. Compared with the poorest households, the richest households were less likely to have children with underweight (adjusted OR for Bangladesh 0.4 (95% CI: 0.3 to 0.5), India 0.5 (95% CI: 0.5 to 0.6), Maldives 0.5 (95% CI: 0.2 to 1.4), Nepal 0.5 (95% CI: 0.3 to 0.8) and Pakistan 0.7 (95% CI: 0.5 to 1.1). For the household’s highest education level, we also observed that households with secondary or higher education were less likely to have children with underweight when compared with households with no education. The adjusted OR for higher education versus no education was 0.7 (95% CI: 0.6 to 1.0) for Bangladesh, 0.6 (95% CI: 0.5 to 0.6) for India, 0.5 (95% CI: 0.1 to 1.7) for Maldives, 0.6 (95% CI: 0.4 to 0.9) for Nepal and 0.4 (95% CI: 0.3 to 0.7) for Pakistan. Additional analyses for childhood stunting and wasting yielded similar associations with household’s wealth index and highest level of education (online supplementary tables S4 and S5).
Associations of household’s wealth index and highest education with childhood underweight and overweight
Table 2 also shows that the richest households were more likely to have children with overweight than the poorest households in all countries except Pakistan. However, the positive associations between household’s wealth index and overweight prevalence in children were not significant after adjustment for other variables. The adjusted ORs were 1.3 (95% CI: 0.8 to 2.2) for Bangladesh, 1.1 (95% CI: 1.0 to 1.2) for India, 0.5 (95% CI: 0.2 to 1.4) for Maldives and 1.2 (95% CI: 0.5 to 2.9) for Nepal. In Pakistan, the richest households are less likely to have overweight children, which remained significant after adjustment for other variables (adjusted OR 0.1 (95% CI: 0.1 to 0.2)). Household’s education level was also positively associated with the prevalence of overweight in children. When compared with households with no formal education, households with higher education had higher odds of having overweight children in Bangladesh (OR 2.1 (95% CI: 1.3 to 3.5)), India (OR 1.2 (95% CI: 1.2 to 1.3)) and Pakistan (OR 1.8 (95% CI: 1.1 to 2.9)). Maldives and Nepal had fewer households with higher education, but the adjusted ORs for secondary versus no education were 2.3 (95% CI: 1.7 to 3.1) and 1.8 (95% CI: 1.1 to 3.1), respectively.
We then explored the associations of other factors with underweight and overweight among children after accounting for household socioeconomic status (table 3). Factors like living in rural, improved access to sanitation and to drinking water, older maternal age at first birth, low maternal height and maternal underweight were significantly associated with childhood underweight in some but not all countries. Maternal underweight was consistently found to be associated with increased odds of childhood underweight (adjusted OR vs normal weight in Bangladesh 1.9 (95% CI: 1.6 to 2.3), in India 1.7 (95% CI: 1.7 to 1.8), in Nepal 2.1 (95% CI: 1.6 to 2.9) and in Pakistan 2.0 (95% CI: 1.4 to 2.7)). Low maternal height was also strongly associated with childhood underweight, stunting and wasting, although the strength of associations varied by the definitions of undernutrition (table 3 and online supplementary tables S6 and S7).
Socioeconomic status-adjusted ORs of underweight and overweight for various child, household and maternal factors
For childhood overweight, maternal overweight was found to be associated with increased odds in Bangladesh (OR 1.9 (95% CI: 1.2 to 3.0)), India (OR 1.3 (95% CI: 1.2 to 1.4)) and Pakistan (OR 1.8 (95% CI: 1.4 to 2.5)), but not in Maldives (OR 1.3 (95% CI: 0.9 to 2.0)) and Nepal (OR 0.9 (95% CI: 0.3 to 2.2)). In Pakistan, those children who received vitamin A or deworming drug in the last 6 months were less likely to be overweight than those who did not receive those interventions. For India and Pakistan, improved access to sanitation and drinking water were significantly associated with childhood overweight, although the directions of such associations were not consistent.
Discussion
This study involving nationally-representative surveys conducted in recent times in five South Asian countries provided empirical evidence on the burden of underweight and overweight among children aged 24 to 59 months, and their associations with socioeconomic status factors. We found that there was a substantial burden of undernutrition among younger children in South Asian countries, while a differential burden of overnutrition was also seen. Households with higher socioeconomic status (as measured by wealth index and the highest level of education) were associated with lower odds of underweight children, although some of those associations did not reach statistical significance after adjustment for related factors. Household’s socioeconomic status and childhood overweight were positively associated in all countries except Pakistan, but results from fully-adjusted models indicated that such associations could be explained by other factors. Households with higher wealth or education were less likely to have children with overweight only in Pakistan. After taking household’s socioeconomic status into account, maternal nutritional status was found to be strongly associated with the child’s nutritional status, whereas evidence for associations with other factors was inconsistent across countries.
South Asian countries have experienced a striking economic growth in the last few decades, which triggered unprecedented improvements in maternal mortality, infant mortality, under-five mortality and child undernutrition.28 29 Trends in the prevalence of childhood underweight have been declining in these countries, with almost 25% to 30% reduction between 2004 and 2014 in Bangladesh, India, Pakistan and Nepal.30 However, the existing burden of undernutrition is still high—our study found that around one-third of under-five children in this region are still underweight. Previous studies conducted in the region have found that poor socioeconomic status, lower level of parental education, younger age of mother at birth, short birth interval and initiation of complementary feeding are important determinants of undernutrition among under-five children.31–33 We observed large inequalities in the prevalence of underweight in each of the included countries, which could not be explained by other factors studied here. In line with previous studies, our study also showed that factors like low maternal height and maternal underweight could significantly increase the likelihood of undernutrition in children, while other factors like older age of mother at birth, and access to improved sanitation were also associated with lower odds of childhood underweight. These associations were statistically significant, mostly in India because of a relatively large sample size. DHS data have information on feeding practices for children aged up to 2 years, so we could not adjust for variables related to feeding practices.25 To have better insights on the assessment of childhood undernutrition, we additionally explored the burden and the underlying factors of childhood stunting and wasting. These additional analyses showed that although the burden of childhood undernutrition varied widely by the indicator of interest, the determinants of childhood undernutrition were similar.
There has been evidence on increasing trends of overweight in younger children in many South Asian countries, although the prevalence is still quite low compared with the prevalence of underweight. Recent reports9 34–36 from South Asian countries highlighted the rise of overweight burden in children, but mainly in older groups. Overweight among under-five children is still overlooked in current literature. In our study, we provided evidence for an increasing burden of overweight in this age group, which clustered mainly in households with higher socioeconomic status. We found that the associations between socioeconomic status and the prevalence of childhood overweight can be heterogeneous between countries, with positive associations in most countries and inverse association in Pakistan. This highlights the need for cross-country comparisons for better understanding of double burden of malnutrition. Frequent intake of energy-dense foods and physical inactivity have been shown to be associated with overweight and obesity both in children and adults.37 38 These lifestyle behaviours are common in the higher socioeconomic group in LMICs, and therefore, both childhood and adulthood overweight are clustered in affluent households in urban areas.34 36 Our study showed that mothers who were overweight had higher odds of having children with overweight when compared with mothers who were of normal weight—suggesting that public health nutrition programmes should prioritise children whose mothers are overweight. Our findings on having lower odds of overweight among children exposed to nutrition-sensitive programmes (receiving vitamin A and deworming drug) in Pakistan can be studied further to examine the efficacy of such programmes to reduce double burden of malnutrition in LMICs.
The findings from our study highlight the importance of considering not only socioeconomic inequalities but also other maternal and household level factors while developing public health interventions and policies to tackle both childhood undernutrition and overnutrition. Also, the opposite directions for associations of socioeconomic status and nutritional outcomes suggest that the concept of ‘one size fits all’ is not applicable to tackle the emerging problem of the double burden of malnutrition. Previous studies suggested that a multisectoral approach is needed to alleviate poverty and other social inequalities related to the double burden of malnutrition in South Asia and beyond.39
Our study is the first study to look at the coexistence of underweight and overweight among under-five children in South Asian countries by socioeconomic status. One of the major strengths of our study is the use of nationally-representative samples with objectively measured height and weight data from five different countries, which allowed cross-country comparisons of the results. We were also able to adjust for several factors in the multivariable models, but there are possibilities of residual confounding due to unmeasured factors and/or imperfect assessment of measured factors. Due to smaller sample sizes in Maldives and Nepal, we could not reliably estimate the associations. Problems of reverse causation could also arise in the observed estimates due to the cross-sectional nature of the study. We used the IOTF reference to define childhood overweight instead of the WHO or Centers for Disease Control references.22–24 The IOTF classification system is based on large data sets from six regions covering different ethnicities, therefore more suitable for international comparisons.23 24 When compared with other references, the IOTF reference yielded similar estimates for overall overweight prevalence but different estimates for obesity.40 41 It was also found to be more specific in identifying children with overweight and obesity than other references.42 We assessed childhood undernutrition by assessing underweight, wasting and stunting. Previous studies have found that stunting and overweight can occur concurrently in an individual,43 therefore there may be double counting of children while studying double burden of malnutrition using stunting and overweight. Looking at children who are stunted and overweight can offer more insights into the topic, but we did not look into this issue in our study.
In conclusion, our study provides evidence for socioeconomic disparities for the coexistence of under-nutrition and over-nutrition among children aged 24 to 59 months in South Asian countries. It also showed that factors like maternal nutritional status was strongly associated with nutritional outcomes in children. These unmet inequalities for both underweight and overweight should be considered while developing national public health nutrition programmes and strategies.
Acknowledgments
The authors thank the participants of Demographic and Health Surveys (DHS) used in this study from Bangladesh, India, Maldives, Nepal and Pakistan. We would also like to thank the DHS programme to authorise us to use the data.
References
Footnotes
FBH and MSRS contributed equally.
Contributors Conception and design: FH, MS, SA and MB. Data collection and management: FH, SS, and GA. Data analysis: FH, MS and SS. Interpretation of the results: All authors. Drafting of the article: FH and MS. Critical revision of the article for important intellectual content: All authors. Final approval of the article: All authors.
Funding The authors have not declared a specific grant for this research from any funding agency in the public, commercial or not-for-profit sectors.
Competing interests None declared.
Patient and public involvement Patients and/or the public were not involved in the design, or conduct, or reporting or dissemination plans of this research.
Patient consent for publication Not required.
Ethics approval Ethical approval for each Demographic and Health Surveys is taken from the ICF Institutional Review Board as well as by a review board in the host country. More details of such ethical approval can be found in the DHS programme website (https://dhsprogram.com/).
Provenance and peer review Not commissioned; externally peer reviewed.
Data availability statement Data are available upon reasonable request. This study used data from Demographic and Health Surveys (DHS) for Bangladesh, India, Maldives, Nepal and Pakistan, which are available from the DHS programme website.