Article Text

Abstract
Objectives To measure the frequency of patients making avoidable emergency department (ED) attendances after contact with NHS 111 and to examine whether these attendances can be predicted reliably.
Design Analysis of 16 563 946 calls made to 111, where each call was linked with a record of whether the patient attended ED within 24 hours.
Setting All regions of England from March 2015 to October 2017.
Participants and data Our main regression model used a sample of 10 954 783 calls, each with detailed patient-level information.
Main outcome Whether patients made an unadvised, non-urgent type 1 ED (‘avoidable') attendance within 24 hours of calling 111.
Results Of 16 563 946 calls to 111, 12 894 561 (77.8%) were not advised to go to ED (ie, they were advised to either attend primary care, attend another non-ED healthcare service or to self-care). Of the calls where the patient was not advised to go to the ED, 691 783 (5.4%) resulted in the patient making an avoidable ED attendance within 24 hours. Among other factors, calls were less likely to result in these attendances when they received clinical input (adjusted OR 0.52, 95% CI 0.51 to 0.53) but were more likely when the patient was female (OR 1.07, 95% CI 1.06 to 1.08) or aged 0–4 years (OR 1.34, 95% CI 1.33 to 1.35).
Conclusions For every 20 calls where 111 did not advise people to attend the ED, 1 resulted in avoidable ED attendance within 24 hours. These avoidable attendances could be predicted, to a certain extent, based on call characteristics. It may be possible to use this information to help 111 call handlers identify which callers are at higher risk of these attendances.
- accident & emergency medicine
- health services administration & management
- organisation of health services
- rationing
This is an open access article distributed in accordance with the Creative Commons Attribution Non Commercial (CC BY-NC 4.0) license, which permits others to distribute, remix, adapt, build upon this work non-commercially, and license their derivative works on different terms, provided the original work is properly cited, appropriate credit is given, any changes made indicated, and the use is non-commercial. See: http://creativecommons.org/licenses/by-nc/4.0/.
Statistics from Altmetric.com
- accident & emergency medicine
- health services administration & management
- organisation of health services
- rationing
Strengths and limitations of this study
The analysis relies on a large national-level dataset containing 47% of all 111 calls in England in the study period
It adjusts for a large set of covariates known to be predictive of avoidable ED attendances.
However, other potentially important predictors of health behaviour, such as health history or other interactions with healthcare providers, were not available in the data.
We conducted conventional (ordinary least squares and logistic) regressions and a predictive (gradient-boosting) analysis.
Introduction
A total of 9.7 million (50%) of the 19.4 million attendances made at hospital emergency departments (EDs) in England in 2016–2017 resulted in the patient receiving either no treatment or advice and guidance only.1 This incurred a total cost to the National Health Service (NHS) of over £500 million, at a time when ‘pressures on the NHS are greater than they have ever been’ (see online supplementary A for the derivation of these figures).2 3 The low-intensity care received by these patients suggests at least some could have been treated safely elsewhere (eg, ]general practice, pharmacy or at home), at lower cost to the healthcare system.
Supplemental material
One way to potentially reduce the number of non-urgent ED attendances is by encouraging greater use of the 111 service. NHS 111 is a free, non-emergency healthcare telephone line in Britain that aims to ensure that callers are seen at the ‘right place, first time’.4 Call handlers for the 111 service assess callers’ health problems using a clinically validated triage algorithm (‘NHS Pathways’),5 then either dispatch an ambulance, or recommend the caller attend the ED, or advise the caller to go to primary care, attend another healthcare service or to self-care.
Given that 111 received 16 million calls in England in 2017–2018,6 the service is well placed to direct large numbers of patients with non-urgent health problems to seek treatment outside the ED. However, it is not clear how often calls produce this result in practice. An evaluation of 111 in its first year of operation found it had no statistically significant impact on ED attendance rates.7 More recent work has found that the Pathways algorithm may recommend ED attendance more often than necessary8 and that some 111 staff believe the service has increased the number of non-urgent calls compared with previous out-of-hours primary care services.9
Although there have been several big data studies examining the predictors of non-urgent ED attendance rates in England,10–12 it has only recently become possible to do large-scale analysis of linked 111/ED data (ie, data that link individual 111 calls with a record of whether that caller went on to attend ED).13 These linked data make it possible to examine how often patients end up making non-urgent ED attendances after calling 111. To date, one other study has been published using these linked data: it examined a dataset of 10 356 callers across three areas of North West London and found that 15% of callers advised by 111 to manage their health needs at home attended an ED within 10 hours (this rate was lower when patients were given GP out-of-hours appointments or when the 111 call received input from a clinical supervisor).14
This study uses a national-level linked 111-ED dataset to examine how often 111 callers end up making unadvised, non-urgent type 1 (henceforth ‘avoidable’) ED attendances within 24 hours of their call and to examine the predictors of these attendances. We do this using a dataset of 16 563 946 calls made to 111 from March 2015 to October 2017, where each call contained patient-level information and a record of whether the patient attended ED within 24 hours.
Methods
Study design
The data initially contained 18 127 605 observations, where each row was a call made to 111 between 31 March 2015 and 31 October 2017. This represents almost half (47%) of the 38 585 200 million calls made to 111 between March 2015 and October 2017.6 We were not able to access the full universe of calls as data from some 111 sites had not yet undergone the data linkage procedures necessary for inclusion in the analysis. For this same reason, we were not able to access calls outside the stated time period. Each call was linked with a Secondary Use Services record of whether the patient attended ED within 24 hours of the 111 call. This linkage was conducted by researchers at NHS England, and patients’ NHS number was used as the matching variable. We used logistic and ordinary least squares (OLS) regressions and a gradient boosted decision tree model to assess the extent to which we could predict whether the call would result in an avoidable ED attendance within 24 hours. All analyses were performed in Stata V.14 and R 3.5.0. The analysis was considered exploratory and consequently did not examine prespecified hypotheses.
Data cleaning
We excluded rows missing the date/time of the 111 call (n=52 394) or final disposition code (n=8 78 461), which had disposition codes15 indicating the call was not relevant to our research question (n=1 67 182), missing patient’s gender (n=2 46 144), missing patient age or where age was over 110 years (n=46 656) and calls whose duration was above the 99th percentile (more than 190 min) as these were presumed to be data errors (n=1 72 822). Note that the following final disposition at the end of 111 (recorded using ‘Dx’ codes) were considered irrelevant to the research question: Dx78 (‘Receive Report of Results or Tests from Laboratory’), Dx83 (‘Clinician Home Management of Dying Individual (Expected)’), Dx91 (‘Unexpected Death’), Dx95 (‘The Call is Closed with No Further Action Required, Wrong Service Called’), Dx116 (‘Speak to the Primary Care Service within 6 hours for Expected Death’) and Dx117 (‘Speak to a Primary Care Service within 1 hour for Palliative Care’).
This reduced the sample to 16 563 946 triaged calls, from which we produced descriptive statistics. Our main regression model used a smaller sample of 10 954 783 calls, as this retained only rows with complete information on the outcome measure and all control variables. Comparing the former and the latter samples, we saw a slight increase in the mean value of the outcome variable (from 5.4% to 5.6%), the proportion of calls between midnight and 04:00 (a 5.2% relative increase), the proportion of calls that received clinical input (a 6.1% increase), the proportion of calls that happened on a bank holiday and in the Christmas period (6.3% and 5.8%, respectively) and a decrease in the proportion of calls from patients based in London (a 12.5% decrease); all other relative changes were smaller than 3.0%. The regression sample is therefore very similar to the sample used for descriptive statistics, with a small number of notable deviations. Missing data imputation was not performed due to computational infeasibility, given the size of the dataset.
Outcome measure
Our outcome measure was a binary indicator of whether a patient made an avoidable ED attendance within 24 hours of calling 111. Figure 1 shows how we coded the outcome measure. We defined an ED attendance as ‘avoidable’ if, after being told by 111 to do something other than go to the ED, the patient attended ED within 24 hours and was assigned Healthcare Resource Group (HRG) treatment codes VB07Z (‘category 2 investigation with category 2 treatment’), VB08Z (‘category 2 investigation with category 1 treatment’), VB09Z (‘category 1 investigation with category 1–2 treatment’) or VB11Z (‘no investigation with no significant treatment’)16 and was not admitted, not referred to another healthcare specialist by the ED and did not die in the ED department. These HRG codes represent relatively low-intensity health assessments and were therefore considered more likely to capture attendances that could have been safely treated elsewhere—with the caveat that it is not certain that all these attendances should certainly not have attended the ED (eg, some patients may have attended the ED at the explicit instruction of a healthcare professional, even though they ended up receiving low intensity treatment). This particular list of HRG codes was adapted from those used in a 2017 study by the North of England Commissioning Support Unit, which also examined avoidable admissions.17

How the outcome measure was coded. ED, emergency department.
Control measures
Our analysis used 18 control variables, shown in past research to be important predictors of ED attendance in England, which fell into five broad categories:
Two patient characteristics: (1) a continuous measure of patient age and (2) a binary measure of patient gender.
Five geographic characteristics: (3) a binary indicator of whether the patient was from a rural versus urban area,18 (4) a categorical variable identifying what region of England the patient was from (North, Midlands, South and East or London), (5) the distance ratio between the patient’s local area and the nearest ED relative to a GP (included under the assumption that a patient’s decision to see a GP or go to the ED is likely to be influenced by the relative ease of accessing these two locations), (6) the deprivation of the patient’s local area (measured in quintiles using 2015 indices of multiple deprivation (IMD) scores) and (7) a categorical indicator of which of the 40 different 111 sites present in the data handled the call, to account for any unobserved variation in the way different 111 sites interact with patients.19
Two GP practice characteristics: for each GP practice in the data, which was recorded at the individual-patient level, we included (8) a variable from the GP Patient Survey (GPSS), which recorded the proportion of patients saying ‘Yes’ or ‘Yes, but I had to call back closer to or on the day I wanted the appointment’ in response to ‘Were you able to get an appointment to see or speak to someone?’. We also (9) included an indicator of the number of full-time equivalent GPs at each practice.20
Three call characteristics: (10) duration of the 111 call in minutes, (11) a binary variable indicating whether the call had clinical input from a doctor, nurse or other clinician (21% of calls did involve the patient speaking to a healthcare professional like this) and (12) which of the 96 NHS Pathways disposition codes the patient was assigned at the end of the call.
S ix temporal characteristics: sing the date and time the call was made to 111, we constructed variables for (13) hour of the day, (14) day of week, (15) month, (16) year (2015, 2016 or 2017) and binary indicators for whether the day was a (17) bank holiday or (18) spanned the December 24–26 period.
The distance ratio, that is, variable 5 was calculated as the average travel time by public transport and/or walking to the nearest hospital relative to the nearest GP, and was included under the assumption that a patient’s decision to see a GP or go to the ED is likely to be influenced by the relative ease of accessing these two locations.21 22
Deprivation, that is, variable 6, was measured using 2015 IMD scores, which were matched to patients’ local areas using their Lower Layer Super Output Area (LSOA) code. While deprivation is typically measured using the aggregate IMD score compiled from seven different subdomain measures (eg, deprivation for income, deprivation for health and deprivation for employment), it is not entirely appropriate to use this aggregate measure when predicting ED attendance. This is because the health score, which comprises 13.5% of the total IMD score, itself incorporates local ED attendance rates as a measure of local health deprivation.23 This sort of mathematical coupling (ie, using a score that includes ED attendances to predict ED attendances) can lead to spurious correlations in statistical assessment. We therefore followed an established procedure to construct an alternative aggregate IMD score that excluded the health domain but retained the other six deprivation domains.24
Ease of securing a GP appointment, that is, variable 8 relied on the GPPS, which is a questionnaire sent to users of GP practices. It asks people to rate the performance of their GP practice on dimensions such as quality of care, satisfaction with opening hours and a subjective assessment of how easy it is to get an appointment. We retained only data for GP practices who had received at least 50 responses to these questionnaires. In order to maximise sample size, we took the average score for the GP characteristic variables across the three GPPS waves published in January 2016, July 2016 and July 2017.25
The disposition code variable 12 indexed 96 different disposition codes present in the data that contained at least 30 observations. These codes used the standard ‘Dx’ coding format (eg, ‘Dx14=Speak to a Primary Care Service within 12 hours’) used by the 111 services.15 These disposition codes were the ones recorded by the call handler or clinical advisor who initially managed the 111 call, but in some cases, patients will have gone on to have further interactions with the 111 service after this disposition was assigned. For example, they may have received a call-back from another healthcare professional, who may have assigned them a different disposition.
Detailed descriptive statistics for each of the control variables can be found in online supplementary table S1 in supplement B.
Supplemental material
Our regression specification consisted of a linear combination of all the control variables and did not include any interactions or transformations.
Patient and public involvement
Patients were not involved in the design of this study as it involved only observational analysis of an anonymised, pre-existing, routinely collected dataset.
Results
Descriptive statistics
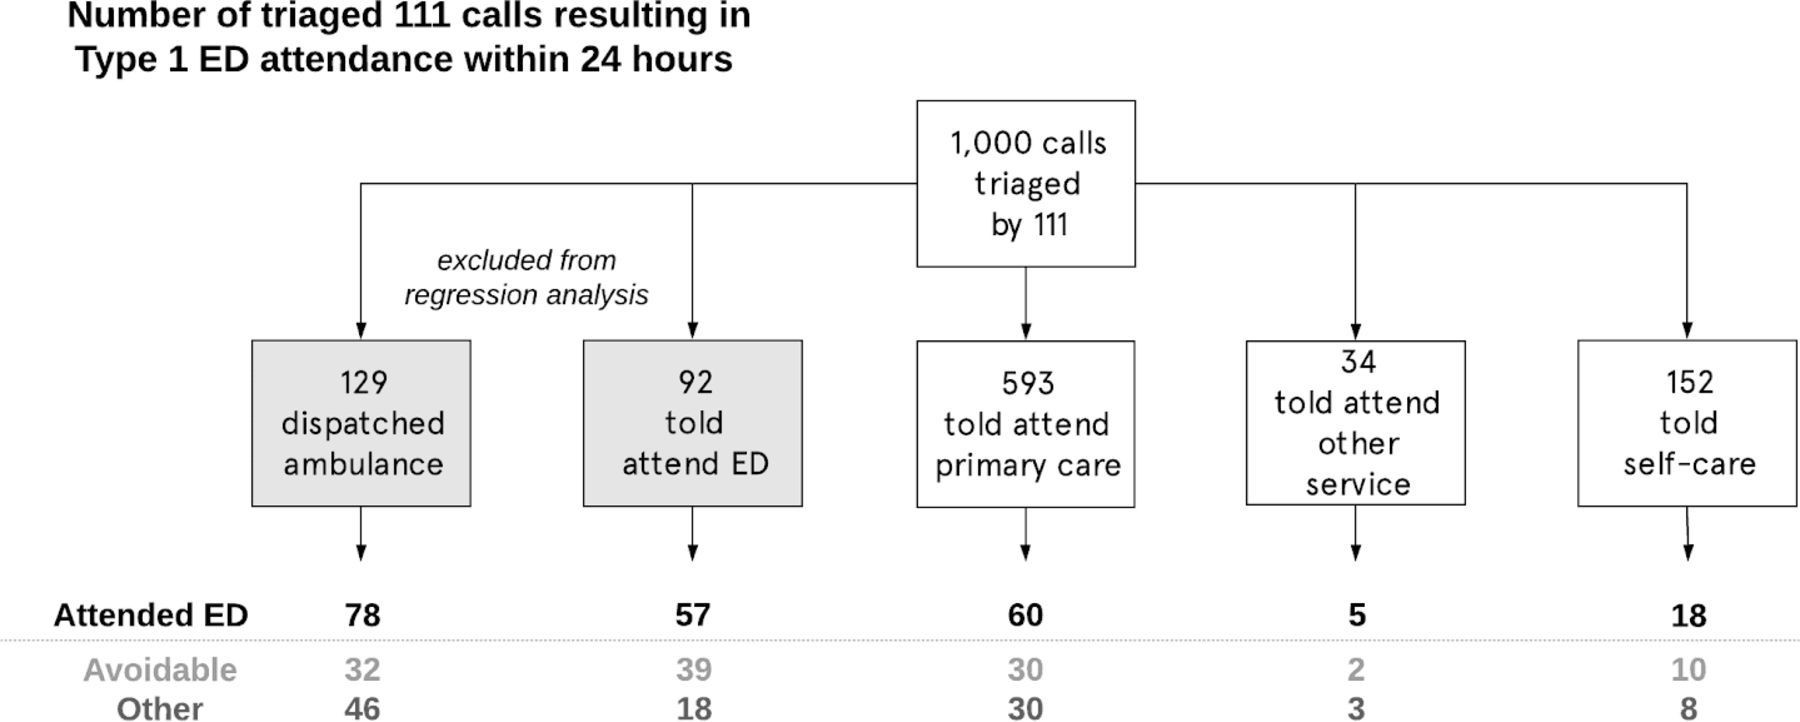
Figure 2 shows the ED outcomes of 16 563 946 calls in the data, broken down by NHS Pathways disposition assigned at the end of the call, and with the original number of calls normalised to 1000 for ease of interpretation. For every 1000 callers, 779 were not advised by 111 to attend ED (ie, they were told to attend primary care, attend another service or self-care). Of these, 83 went on to make a type 1 ED attendance anyway within 24 hours. Of these, 42 were classified as avoidable. Stated differently, for calls where patients were not advised to attend ED, 5.4% resulted in avoidable ED attendances within 24 hours.

Outcomes of 16 563 946 calls made to 111 from March 2015 to October 2017. For ease of interpretation, the total number of calls has been normalised to 1000. ED, emergency department. Avoidable=patient got Healthcare Resource Group (HRG) treatment code VB07Z (‘category 2 investigation with category 2 treatment’), VB08Z (‘category 2 investigation with category 1 treatment’), VB09Z (‘category 1 investigation with category 1–2 treatment’) or VB11Z (‘no investigation with no significant treatment’) and was not admitted, not referred to another healthcare specialist by the ED and did not die in the ED department.
Regression analyses
Table 1 shows the results of our logistic and OLS regression analyses. Column 1 shows exponentiated logistic regression coefficients, which can be interpreted as ORs. Column 2 shows the coefficients of an OLS regression (ie, a linear probability model) with the same specification; although problematic, as it violates the assumption of non-negative probabilities, it provides a more easily interpretable way of assessing the strengths of the observed associations.
Summary results of the association between 111 call characteristics and the probability of making an avoidable type 1 ED attendance within 24 hours
Notable results include that calls were 3.65 percentage points (95% CI −3.76 to 3.54) less likely to result in avoidable attendances (relative to a baseline of 5.6%) when the call had clinical input, and 0.8 points less likely (95% CI −1.0 to 0.6) when the caller was registered with a GP practice where it was easier than other practices to get an appointment. Calls were 0.34 points more likely to result in these attendances when the patient was female (95% CI 0.31 to 0.37), 1.72 points more likely when the patient was aged 0–4 years (95% CI 1.68 to 1.75) and 0.17 points more likely when the patient lived in a more deprived area (95% CI 0.16 to 0.18).
Predictive modelling
We next tested whether we could improve our ability to predict which 111 calls would result in avoidable ED attendances by running a gradient boosted tree model (GBM).26 A GBM models the outcome measure as the result of a series of decision trees. Each tree attempts to identify areas where the others make poor predictions and correct for that, resulting in strong predictive performance even in the presence of complex non-linear relationships or interactions between the predictors and the outcome (a situation in which other techniques such as OLS may not perform so well). It is one of the best-performing predictive algorithms for tabular data.27 We built the GBM using a training subset of the data (a random selection of 80% of the 10 954 783 rows) and evaluated its out-of-sample predictions using a test subset (the remaining 20% of rows).
As a test of the GBM’s incremental accuracy, we applied the same train-test procedure with the logistic regression model described in table 1 and compared the predictive ability of the two models using an area-under-curve (AUC) score. We found the AUC was 0.70 for the logistic regression and 0.73 for the GBM (note that a model that randomly guesses the outcome would have an AUC of 0.5 and a model that makes perfect predictions would have an AUC of 1.0). This surprisingly small improvement implies that the ability of the GBM to automatically find non-linear relationships and interactions resulted in only slightly more accurate predictions about which 111 callers would end up making avoidable ED attendances and still felt short of reaching very high levels of predictive accuracy (as would be indicated by an AUC score of 0.80 or higher).
Table 2 shows the next result from the GBM—a quantification of the relative importance of the different types of variables in our analysis. The importance of a variable is defined as the improvement in log likelihood, which is attributable to each decision (in the decision trees) made using that variable. These are then renormalised to sum to 100% to give the relative importance. Of the variation that we could explain, 91% was accounted for by a combination of the call characteristics, geographic characteristics and temporal characteristics, and the remaining 9% was explained by patient-level and GP practice characteristics.
Decomposition of the relative importance of different characteristics in predicting avoidable ED attendances after a 111 call
Finally, we used the GBM’s predictions to classify the calls into different risk categories. For every 1000 triaged calls, we classified:
558 as low risk (<5% predicted probability of avoidable ED attendance), of which 15 (2.6%) resulted in an avoidable ED attendance.
328 as medium risk (5%–10% predicted probability of avoidable ED attendance), of which 23 (7.0%) resulted in an avoidable ED attendance.
114 as high risk (>10% predicted probability of avoidable ED attendance), of which 19 (16.2%) resulted in an avoidable ED attendance.
Using this (somewhat arbitrary) classification, high-risk calls were 6.2 times more likely than low-risk calls to result in avoidable ED attendances (although a large majority of even the high-risk calls did not result in these attendances).
Discussion
Our analysis of the largest yet published dataset of linked 111 calls and subsequent ED attendances found that, of patients not advised by 111 to go to ED, around 1 in 20 (5.4%) made an avoidable type 1 ED attendance within 24 hours of the call. Using the NHS national tariff charges present in the data for each ED attendance, we estimate that these avoidable attendances incurred tariff costs of £65 million (£2.1 million per month) over the March 2015–October 2017 period covered in our data. If we extrapolate this 5.4% incidence rate of avoidable attendances to all 38 585 200 calls made to 111 between March 2015 and October 2017 (ie, including calls not in our data), this implies £58.8 million in tariff charges were incurred per year by avoidable ED attendances. The cost to the NHS as a whole, however, is likely smaller than this, since patients who do not visit a type 1 ED may instead attend another (although potentially cheaper) part of the healthcare system.
Although our analysis could not answer the counterfactual of ‘would overall avoidable ED attendances be higher or lower if the 111 service did not exist?’, our findings do at least suggest that relatively few 111 patients end up making unadvised attendances at ED that could likely have been safely treated elsewhere. However, figure 2 also found that a surprisingly large proportion of patients who were advised by 111 to attend the ED did nonetheless end up receiving low-intensity treatment (such that even these attendances were classified as ‘avoidable’ as defined in this study). Clarifying the precise nature of these ‘advised and avoidable’ attendances was outside the scope of this study but warrants further investigation.
The key strengths of this study were: our use of a national-level dataset containing over 16 million calls to 111 (47% of the total number of 111 calls made over the study period); our use of an extensive set of covariates known to be predictive of avoidable ED attendances; and our combination of both conventional (OLS, logistic regression) and cutting-edge (GBM) analytic techniques. One of our key findings—that calls which received clinical input were much less likely to result in avoidable ED attendance—replicated the same association found in the only other paper to date examining linked 111 ED data.28 Key limitations included the relatively crude criteria we used to define ED attendances as ‘avoidable’ (ie, this relied principally on post hoc ED disposition codes and did not incorporate any clinical notes that could have provided more nuanced information about the patient’s health issue), our lack of controls for other characteristics likely predictive of health behaviour (eg, patients’ education, risk aversion and health history) and the fact that the data did not record interactions patient may have had with 111 soon after their initial call (eg, a 111 call handler could have arranged for the patient to receive a call-back from a clinical advisor or out-of-hours GP within a few hours of their initial call, but this subsequent call would not be recorded in the data we examined).
After adjusting for the full set of covariates, which included information about the time, duration and location of the call, the age and gender of the caller, and the caller’s GP practice, we classified calls into low, medium and high risk for avoidable ED attendance and found that high-risk calls were six times more likely than low-risk ones to result in avoidable attendances. This suggests that it may be possible to use existing data resources to construct a tool that helps 111 call handlers identify callers at high risk of these attendances—similar to how traffic light systems are used to identify gradations of risk in other health assessments.29 Call handlers could then provide extra resource for these calls (eg, spend more time providing self-care instructions or assistance securing a GP appointment).
In terms of practical implications of this research, we suggest that analysis of newer editions of the dataset examined in this report could be used to (1) provide tailored feedback to individual 111 call handlers and local leaders of 111 services regarding the proportion of their calls that result in avoidable ED attendance soon afterwards and (2) communicating which calls are at high risk of an avoidable ED attendance (eg, potentially using a traffic light warning system where red warnings are used to identify high-risk calls) to 111 call handlers, who could then provide extra resource for these patients (eg, by spending extra time providing self-care instructions or guidance on how best to secure a GP appointment).
Future research could seek to replicate and expand our analysis as more and more linked data become available. Given that our analysis included only 47% of 111 calls made in the examined time period, it is possible that selection effects may be distorting our own findings (eg, perhaps 111 sites with lower avoidable attendance rates were more likely to provide their data to NHS Digital). Future work could also aim to test whether avoidable attendance rates could be reduced by providing a traffic light warning system for 111 call handlers or by providing regular feedback to individual call handlers or 111 sites about the avoidable attendance rate associated with their calls.
Acknowledgments
The authors would like to thank the members of the National Health Service (NHS) England Research & Evaluation team, particularly Holly Krelle and Dilwyn Sheers, for providing access to the data and feedback on the analytic strategy. We would also like to thank the study’s sponsors: Ed Rose and colleagues in NHS England’s Integrated Urgent Care team. Michael Hallsworth of the Behavioural Insights Team supported the conception of the study.
Supplementary materials
Press release
Press release
Press release
Press release
Footnotes
Twitter @makeuya
Contributors HB conceived the study and designed it with help from ME. ME and JL designed the analytical strategy. ME and FM performed the analysis and wrote the first draft of the paper. All authors assisted in the interpretation of data and creation of the final draft. ME is the guarantor.
Funding The study was funded by NHS England.
Disclaimer This is an independent report commissioned and funded by NHS England. The views expressed are not necessarily those of NHS England.
Competing interests None declared.
Patient consent for publication Not required.
Ethics approval The study was approved by both the Health Research Authority’s London – Fulham Research Ethics Committee (REC reference 17/LO/1569) and Confidentiality Advisory Group (CAG reference 17/CAG/0159).
Provenance and peer review Not commissioned; externally peer reviewed.
Data availability statement Data may be obtained from a third party and are not publicly available. The data are records of 111 calls linked with Secondary Use Services records of whether each patient attended ED within 24 hours of the call. Inquiries regarding data access should be made to the Data Services for Commissioners, Operations and Information, NHS England (england.dataservces@nhs.net).