Article Text

Abstract
Objectives This investigation expected to validate the psychometric properties of the modified seven-item Kessler psychological distress scale (K7) for measuring psychological distress in healthy rural population of Bangladesh.
Design Cross-sectional study.
Setting Narail district, Bangladesh.
Participants A random sample of 300 adults of age 18–90 years were recruited. Face-to-face interviews were conducted between July and August 2018 using an Android phone installed with a mobile data collection application known as CommCare.
Outcome measure Validation of the K7 was the major outcome. Sociodemographic factors were measured to assess for Differential Item Functioning to check if the tool functions equally in different factors. Rasch analysis was carried out for the validation of the K7 scale in the healthy rural population of Bangladesh. RUMM2030 was used for the analyses.
Results Results showed good overall fit, as indicated by a non-significant item-trait interaction (χ2=44.54, df=28, p=0.0245) compared with a Bonferroni adjusted p value of 0.007. Both item fit (mean=0.30, SD 1.22) and person fit residuals (mean=–0.18, SD 0.85) showed perfect fit. Reliability was very good as indicated by a Person Separation Index=0.85 and Cronbach’s alpha=0.89. All individual items were ordered thresholds. The K7 scale showed adequate reliability, unidimensionality and was free from local dependency. The K7 scale also showed similar functioning for adults and older adults, males and females, no education and any level of education, and at least some financial instability versus no financial instability.
Conclusions Validation of K7 scale confirmed that the tool is suitable for measuring psychological distress among the rural Bangladeshi population. Further research should validate the K7 scale in different rural settings in Bangladesh to determine a valid cut-off score for assessment of severity levels of psychological distress. The K7 scale should also be tested in other developing countries where sociodemographic characteristics are similar to those of Bangladesh.
- Kessler psychological distress scale
- Rasch analysis
- Validation
- Rural Bangladesh
This is an open access article distributed in accordance with the Creative Commons Attribution Non Commercial (CC BY-NC 4.0) license, which permits others to distribute, remix, adapt, build upon this work non-commercially, and license their derivative works on different terms, provided the original work is properly cited, appropriate credit is given, any changes made indicated, and the use is non-commercial. See: http://creativecommons.org/licenses/by-nc/4.0/.
Statistics from Altmetric.com
Strengths and limitations of this study
This study provides the first reliable data on the Kessler K7 scale from a general population of a typical rural district of Bangladesh.
This study used primary data on a K7 scale and application of the Rasch analysis technique was applied to validate the K7 scale instead of classical test theory.
The data were collected through face-to-face interviews to increase the accuracy of data.
The study provides a unique opportunity to assess psychological distress in a rural population of Bangladesh by using reasonably fewer items.
The potential drawback of this study is that it is based on a single-occasion collection of data from a rural district in Bangladesh which prevents test–retest evaluation or comparison of alternate versions of the same measures.
Background
Globally, one out of every four individuals is influenced by mental or psychological distress at some point in their lives.1 Almost 66% of individuals experiencing psychological distress fail to look for assistance because they were unaware of, or neglect, their disorder.2 Due to the rapid growth of mental disorders, there is a need to identify risk conditions quickly in a cost-effective manner.3 Early diagnosis of psychological distress has been seen as an essential measure to guarantee successful, focused, effective and targeted intervention for patients experiencing psychological distress.4 In recent years, researchers have primarily been interested in early diagnosis of psychological distress and used tools with a very limited number of items for measuring psychological distress among the general population.5 Therefore, the development and continued validation of the tools used for measuring psychological distress is critical, especially for early detection of psychological instability.
Typically, large epidemiological studies of mental health have used detailed and interviewer-administered diagnostic interviews; replicating this method is considered cost-effective for the general population.6 A variety of these diagnostic screening interviews are now accessible, and these include the Diagnostic Interview Schedule,7 Composite International Diagnostic Interview8 and the Mini-International Neuropsychiatric Interview.9 Dimensional measures of non-specific psychological distress have come to take on new importance because it distinguishes people based on severity level rather than purely on diagnosis. Over the last three decades, large-scale epidemiological studies used screening measures to provide a quick measure of the prevalence of psychological distress.10–13 However, most of the tools have an extensive list of items which have been limited to the use of widely accepted tools aimed at the screening of psychological distress among the general population.
The Kessler 10-item scale (K10) is an exception. Developed by Professors Kessler and Mroczek in 1992, K10 was designed to be used in the United States National Health Interview Survey as a brief measure of non-explicit psychological distress along with the anxiety–depression spectrum.14 The K10 and the six-item scale K6 was developed concurrently with experimental instruments for assessing psychological distress in people with a variety of mental disorders.15 The six items for K6 is included in K10. The K10 and the K6 have been translated and validated in at least 14 countries worldwide.6 16–18 The K10 tool was initially developed to recognise the levels of non-specific psychological distress in the general population and was employed in many countries including Australia, Canada and the USA.15 19–21 The WHO’s World Mental Health Survey also used this tool.22 The tool has also identified a substantial association with severe mental illnesses.23 As such, clinicians recommend utilisation of the K10 and the K6 to screen for psychological distress.24 25 Although both scales have been validated with various populations and languages, research has indicated that the factor structures of the K10 and the K6 scales differ. For example, one study outlined discrepancies between the K6’s one-factor and two-factor structures16 while another study outlined discrepancies between the K10’s two-factor and four-factor structures.17 In addition, both the K10 and the K6 cross-cultural validity was not employed in any rural settings including the rural populations of Bangladesh. Such variations in factor structures suggest that further research is needed on the psychometric properties of the K10 and the K6 instruments.
Bangladesh is a densely populated country with a population of 167 million people; around 65% of them live in rural areas.26 27 Psychological distress has been found to be a significant public health concern especially in rural areas.28–31 The prevalence of mental disorders varies notably in rural areas, ranging from 6.5% to 31% of the total population, conceivably due to the utilisation of diverse conventions, different measuring tools and various meanings associated with mental disorders.32 Further, there has been no culturally sensitive tool available for rapid screening of psychological distress in Bangladesh. Recently, Uddin et al validated the K10 scale using the Rasch analysis technique in a rural area of Bangladesh and proposed a modified version of a seven-item K7 scale. The K7, which is a subset of the K10, proved to be robust containing a 4-point Likert-type scale instead of the 5-point scale of the original K10. The modified K7 version followed all assumptions of Rasch analysis and produced a unidimensional tool for measuring psychological distress.
The K7 scale provides additional benefits. One is related to brevity offering ease of administration, and the other is low cost to measure psychological distress through a shortened version of the K10 scale. Given the widespread use of the K10 and the K6 scales, including the translated Bengali versions of K10 scale,18 it is noteworthy that no empirical validation studies with Bengali-speaking populations have been reported in the literature review. The culturally validated instrument of the K7 scale can provide an increasingly productive resource for healthcare services and can be applied in other developing countries with similar sociodemographic characteristics. However, further validation of the K7 scale with its four-response categories is required to be used for rural populations of Bangladesh. Therefore, the current study aims to provide validation of the modified version of the K7 scale for potential application within healthy population settings in rural Bangladesh.
Materials and methods
Study population
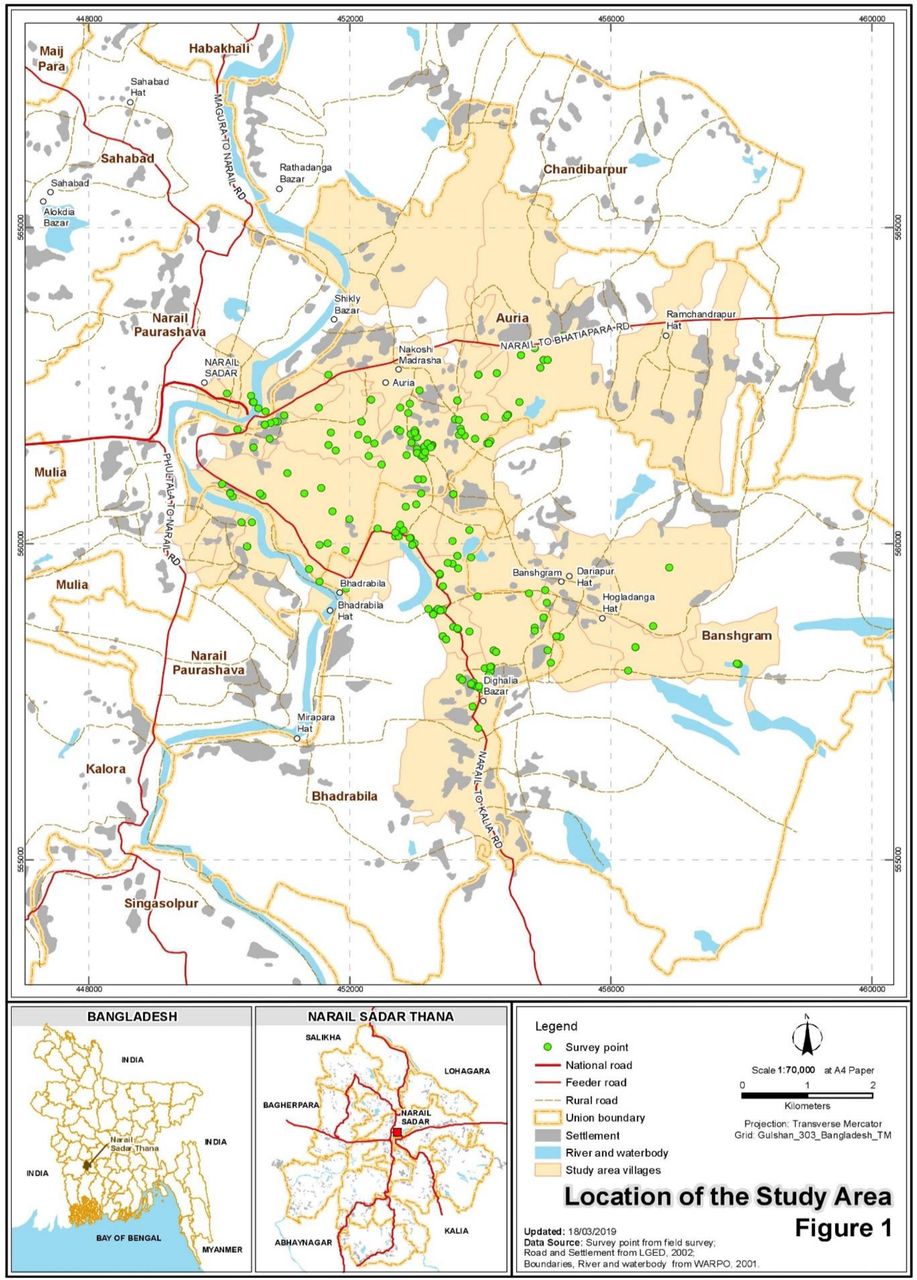
Bangladesh is a nation of 167 million individuals divided into 64 districts.26 The male:female ratio (48.9 to 51.1) was consistent in all over in Bangladesh.33 Around 72.9% of individuals attained primary education or above as opposed to 27.1% had no education of the national population.34 With respect to the availability of funds, the population having insufficient funds some or most of the time accounted for 23.2% in Bangladesh.35 Adult participants aged 18 to 90 years were selected from the Narail Upazilla, which is located around 200 km southwest of Dhaka, the capital city of Bangladesh. Interviews were conducted between July and August of 2018. The study area includes a specific geographical area and 300 survey points of data collection. Data were gathered from three unions (Auria, Banshgram and Bhardabila) of the region. This has been described in detail in figure 1.

Study location that includes a geographical area and data collection points.
Sample size and statistical power
A sample size of 300 adults of age 18–90 was used for this study. This sample size is appropriate for a Rasch examination since large samples can potentially result in type 1 error that falsely dismisses an item for not fitting the Rasch model.36 A sample size of 300 is viewed as sufficiently substantial to ensure 99% confidence that the item difficulty would be within ±½ logit of its stable value.37
Sampling frame
The cross-sectional study recruited a multistage cluster random sample of 320 participants from the rural district Narail of Bangladesh in the period of July–August 2018. Data were collected from three unions (the smallest rural administrative units) out of nine unions, excluding the four which were selected previously from the 13 unions of Narail Upazilla.38 The selected unions are Auria, Banshgram and Bhardabila. One village (the smallest territorial and social unit for administrative and representative purposes), from each of the chosen unions, was randomly selected at the second level. The selected villages were Baliadanga, Fulshor and Rogunathpur. Two paras (further divisions of the village) from each selected village were randomly chosen at the third level. In total, 40 adults (18–59 years old) and 40 older adults (60–90 years old) from each of the villages/wards were interviewed. Interviewers used a mobile data collection platform CommCare on their android phone to collect data from the respondents. To mitigate the effect of selection bias, 320 respondents were used with an equal proportion of adults and older adults, further partitioned into gender. This study excluded 20 participants randomly as 300 participants were deemed sufficient for the Rasch Measurement Theory.
Data collection using CommCare and its advantage over using a printed questionnaire
Mobile data collection is a method employed to collect qualitative and quantitative inputs via a mobile device (eg, mobile phone, tablet, etc). The introduction of mobile devices has mitigated streamlining and making them more economical and less time consuming.39 Other benefits include minimisation of human errors, speeding up reporting, increased flexibility in deploying programmatic changes and provision of accurate location information.40 With the correct implementation of the mobile data collection tool, these benefits can all be successfully implemented.41 CommCare is a customisable, mobile platform, which empowers non-developers to build mobile applications for data collection.42 CommCare allows mobile applications to run offline where gathered information can be transmitted to CommCareHQ as internet connectivity becomes accessible.43
The current study followed a strict protocol to ensure a smooth launch after the CommCare application was finalised by pre-testing before training began.44 The application was pilot tested with 30 people. The testing found some minor problems associated with respondents not understanding the application correctly. These concerns were addressed through an upgraded version of the application which was then distributed for final data collection.
Modified Kessler psychological distress scale (K7)
The K7 measures developed asked respondents to consider how regularly they encountered of depressive and anxiety symptoms in the preceding 4 weeks before screening. Respondents were asked to express how often the following seven symptoms occurred: they felt nervous; so nervous that nothing could calm them down; hopeless; restless or fidgety; so restless that they could not sit still; so depressed that nothing could cheer them up; everything was an effort.18 Items were rated on a 4-point Likert-type scale. The answer to each question was allocated to a value of 1, 2, 3 or 4: “none of the time”, “a little of the time”, “some or most of the time” or “all the time”, respectively.
Outcome measure
The K7 scale is the main outcome measure for assessing psychological distress using Rasch analysis. Demographic details were collected for age, gender and level of education and socioeconomic conditions.
Rasch model
The Rasch model was named after Danish mathematician Georg Rasch.45 The model shows what is required for reactions to items if estimation (at the measurement level) is to be accomplished most accurately. Two versions of the Rasch model are available: dichotomous45 and polytomous.46 In this case, the polytomous Rasch model was used. The Rasch model consists mainly of two forms, the rating scale model and the partial credit model, which can be used with polytomous results. The partial credit model is the norm under RUMM2030, which does not restrict threshold parameters and enables them to differ by item.47 The likelihood ratio check, which is available in the RUMM2030 program, tests unregulated parameterisation (partial credit model) towards reparameterisation. The non-statistical result shows that the definition of the rating scale is to be used, although statistically significant results indicate that the partial credit model should be used.48 An analysis was undertaken, and a significant finding was found which encourages the use of the partial credit model.
The Rasch analysis used in this investigation was conducted using the software package RUMM2030.49 The Rasch model makes a few hypotheses that should be assessed to guarantee an instrument has Rasch properties. The most ordinarily evaluated Rasch suspicions are (1) unidimensionality, (2) local independence and (3) invariability. Local independence means that the scores are related to each other only through the construct, whereas unidimensionality means that only one construct is being measured and the invariance criterion implies that generally an instrument should function in the same way for all individuals.50 51 As indicated by the Rasch demonstration, the overall fit of the model is defined by χ2 item–trait interaction statistics.52 With non-significance, a Bonferroni-corrected level of 0.007 (0.05/7 items) indicates adequate fit.53–56 Item–person interaction statistics are exhibited as z-statistics (mean=0 and SD 1) and show ideal fit. Individual item fit (IFR) measurements incorporate the residuals satisfactorily when inside the range ±2.5 and a non-significant χ2 value.57
A ‘threshold’ parameter is characterised by two response options where either response is equally likely. Disordered thresholds demonstrate that the respondents are not able to segregate between the response’s choices. Disordered thresholds result in item misfit and can be redressed by combining two neighbouring response options.58 Following the principal component analysis (PCA) of the residuals, the associations between items and the first PCA variables are used to describe two subsets of products. The independent t-test is then used to determine the difference between the two subsets. The individual estimates, with a non-significant result or the lower bound variance of the binomial distributions by 5%, indicate no evidence of multidimensionality.59 The person–item residuals correlation matrix can be used to determine whether there is any local dependency between the items, and correlations less than 0.3 are generally considered to be acceptable.48 Differential item functioning (DIF) investigates whether items operate a similar function across different groups. An analysis of variance (ANOVA) has been carried out for each item that compares scores across each group factor level (age, sorted as either adult (18 to 59 years) or older adult (60 to 85 years), sex (male or female), education (no education or at least primary) and socioeconomic conditions low (insufficient funds most/some of the time) and high (balance/sufficient funds all the time)) and across construct levels. DIF was found to be present if the ANOVA was significant with the Bonferroni correction (Bonferroni adjusted p value of 0.05/7=0.007).60 61 Rasch examination also gives a marker of reliability. In RUMM2030, this is given by the Person Separation Index (PSI). The PSI of the Rasch analysis consists of indices developed as an approximation of the proportion of the true or error-free variance. This applies throughout the distribution of person estimates relative to the sum of this variance and error variance in these estimates. With Rasch measurement, instead of reliability indices, the person separation index is used. However, the person separation index is analogous to Cronbach’s alpha (CA).62 A value near 1 shows high internal consistency and a value under 0.7 demonstrates low scale reliability.63
Patient and public involvement
Study participants were generally people without any disease. Public involvement for the research was obtained primarily informing the district commissioner, district police super, civil surgeon and various public representatives such as the Chairman of the union Parishad. A pilot survey was conducted and a focus group discussion involving the general public was arranged as the questionnaire was developed. To maintain an approximately equal number of male and female participants, one female was interviewed immediately after each male participant. Participants were not involved in the recruitment and conduct of the study. Results will be disseminated via community briefs and presented at national and international conferences. Patient consent form can be found in online supplementary materials.
Results
Table 1 describes the sociodemographic characteristics of the participants by gender (male vs female). The mean (SD, range) age of the participants was 52.0 years (15.6, 18–90). A considerably large proportion (45.0%) of the populations did not have any formal education, with only 1.3% attaining a bachelor’s degree or above. The socioeconomic condition for most respondents (about 41.3%) was occasional financial instability, 32.3% experienced a precarious financial situation, 25.3% experienced balance and 1.0% held sufficient funds most of the time.
Sociodemographic characteristic of gender in Narail Upazila in Bangladesh
The validation of the K7 scale showed good overall fit to the Rasch model with the Bonferroni adjusted p value of 0.007 (χ2=44.54, df=28, p=0.0245). The item fit residual (IFR) (mean=0.30, SD 1.22) and the person fit residual (mean=−0.18, SD 0.85) were within the acceptable range (table 2). All seven items were found to have ordered thresholds (figure 2), suggesting the respondents have no difficulty differentiating between the response’s choices with the 4-point Likert-type scale used in the K7 scale.
Overall model fit statistics of the K7 scale

Threshold maps of the K7 scale.
No misfit or overfit items were identified with significant χ2 probability values. There was neither high positive nor high negative residual values (±2.5) observed. All seven individuals’ item fit statistics showed a good fit with the Bonferroni-adjusted p value of 0.007 (table 3). The value of the PSI (0.85) for the original set of seven items with four response categories indicated that the scale worked well to separate persons. The value of Cronbach’s alpha (0.89) of the K7 scale demonstrates good internal consistency. A visual examination of the threshold map (figure 2) showed that the estimates of the thresholds defined the categories in all seven items that formed distinctive regions of the continuum. We also examined the category probability curve in which each response options systematically take turns, showing the highest probability of endorsement (figure 3).
Individuals’ item fit statistics of the K7 scale

Category probability curve of all the items of the K7 scale.
The K7 scale was assessed for DIF across gender (male/female), age (adults/older adults), education (no education/some education) and socioeconomic conditions (low/high) (table 4). No significant DIF was found for any of the items. The unidimensionality of the K7 scale was supported by independent t-tests comparing the person estimates with the PCA of the residuals; our findings indicated that only 3.7% (95% CI 1.2% to 6.1%) of cases showed statistically significant differences (table 2 and figure 4). There were no correlation coefficients above 0.30 on the person–item residual correlation matrix, indicating no local dependency of the items (online supplementary appendix 1).
Supplemental material
DIF on age, gender, educational attainment and socioeconomic conditions on K7 scale

Dimensionality testing of the K7 scale.
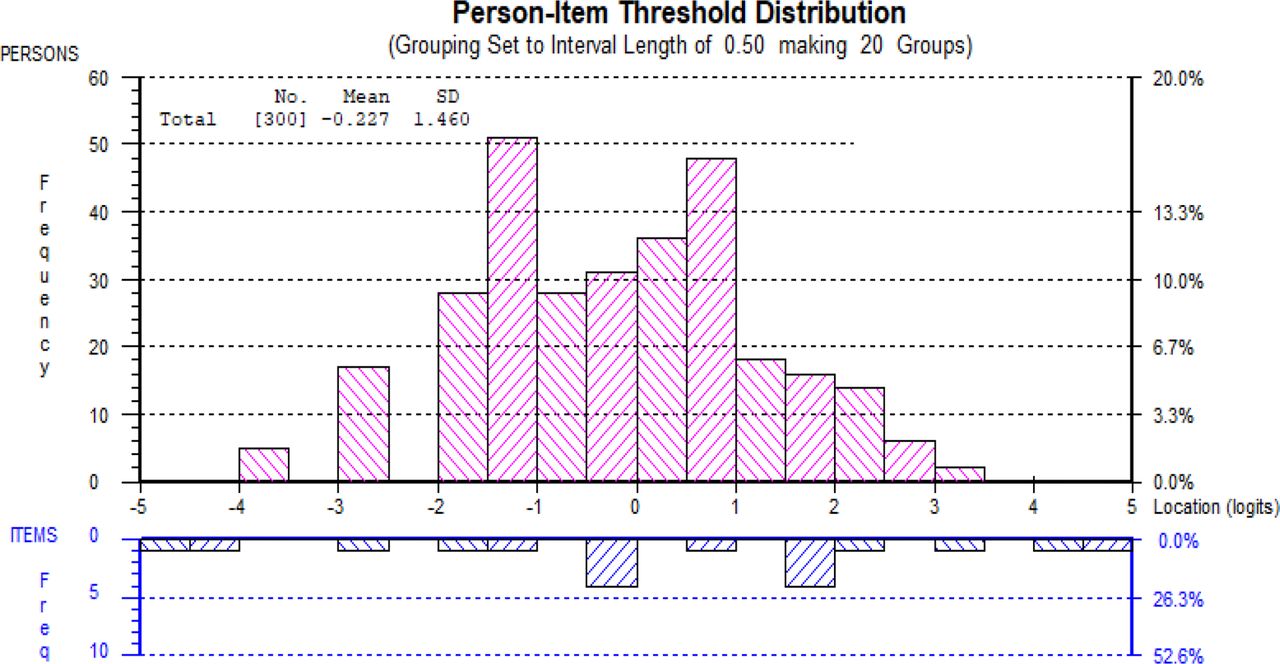
Figure 5 shows the person–item threshold distribution of the K7 scale. The person distribution is shown in the top half and the item thresholds in the bottom half. The average value of individual logit for the K7 scale was −0.227 showing well-targeted persons and items fit for the K7 scale. At the same time, a negative mean value for the K7 measure may suggest that the participant was located at a lower level (eg, psychological distress) than the average level of the scale. Overall, the K7 scale was not too difficult to endorse.

Person item threshold distribution map of the K7 scale.
Discussion
The current study investigated the psychometric performance of the K7 in a sample of a healthy and rural Bangladeshi population. The inspiration behind the paper was to evaluate the appropriateness of the modified K7 scale (which was prior validated from the K10 scale) survey for measuring psychological distress in rural Bangladesh. This paper includes Rasch examination to investigate a few issues concerning the K7 scale. The article also incorporates the validity of the category scorings framework, the fit of individual items and an evaluation of the potential predisposition of age–sex distribution, education attainment and socioeconomic status.
The K10 scale has recently experienced a thorough psychometric examination in rural Bangladesh prompting the development of a K7 scale to measure psychological distress in rural Bangladesh.18 However, further K7 validation was required to confirm its use in rural settings. From the Rasch examination point of view, the underlying illustrative examination focused on the present rural samples of Bangladesh. The modified K7 scale with four response classifications showed no redundancy (little impact on the scale) and no misfit. Moreover, items were all order thresholds, while scale demonstrated no proof of multidimensionality.
It was stated earlier that the scale would be one-dimensional, an important assumption for the implementation of Item Response Theory (IRT) used to develop K10.15 There is a difference in outcomes for different populations with respect to the dimensional structure of the instrument. In some research, K10 and K6 were proposed as unidimensional scales.15 25 However, other research proposed multidimensional of K10 and K6 scale.16 17 In line of the previous study reported K10 and K6 as unidimensional scales, the findings of the current study further confirm the K7 as a unidimensional scale as it was earlier proposed by Uddin et al.18
Several previous studies conducted around the world did not use Rasch analysis to validate the K10 or K6.14 24 64–69 A comparison of this study with previous studies is limited using PSI. However, Uddin et al18 used Rasch analysis and developed the K7 scale that would be suitable for rural Bangladesh. The current study recognised that the K7 scale CA was marginally below from the previous estimates of CA, and the PSI was marginally superior to the previous estimates of PSI.18 Moreover, reliability (CA) was high in the current study and consistent with previous research.15 66 70 71 Therefore, the current study results suggest that the translated items measure the same overall construct of psychological distress in rural Bangladesh.
There has been controversy over the DIF associated with gender in psychological distress assessment.72–74 The predominant mental health problems are widely accepted as being associated with the level of education, specifically, as it decreases psychological distress increases.73 75–77 The K7 scale demonstrated no DIF on sex and education level, which supports previous research findings from Australia,73 Japan78 and Bangladesh.18 An investigation led by Kessler et al recorded a conventional arrangement of disparity in the association among age.79 However, different investigations exhibited a stable non-linear connection between age and psychological distress in a few cross-sectional epidemiological studies.79–82 A negative relationship between socioeconomic position and psychological distress has been established in the literature,83 with low socioeconomic status associated with a higher level of psychological distress.84 Although there may still be an association between age/socioeconomic status with psychological distress, the lack of DIF simply means that items function the same way with regards to their psychometric properties, irrespective of age and socioeconomic status group.
To our knowledge, this was the first psychometric assessment on the K7 scale to measure psychological distress in rural Bangladesh. Use of the Rasch estimation demonstrated in this study has strengthened the viability of the K7 scale for measuring psychological distress in rural Bangladesh. The scale demonstrates ordered thresholds with no proof of DIF. Moreover, the scale showed high PSI (0.85) and CA (0.89), which also showed the power of the test for fit. This study provides significant evidence that a complete score of psychological distress can be measured and accelerates the finding of a legitimate cut-off score for rural people in Bangladesh. Building up a cut-off score can help with evaluating the severity levels of psychological distress.
The Rasch examination contributes valuable information on dimensions of psychological distress among the general rural population of Bangladesh. The study was based on a data set with a wide age distribution, where data were collected directly through face-to-face interviews. Interviewers used a mobile data collection platform CommCare to collect data from the respondents to minimising human error and speeding up reporting.44 Further, the K7 scale applied by this method may work as a productive screener for psychological distress across various service settings, including primary and integrated care facilities. This can caution clinicians to patients who may benefit from a psychological distress assessment. The K7 scale can be made openly accessible in any healthcare setting as well as on the web. Given its portability and straightforwardness in both web and paper formats, the K7 scale could be made accessible individuals searching for a self-administered assessment measure.
The primary limitation of this study is that it depends on single-occasion data from people in a rural region of Bangladesh, though we have attempted to validate the K7 scale in the rural area of Narail. The investigation would be improved if a national delegate sample were available. The concern with fit statistics associated with the Rasch analysis is that the greater the sample size, the higher the likelihood of finding the probability of detecting deviations from the Rasch model.85 86 Nevertheless, there are no clear guidelines for sample size when implementing the Rasch Measurement Theory.87 Thus, we used the sample size of 300, which is more favoured.85 Replication studies with large populated samples of Bengali speakers may improve generalisation.
Conclusion
In conclusion, the study recommended the utilisation of the K7 scale in rural Bangladesh. The research gleaned from this study suggests that a seven-item scale taken from the K10, with four response categories, would offer a robust psychometric scale. The K7 scale satisfies all the assumptions of the Rasch model. Examination of the K7 scale affirmed that the tool could also be used as a standard measure of psychological distress. It could therefore provide a screening instrument for evaluating psychological distress among the rural Bangladeshi population. Further, the tool can be applied in other developing nations experiencing similar sociodemographic attributes. In addition, the tool can be connected within service settings to provide a national dimension using telemedicine, where mental health conditions cannot be analysed.
Acknowledgments
We especially recognise the commitment of Md Mofijul Islam, Serajul Islam and Arzan Hosen for their diligent work in door-to-door data collection. We additionally recognise Dr Mostofa Sarwar for assisting us with building the mobile data collection platform using CommCare for data collection. Finally, we would like to offer our thanks to the investigation members for their wilful interest.
References
Footnotes
Contributors MNU and FMAI jointly structured the examination. MNU analysed the data and drafted the manuscript. FMAI supervised and reviewed the manuscript. All authors contributed to the development of the manuscript, and read and endorsed its final version.
Funding The author (MNU) used his own ‘HRD Student Fund’ from the Swinburne University of $A600 for data collection for this research project.
Disclaimer The funder had no role in the investigation and its planning, information accumulation or examination, interpretation of data or writing of the manuscript.
Map disclaimer The depiction of boundaries on the map in this article does not imply the expression of any opinion whatsoever on the part of BMJ (or any member of its group) concerning the legal status of any country, territory, jurisdiction or area or of its authorities. The map is provided without any warranty of any kind, either express or implied.
Competing interests None declared.
Patient consent for publication Obtained.
Ethics approval All procedures performed in studies involving human participants were conducted in accordance with the ethical standards of the institutional and/or national research committee and with the 1964 Helsinki declaration and its later amendments or comparable ethical standards. The ethics committee of the Swinburne University of Technology Human Ethics Committee (SHR Project 2015/065 extended endorsement got in July 2018) has granted ethics approvals.
Provenance and peer review Not commissioned; externally peer reviewed.
Data availability statement The datasets used and/or analysed for the current study are available from the corresponding author on request.