Article Text

Abstract
Objectives Current mortality prediction models used in the intensive care unit (ICU) have a limited role for specific diseases such as influenza, and we aimed to establish an explainable machine learning (ML) model for predicting mortality in critically ill influenza patients using a real-world severe influenza data set.
Study design A cross-sectional retrospective multicentre study in Taiwan
Setting Eight medical centres in Taiwan.
Participants A total of 336 patients requiring ICU-admission for virology-proven influenza at eight hospitals during an influenza epidemic between October 2015 and March 2016.
Primary and secondary outcome measures We employed extreme gradient boosting (XGBoost) to establish the prediction model, compared the performance with logistic regression (LR) and random forest (RF), demonstrated the feature importance categorised by clinical domains, and used SHapley Additive exPlanations (SHAP) for visualised interpretation.
Results The data set contained 76 features of the 336 patients with severe influenza. The severity was apparently high, as shown by the high Acute Physiology and Chronic Health Evaluation II score (22, 17 to 29) and pneumonia severity index score (118, 88 to 151). XGBoost model (area under the curve (AUC): 0.842; 95% CI 0.749 to 0.928) outperformed RF (AUC: 0.809; 95% CI 0.629 to 0.891) and LR (AUC: 0.701; 95% CI 0.573 to 0.825) for predicting 30-day mortality. To give clinicians an intuitive understanding of feature exploitation, we stratified features by the clinical domain. The cumulative feature importance in the fluid balance domain, ventilation domain, laboratory data domain, demographic and symptom domain, management domain and severity score domain was 0.253, 0.113, 0.177, 0.140, 0.152 and 0.165, respectively. We further used SHAP plots to illustrate associations between features and 30-day mortality in critically ill influenza patients.
Conclusions We used a real-world data set and applied an ML approach, mainly XGBoost, to establish a practical and explainable mortality prediction model in critically ill influenza patients.
- adult intensive & critical care
- information technology
- infectious diseases & infestations
- adult intensive & critical care
- thoracic medicine
This is an open access article distributed in accordance with the Creative Commons Attribution Non Commercial (CC BY-NC 4.0) license, which permits others to distribute, remix, adapt, build upon this work non-commercially, and license their derivative works on different terms, provided the original work is properly cited, appropriate credit is given, any changes made indicated, and the use is non-commercial. See: http://creativecommons.org/licenses/by-nc/4.0/.
Statistics from Altmetric.com
- adult intensive & critical care
- information technology
- infectious diseases & infestations
- adult intensive & critical care
- thoracic medicine
Strengths and limitations of this study
This study used machine learning to predict the mortality risk of critically ill influenza patients.
We used a data set containing medical data of real-world practice at eight Taiwanese referral centres during an influenza epidemic.
We employed extreme gradient boosting (XGBoost) to establish a prediction model with high accuracy and used domain-based feature importance and SHapley Additive exPlanations plots for visualised realisation to mitigate the concern of black-box issue.
The number of subjects was relatively small, and large-scale studies are needed to validate our findings.
Background
Sepsis is a leading cause of death in the intensive care unit (ICU) worldwide and contributes to approximately 50% of hospital deaths in the USA.1 2 A number of scoring systems have been developed to predict mortality in patients admitted to ICUs; however, the clinical application remains limited given that sepsis consists of diverse aetiologies and no single scoring system appears to be applicable in diverse patient populations.3–5 For example, the Acute Physiology and Chronic Health Evaluation (APACHE) II score, a widely used severity scoring system in the ICU,6 7 has been found to have a limited role in a number of diseases and settings, including severe influenza, pancreatitis, post-cardiac surgery and burn injury.8–12 Similarly, the pneumonia severity index (PSI) is currently a widely used scoring system to assess patients with pneumonia,13 but PSI might underestimate severity in patients with influenza.8 9 Currently, influenza infection remains a global health threat that is estimated to affect nearly five million people worldwide, resulting in 250 000 to 500 000 deaths in 2015.14 Our previous studies, investigating 336 patients with severe influenza requiring ICU management, showed the impact of an influenza epidemic on the healthcare system due to an abrupt increase in patients with severe influenza and found that lung-protective ventilation as well as fluid balance were early predictors for 30-day mortality in patients with severe influenza.15 16 These findings highlight the crucial need to develop an influenza-specific mortality prediction model for both the management of patients and the allocation of ICU resources during an influenza epidemic. Taiwan experienced an influenza epidemic in the spring of 2016,17 and the Taiwan Severe Influenza Research Consortium was established to survey the management strategies of distinct clinical domains, including the ventilation domain and fluid balance domain, laboratory data domain, demographic and symptom domain, management domain and conventional ICU severity score domain including APACHE II and PSI. Current machine learning (ML) models have enabled us to use all of the collected variables among the aforementioned clinical domains to develop an influenza-specific mortality prediction system, which has the potential to be incorporated into a healthcare information system as an automated decision support system (DSS).18 19 However, the lack of intuitional understanding of ML models is one of the main obstacles in the implementation of ML in the medical field.20 Herein, we employed an ML approach to illustrate the domain-specific feature importance, applied a visualised interpretation of the importance of each feature and compared the accuracy of different ML models using a nationwide severe influenza data set.
Methods
Subject enrolment
This multicentre retrospective cohort study enrolled patients admitted to the ICUs at eight tertiary referral centres in Taiwan for virology-confirmed influenza who were enrolled during an influenza epidemic. The reported influenza epidemic occurred between October 2015 and March 2016, and the diagnosis of influenza was confirmed by the Taiwan Centers for Disease Control based on the rapid influenza diagnostic test, reverse transcription-polymerase chain reaction or viral culture. The study was approved by the Institutional Review Boards of the eight participating hospitals. Written informed consent was waived owing to the minimal risk, and all patients’ information was de-identified before analysis.
Measurement of variables
A standardised case report form was used to collect data at the eight participating hospitals. Medical records were reviewed to obtain data, which included demographics, comorbidities, physiological data, laboratory tests and influenza-associated data. Importantly, given that the reported influenza epidemic was characterised by a high proportion of patients with acute respiratory distress syndrome (ARDS), we collected ventilatory parameters and daily fluid status; protective ventilation strategy and dry-lung strategy are key components of the fundamental management of ARDS.21 22 We also collected severity scores, including APACHE II, which is one of the quality-assessment indicators used across ICUs in Taiwan, and PSI, a widely used scoring system for predicting mortality in patients with pneumonia.13 23
Extreme gradient boosting
We used extreme gradient boosting (XGBoost), an ensemble machine learning method based on decision trees, to establish a prediction model for 30-day mortality using data within the first 7 days after admission to the ICU and to illustrate the feature importance. Gradient boosting is a technique employed in complex prediction models that involves iterative combinations of ensembles of weak prediction models into one strong learner.24 XGBoost uses second-order Taylor series to approximate the value of the loss function and further reduces the likelihood of overfitting by application of regularisation.25 In the setup of the hyperparameters, the optimal values were found by performing a grid search on possible value combinations of the parameters. The main fine-tuned parameters in the present study included number of trees (n_estimator=100), learning rate (eta=0.007), minimal loss to expand on a leaf node (gamma=0), maximum tree depth (max_depth=4), subsample proportion (subsample=1), ratio of the number of negative class samples to positive class samples (scale_pos_weight=263/73) and minimum sum of instance weight needed in a child node (min_child_weight=1). All the other parameters may remain at their default values (see online supplementary table 1 for detailed parameters).25 Additionally, the ensemble of decision tree methods can be used to obtain a predictive model with high accuracy through sequential (boosting) or parallel (bagging) ensemble methods and to provide estimates of feature importance from a trained predictive model. In the present study, which used F scores in XGBoost, the relative importance of each variable was computed as the sum of Gini improvement among the corresponding splits within a tree averaged over all the trees. Moreover, we implemented SHapley Additive exPlanations (SHAP), which is a recent approach to explain the output of a machine learning model, to illustrate the individual feature-level impacts on the 30-day mortality.26 In brief, SHAP is an additive feature attribution method that provides an explanation of the tree ensemble's overall impact in the form of particular feature contributions and is relatively consistent with human intuition. In the present study, the training set consisted of a randomly selected 80% of the patients, and the testing set was composed of the remaining 20% of the patients. The model establishment was based on data from the training set, and the testing set was independent of the training process and was used only for performance evaluation after the establishment of the model. The same training and testing sets were used in all three machine learning models in the present study (online supplementary figure 1).
Supplemental material
Supplemental material
Logistic regression and random forest
In addition to XGBoost, we also employed other ML models, including logistic regression (LR) and random forest (RF). LR is a widely used method in medicine and is used as an ML model for classification tasks; however, LR is based on the assumption that a linear relationship exists between the input variables and the outcomes.27 With regards to XGBoost and RF, both models are tree-based classifiers; however, these two ML models have substantial differences in ensemble method: XGBoost is based on boost, whereas RF is based on bagging.24 28 In detail, XGBoost is based on the ensemble of weak learners and is characterised by high bias and low variance.25 In contrast, RF is designed as fully grown decision trees and is hence characterised by low bias and high variance.29 In RF, max_depth was 4 and n_estimators was 100, while default values were used for the other parameters in RF and LR (see online supplementary table 1 for detailed parameters).
Statistical analysis
Data were expressed as frequencies (percentages) for categorical variables and as means±SD or median (IQR) based on the test of normality for continuous variables. Kolmogorov-Smirnov test was applied to test the normality. Differences between the survivor and non-survivor groups were analysed using Student’s t-test for continuous variables and Fisher’s exact test for categorical variables. Mann-Whitney U test was used for the variable which is not normally distributed. For the interpretability of the ML approach, feature importance was used to quantify the variable importance of each variable, and the SHAP summary plot and partial SHAP dependency plots were used to illustrate the distribution of the variable importance of individual variables. The score of feature importance was the average gain across all splits of a feature’s used in the construction of the model. The performance of XGBoost, RF and LR for predicting 30-day mortality was determined by using the area under the receiver operating characteristic (ROC) curve metric. The DeLong’s test was used to compare the difference between two area under the curves (AUCs). Python V.3.6 was used in the present study.
Results
Patient characteristics
A total of 336 patients with virology-proven influenza were enrolled, and 76 variables with complete data of these 336 patients were analysed. Table 1 summarises patients’ demographic characteristics and other relevant data. The median age of patients was 61 (IQR, 53 to 69) years, and 62.8% were men (see online supplementary dataset for details). Given that the eight participating hospitals were all teaching hospitals, the enrolled patients had a high severity, including a high APACHE II score (22, IQR 17 to 29) and PSI score (118, IQR 88 to 151) as well as a low ratio of oxygen PaO2 to fractional inspired oxygen ratio (PaO2/FiO2 (fraction of inspired O2)) (107, IQR 65 to 159.2). To investigate factors associated with hospital mortality, we divided the 336 subjects into survivor and non-survivor groups according to mortality at 30 days. Compared with those in the survivor group, those in the non-survivor group were more likely to have a lower PaO2/FiO2 (85.9 vs 111.2, p<0.01), higher PSI (146.5 vs 108, p<0.01), APACHE II (28 vs 21, p<0.01), serum C-reactive protein (16.3 vs 12.9 mg/dL, p=0.07), blood urea nitrogen (30 vs 20.8 mg/dL, p=0.01) and creatinine (1.5 vs 1.0 mg/dL, p=0.01) and were more likely to receive extracorporeal membrane oxygenation (27.8% vs 12.5%, p<0.01), haemodialysis (23.6% vs 7.2%, p<0.01) and usage of steroid (60.8% vs 42.3%, p=0.01) (table 1).
Supplemental material
Basic characteristics of the 336 patients categorised by 30-day mortality
Given that patients with severe influenza infection were characterised by oxygenation failure, as evidenced by the low PaO2/FiO2 and a high proportion (78.3%, 263/336) of ARDS, we specifically collected dynamic ventilator parameters and data regarding fluid status in this study (table 2). Compared with those in the survivor group, those in the non-survivor group appeared to require a high FiO2, high positive end-expiratory pressure (PEEP), high peak pressure (Ppeak), and a low tidal volume/predicted body weight (VT/PBW) and these trends tended to be apparent on day 3. The dynamic fluid data showed that a positive cumulative fluid balance on day 4 (3801.2±4128.8 vs 1347.3±3137.4 mL, p<0.01) and on day 7 (4500.7±4997.8 vs 506.8±4385 mL, p<0.01) was associated with high 30-day mortality (table 2). Taken together, these data highlight the critical role of dynamic ventilatory parameters and fluid status in critically ill influenza patients.
Ventilatory and dynamic fluid parameters of the 336 patients categorised by 30-day mortality
Visualisation of feature importance
To provide clinicians with a straightforward understanding of feature importance, we categorised the top 30 features by clinical domain (figure 1). The cumulative feature importance of the fluid balance domain, ventilation domain, laboratory data domain, demographic and symptom domain, management domain and conventional severity score domain was 0.253, 0.113, 0.177, 0.140, 0.152 and 0.165, respectively. Moreover, to allow the visualised interpretation of the selected variables, we used SHAP to illustrate how these variables affect 30-day mortality (figure 2). As shown in figure 2, the higher PSI and cumulative day-4 fluid balance were associated with a higher 30-day mortality, whereas a lower PaO2/FiO2 was associated with a higher 30-day mortality, in critically ill influenza patients. SHAP can also be used to illustrate the impact of an individual feature on 30-day mortality. As shown in figure 3A, PSI mainly contributed to high variable importance when PSI was higher than approximately 130, and this finding is consistent with previous studies on PSI. In line with the results of our previous study, a positive day-4 cumulative fluid balance appeared to be associated with a higher 30-day mortality, as shown in figure 3B.16 Taken together, these data showed the feature importance in accordance with clinical domains and illustrated the importance of individual features by using SHAP plots so that physicians might have an intuitive understanding of feature importance.

Relative feature importance categorised by the six main clinical domains. APACHE, Acute Physiology and Chronic HealthEvaluation; BMI,body mass index; BUN, blood urea nitrogen; ECMO, extracorporeal membraneoxygenation; FiO2, fraction of inspired O2; K,potassium; Na, sodium, PBW, predicted body weight; PEEP,positive end-expiratory pressure; PSI, pneumoniaseverity index; Ppeak, peak pressure; VT, tidal volume.
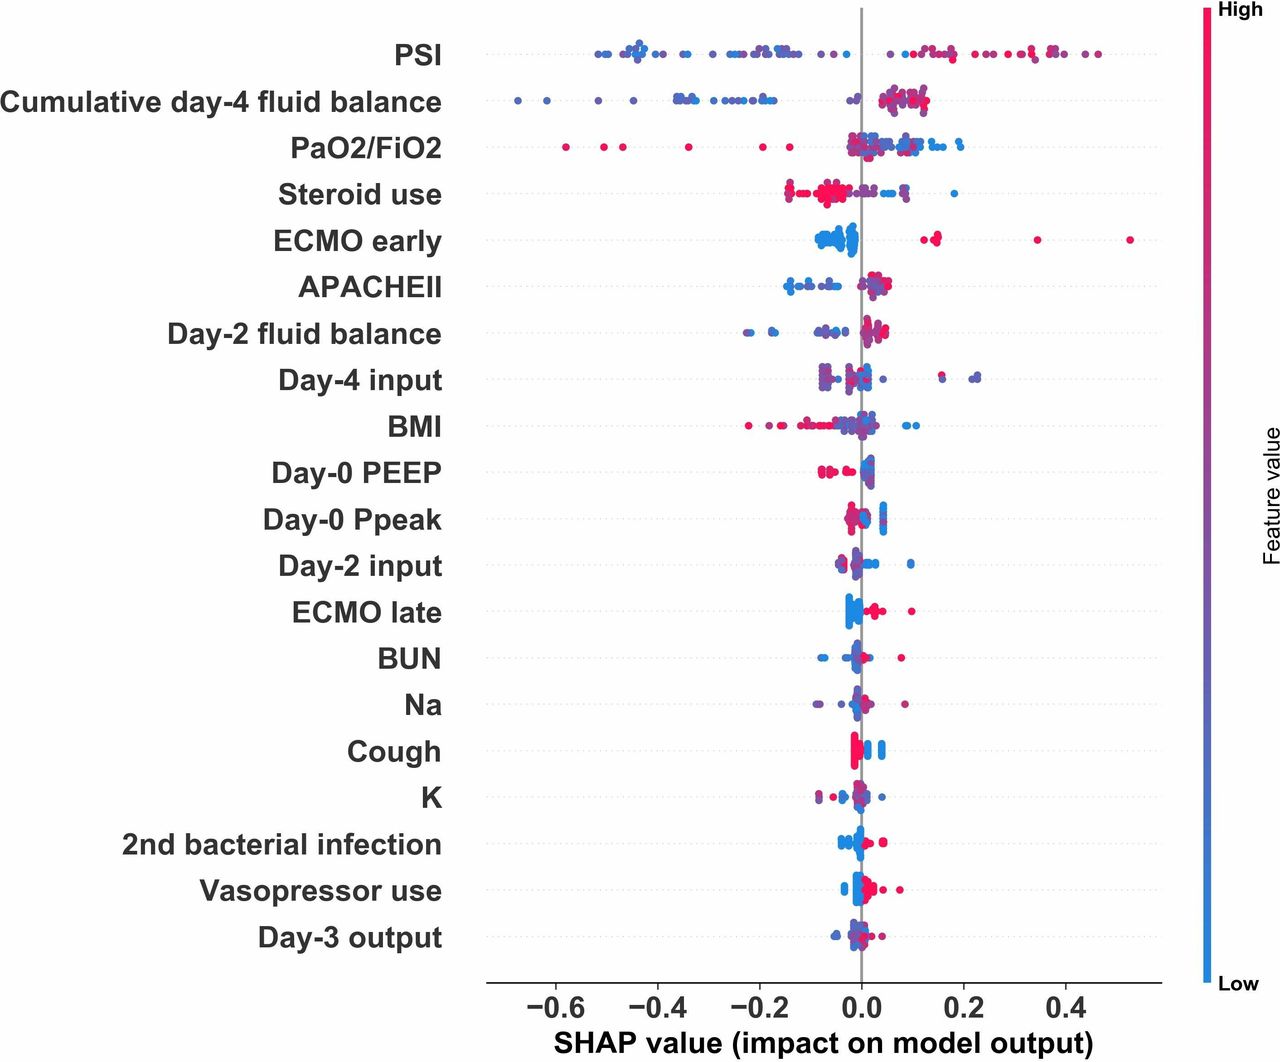
SHAP summary plots for 30-day mortality predictors in critically ill influenza patients. APACHE, Acute Physiology and Chronic HealthEvaluation; BMI,body mass index; BUN, blood urea nitrogen; ECMO, extracorporeal membraneoxygenation; FiO2, fraction of inspired O2; K,potassium; Na, sodium, PBW, predicted body weight; PEEP,positive end-expiratory pressure; PSI, pneumoniaseverity index; Ppeak, peak pressure; SHAP, SHapley Additive exPlanations; VT, tidal volume.

Partial SHAP dependence plot of two representative features. (A) PSI score. (B) Cumulative day-4 fluid balance. PSI,pneumonia severity index; SHAP, SHapley Additive exPlanations.
Comparisons among XGBoost, RF and LR
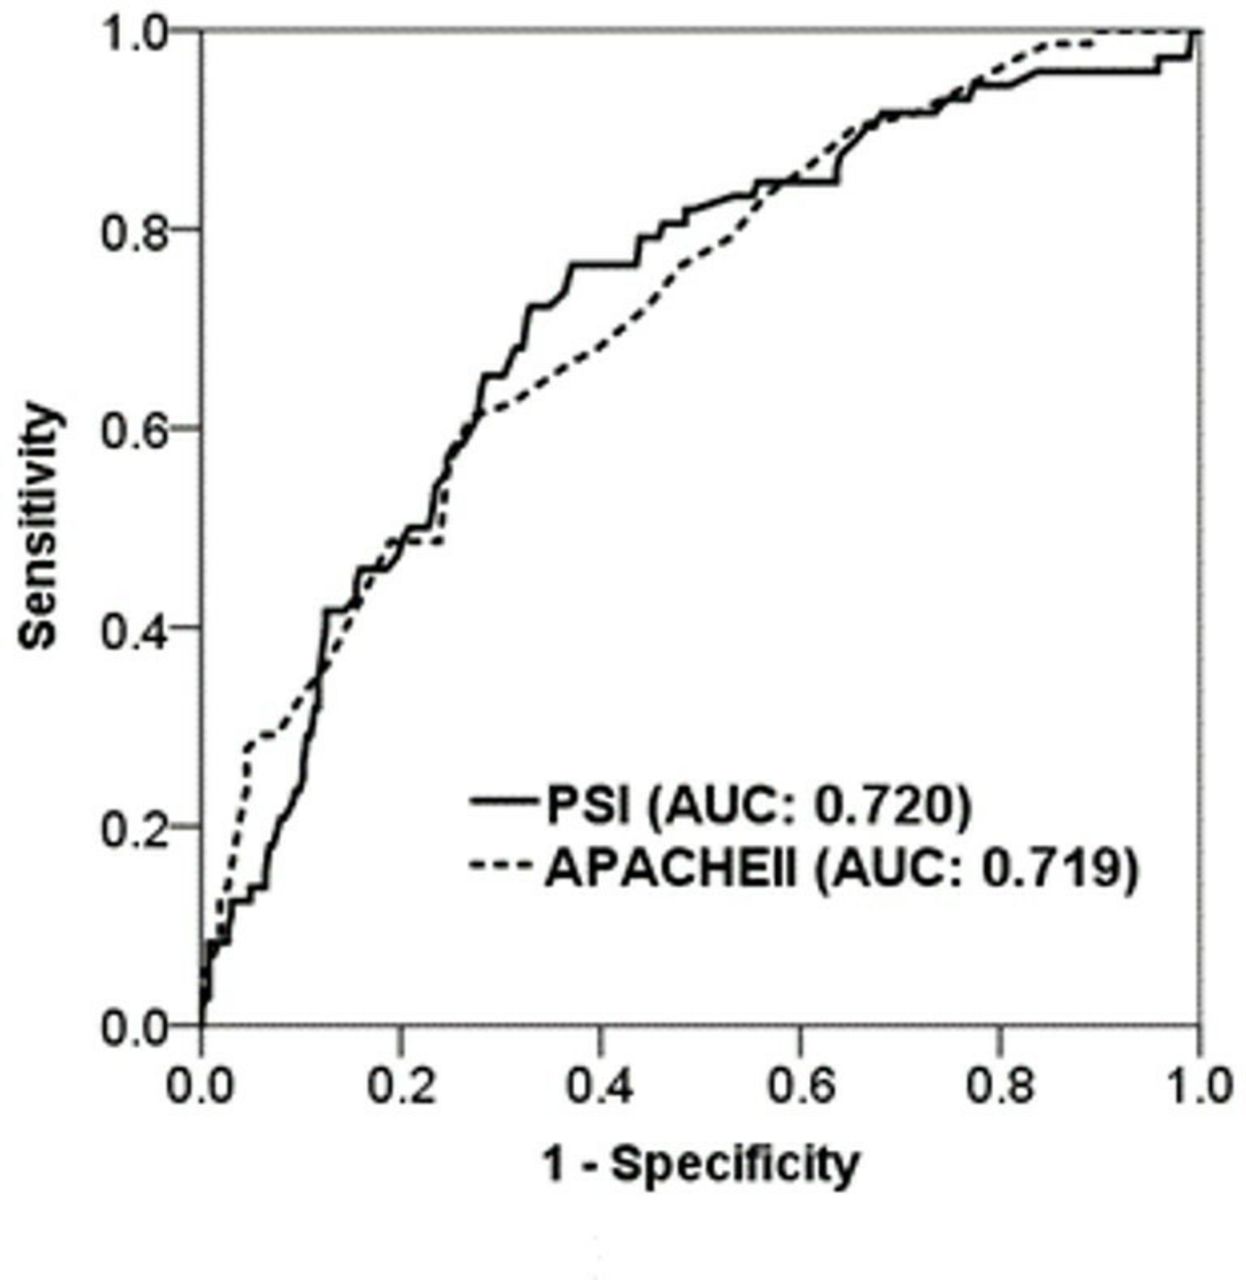
We then attempted to compare the performance of the three ML models to predict 30-day mortality using data within the first 7 days after admission to the ICU. Using ROC analysis, we found that the AUC value for predicting 30-day mortality in the XGBoost was 0.842 (95% CI 0.749 to 0.928), which was slightly higher than those in RF (AUC: 0.809, 95% CI 0.629 to 0.891) and much better than those in LR (AUC: 0.701; 95% CI 0.573 to 0.825) (figure 4). The detailed metrics of the performance of these three models were provided (online supplementary table 2). Furthermore, we used DeLong's test to determine the difference between two AUCs and confirmed that XGBoost outperformed RF and LR (XGBoost against RF, p=0.002; XGBoost against LR, p=0.003). Additionally, we examined the use of standard severity scores in the ICU, including APACHE II and PSI, to predict 30-day mortality in critically ill influenza patients, and the performance of APACHE II and PSI was 0.720 (95% CI 0.653 to 0.784) and 0.720 (95% CI 0.654 to 0.7897), respectively (figure 5). Collectively, these data demonstrated the value of XGBoost and SHAP plots for giving physicians an intuitive understanding of key features and for establishing a model that predicts the 30-day mortality of critically ill influenza patients with high accuracy.

Receiver operating characteristic curves showing the performance of the XGBoost model (AUC 0.842, 95% CI 0.749 to 0.928), RF (AUC 0.809, 95% CI 0.629 to 0.891) and LR (AUC 0.701, 95% CI 0.573 to 0.825) for predicting 30-day mortality in critically ill influenza patients. AUC, area under the curve; LR,logistic regression; RF, random forest; XGBoost,extreme gradient boosting.

Receiver operating characteristic curves showing the performance of PSI (AUC 0.720, 95% CI 0.654 to 0.7897) and APACHE II (AUC 0.720, 95% CI 0.653 to 0.784) for predicting 30-day mortality in critically ill influenza patients supporting information files. APACHE, Acute Physiology and Chronic HealthEvaluation; AUC, areaunder the curve; PSI, pneumonia severity index.
Discussion
Using a multicentre severe influenza data set along with XGBoost and SHAP plots, we demonstrated that the ML approach can illustrate key features and establish a mortality prediction model with high accuracy in critically ill influenza patients. The illustration of cumulative domain-specific feature importance and visualised interpretation of feature importance may give physicians an intuitive understanding of the key features within XGBoost. Furthermore, the prediction model, using clinical data in the routine practice of ICU care instead of advanced molecular biomarkers, can potentially be integrated into a computerised clinical decision support system in the future.
Consistent with other studies on severe influenza,8 9 we found that both APACHE II and PSI had a discriminative power of approximately 0.72 in the ROC analysis, which is generally deemed acceptable accuracy for a single parameter (figure 5). The expected finding that the ML approach outperformed PSI and APACHE II in critically ill influenza patients should reflect the capability of ML to establish an influenza-specific weighting model using all of the obtained data. Unlike other critical diseases, which are mainly characterised by shock-associated manifestations, severe influenza is characterised by severely compromised oxygenation, so-called ARDS. Our previous studies have also found that early lung-protective ventilation and early fluid balance were associated with mortality in patients with severe influenza,15 16 a result that is consistent with current concepts of the early lung-protective ventilation strategy and dry-lung strategy in the management of patients with ARDS.21 22 Therefore, it was reasonable to find that the ventilation domain (cumulative feature importance: 0.113) and fluid balance domain (cumulative feature importance: 0.253) were of particular importance in the present study, reflecting the additional weights on these two domains in XGBoost compared with those in conventional severity scores, including APACHE II and PSI. Notably, the parameters in the ventilation domain and fluid balance domain were all recorded on a routine daily basis in the ICU, and hence, the established prediction model should be generalisable to other settings. Taken together, the results of this study demonstrate that the use of an ML approach, mainly XGBoost, in a real-world data set was capable of establishing a practical DSS in critically ill patients with a specific aetiology, namely, severe influenza.
Critical care medicine requires prompt decision-making based on clinical data that can be interpreted with the assistance of automated DSS. Increasing evidence has shown the potential of ML-based automated DSS in critical care medicine. Taylor et al, using electronic health records and ML algorithms, including the RF model, recently reported that the ML-based approach was superior to traditional logistic regression for predicting in-hospital mortality in patients admitted to the emergency department for sepsis.30 In line with our ML approach, Allyn et al compared an ML-based approach to traditional scoring systems (EuroSCORE I and EuroSCORE II) for predicting mortality in patients receiving elective cardiac surgery and found that the ML-based approach (AUC: 0.795, 95% CI 0.755 to 0.834) outperformed EuroSCORE I (AUC: 0.737, 95% CI 0.691 to 0.783) and EuroSCORE II (AUC: 0.742, 95% CI 0.698 to 0.785).31 In addition to predicting mortality, Horng et al recently reported an ML-based model that included vital signs, demographic data and free-text data to identify patients with infection in the emergency department (AUC: 0.85, 95% CI 0.84 to 0.86) and proposed a potential automated trigger for sepsis clinical decision support in the emergency department.32 Therefore, the accuracy of the prediction model in the field of critical care medicine appears to increase from approximately 0.7 in the conventional scoring system to nearly 0.8 in ML models.
In the present study, we found a similar test accuracy between XGBoost (AUC 0.842) and RF (AUC 0.809), whereas the accuracy of LR was poor (AUC 0.701). Indeed, LR is a widely used interpretable algorithm and works well if a single decision boundary exists. However, LR is based on a number of assumptions, including the independence between input variables and a linear correlation between input and output variables, whereas the real-life data set may not meet all the assumptions of LR. We postulate that the assumption of a linear relationship between the input variables and the outcomes might at least partly account for the restively low accuracy of LR in this study, as the complex biological events in severe influenza may be correlated with each other in a non-linear model. Instead, tree-based classifiers, including RF and XGBoost, based on homogeneity appeared to fit the characteristics of the data set in the present study. We thought that the application of regularisation, using Taylor expansion to approximate the loss function, and high flexibility to allow for fine-tuning might enable XGBoost to perform slightly better than RF. Taken together, our findings suggest that the XGBoost approach can illustrate the feature importance and establish a mortality prediction model with high accuracy, and this approach has a high potential for practical implementation because it can be integrated with existing computerised healthcare information systems.
Although ML techniques have made substantial advances in many domains, the clinical application of ML-based algorithms in healthcare has not always been straightforward. One major issue that needs to be tackled is the clarification of the black-box issue, rather than higher accuracy, to reassure clinicians in the application of ML-based algorithms in clinical practice.20 33 34 Given that the nature of ML is based on accuracy-driven performance metrics, it is likely that the model of ML will continue to become even more opaque. Therefore, the black-box problem will remain an issue in the application of ML-based algorithms for patient care. Tree-based ML algorithms, including RF and XGBoost, are characterised by the potential for interpretation; however, ensembles of hundreds of trees, which are essential to improve the predictive capability, are essentially not interpretable.35 In the field of medicine, given that the goal of interpretability is to help the physician make a decision based on numerous clinical variables, the interpretability should mimic the behaviour of physicians in real-world practice, rather than merely providing explanations of the logical concepts behind the black box.36 In the present study, we not only demonstrated the feature importance, a quantitative score that considered the feature’s use in the construction of the tree models, categorised by clinical domain of real-world practice in critical care medicine but also provided a visualised interpretation using SHAP plots. SHAP, developed by Lundberg and Lee, is an additive feature attribution method that provides an explanation of the tree ensemble's overall impact in the form of particular feature contributions and is relatively consistent with human intuition.26 Additionally, we used local interpretable model-agnostic explanations (LIME) to illustrate the impact of key features at the individual level, and the results of LIME were consistent with the findings from SHAP and will enable physicians to apply the ML model to individual patients (online supplementary figure 2).34 37 However, it is noteworthy that LIME mainly illustrated key features by applying a local linear model. We believe that the concern of the black-box issue should be mitigated by applying these measures, which are designed to interpret the model.
There are limitations to this study that merit discussion. First, the number of subjects was relatively small. Given that only one per cent of patients with influenza-like illness develop severe influenza, the sample size in studies on severe influenza is generally small.38 As the main focus of the study was to determine predictors for mortality in ICU patients with proven influenza, the enrollees in this study actually accounted for 44.2% (72/163) of deaths among patients with severe influenza during the reported influenza epidemic in Taiwan.17 To mitigate the issue of small sample size, we have performed cross-validation (k=5) of XGBoost, RF and LR. The evaluation metric for cross-validation was the error rate of classification (ie, the number of wrong predictions divided by the total number of predictions). The accuracy for XGBoost, RF and LR were 0.792±0.022, 0.786±0.010 and 0.732±0.059, respectively. These findings are consistent with the data in the manuscript. Second, the study employed a retrospective design, though most research on influenza is retrospective, and evidence obtained from retrospective studies, including the present investigation, might be valuable for future epidemic or pandemic influenza preparations.39 40 Third, there was a small improvement in the accuracy of mortality prediction. In the fields of critical care medicine and influenza epidemics, small improvements in the accuracy of predicting mortality may have a major impact on various aspects of healthcare, including patient care and resource allocation. Fourth, we used variables within 7 days as independent variables instead of time-varying variables to predict 30-day mortality. Finally, we did not include hospital-factor in the present study despite a slight increase of accuracy of XGBoost given that we aimed to establish a mortality prediction model with high generalisability in critically ill influenza patients (online supplementary figure 3).
Conclusions
In conclusion, using a multicentre severe influenza data set, we found that the ML approach, particularly XGBoost, outperformed traditional severity scoring systems, including APACHE II and PSI, for predicting mortality among critically ill influenza patients. We used domain-based feature importance and SHAP plots for visualised realisation and these approaches should at least partly mitigate the concern of black-box issue. Future prospective research is warranted to validate the proposed model and to translate the advantages of ML models into improved patient outcomes through automated and real-time DSS.
Acknowledgments
The Taiwan Severe Influenza Research Consortium (TSIRC) study included the following investigators (all in Taiwan). Taipei: National Taiwan University Hospital–HCW, SCK, JYC and YCC. Taipei Veterans General Hospital–K-YY, W-CC and JYF. Tri-Service General Hospital–WCP and CKP. Taoyuan: Chang Gung Memorial Hospital–KCK, LCC, HCH and KWC. Taichung: Taichung Veterans General Hospital–CLW, MCC, WCC, CHT, YHH and ZRZ. China Medical University Hospital–SJL and WCC. Kaohsiung: Kaohsiung Medical University Hospital–CCS, JRT, MJT and WAC. Kaohsiung Chang Gung Memorial Hospital–WFF, YMC, CYL and HCK. Hualien: Hualien Tzu Chi Hospital–YTC.
References
Footnotes
C-AH and C-MC contributed equally.
Contributors Study concept and design: CA-H, CM-C, Y-CF, S-JL, H-CW, W-FF, C-CS, W-CP, K-YY, K-CK, C-LW, C-ST, M-YL and W-CC. Acquisition of data: Y-CF, CM-C and W-CC. Analysis and interpretation of data: W-CC, Y-CF, CM-C, CA-H and M-YL. Drafting the manuscript: W-CC.
Funding This study was supported in part by grants from Veterans General Hospitals and the University System of Taiwan Joint Research Program (VGHUST108-G2-4-2). The funders had no role in the study design, data collection and analysis, decision to publish or preparation of the manuscript.
Competing interests None declared.
Patient consent for publication Not required.
Ethics approval Taichung Veterans General Hospital CE16093A, National Taiwan University Hospital 201605036RIND, Taipei Veterans General Hospital 2016-05-020CC, Tri-Service General Hospital 1-105-05-086, Chang Gung Memorial Hospital 201600988B0, China Medical University Hospital 105-REC2-053(FR), Kaohsiung Medical University Hospital KUMHIRB-E(I)-20170097, Kaohsiung Chang Gung Memorial Hospital 201600988B0.
Provenance and peer review Not commissioned; externally peer reviewed.
Data availability statement All data relevant to the study are included in the article or uploaded as supplementary information. All of the data and materials are provided in the manuscript and the supplemental data. The data set has been put in public Github, and is available via https://github.com/GitEricLin/BMJOpen/.