Article Text

Abstract
Objective To compare recent and long-term physical activity levels as predictors of cardiometabolic risk in a risk factor-free adult population.
Design A 12-year prospective cohort study.
Setting The Finnish Public Sector study with surveys conducted in four waves at 4-year intervals.
Participants 19 230 participants (mean age 50.2 (SD 9.1) years, 84% women) with no prevalent cardiometabolic risk factors at wave 3 were included. Physical activity was assessed at waves 1, 2 and 3. The long-term physical activity level was determined as the mean of activity from wave 1 to 3 (over 8 years).
Outcome measure 4-year incidence of cardiometabolic risk factors (obesity, hypertension, dyslipidaemia and diabetes) after wave 3, measured individually and as a sum (accumulation of two or more risk factors vs none). Logistic and multinomial logistic regression analyses were used for the analysis.
Results Graded associations between higher physical activity levels and lower odds of all risk factors were observed (p for trend <0.01). In comparison with the persistently vigorously active participants (≥60 metabolic equivalent (MET)-hours/week), those who were persistently inactive (<7 MET-hours/week) were about four times more likely to develop obesity (OR=4.24, 95% CI=2.83 to 6.36), two times more likely to develop hypertension (OR=2.02, 95% CI=1.45 to 2.82) and dyslipidaemia (OR=1.82, 95% CI=1.03 to 3.22) and eight times more likely to develop diabetes (OR=7.84, 95% CI=1.78 to 34.6). The corresponding OR for accumulating two or more risk factors was 5.24-fold (95% CI=2.39 to 11.47). For recently inactive versus recently vigorously active, the estimates were weaker (OR=2.36, 95% CI=1.71 to 3.25 for obesity; 1.78, 95% CI=1.35 to 2.35 for hypertension; 1.71, 95% CI=1.04 to 2.82 for dyslipidaemia; 3.56, 95% CI=1.06 to 11.96 for diabetes and 2.66, 95% CI=1.48 to 4.78 for ≥2 risk factors).
Conclusion Cardiometabolic risk associated with physical inactivity is better captured by repeated measurements of physical activity than by a single measurement of the most recent activity level.
- diabetes
- dyslipidaemia
- hypertension
- obesity
- physical activity
This is an open access article distributed in accordance with the Creative Commons Attribution Non Commercial (CC BY-NC 4.0) license, which permits others to distribute, remix, adapt, build upon this work non-commercially, and license their derivative works on different terms, provided the original work is properly cited, appropriate credit is given, any changes made indicated, and the use is non-commercial. See: http://creativecommons.org/licenses/by-nc/4.0/.
Statistics from Altmetric.com
Strengths and limitations of this study
Finnish Public Sector study with repeated measurements of physical activity over 8 years.
A large sample of risk factor-free adult population.
Survey data linked to the records of national health registers to ascertain incident hypertension, dyslipidaemia and diabetes.
Limitations include the self-reported assessments of physical activity and body mass index.
Lack of data on total physical activity, sedentary time, dietary intake and metabolic traits.
Introduction
Physical inactivity is among the leading risk factors for the burden of disease, ranking at the 14th position globally and at the 11th position in high-income countries.1 Physical inactivity increases the risk of cardiometabolic diseases, such as diabetes, coronary heart disease and stroke, while also contributing to other health outcomes, such as specific cancers and mortality.2–5 Randomised controlled trials have shown cardiometabolic benefits of physical activity interventions even with short-term follow-up periods.6 Prospective observational studies have reported a lower health risk in physically active individuals as compared with inactive individuals.7 These studies have typically relied on a single assessment of physical activity, which does not take into account that physical activity may change over time.8 To date, very few studies with repeated measurements of physical activity in healthy population are available.9 Thus, the effect of long-term physical activity for the prevention of cardiometabolic risk remains uncertain.
In this study with a risk factor-free adult population, we examined whether the long-term physical activity level based on repeated measurements over an 8-year period was associated with subsequent incidence and accumulation of obesity, hypertension, dyslipidaemia and diabetes more strongly than the physical activity level based on a single measurement.
Methods
Study population
The study population consisted of participants of the Finnish Public Sector (FPS) study, an ongoing open cohort study on employees in 10 towns and 6 hospital districts in Finland, including all those who were employed for a minimum of 6 months between the years 1997 and 2005.10 The FPS participants represent a wide range of occupations from semiskilled cleaners to physicians and mayors. The material has been collected through surveys at 4-year intervals since 1997/1998. Survey questionnaires were sent to all current employees of the target organisations as well as those who had participated in the earlier surveys but were no longer employed by the relevant organisation. Responding to the survey was always voluntary, and, by responding, the cohort members gave a permission for their responses to be linked to the national health registers. The participants of the current study had responded to the surveys in 1997/1998 (wave 1), 2000/2002 (wave 2), 2004/2005 (wave 3) and 2008/2009 (wave 4), or in 2000/2002 (wave 1), 2004/2005 (wave 2), 2008/2009 (wave 3) and 2012/2013 (wave 4). For the analyses, all data were pseudonymised, and researchers had only access to data with research identifications.
Of the participants who had responded at wave 1 (n=53 416, 71% from the eligible population), 32 004 also responded at waves 3 and 4. Those who responded at waves 3 and 4 were older (44.9 (SD 9.1) vs 42.3 (SD 9.8) years), more often women (83% vs 78%) and highly educated (57% vs 49%) at wave 1 than those who did not respond at waves 3 and 4 (n=18 339). We excluded from the analysis participants who had missing information on physical activity at waves 1 and 3 (n=575), missing information on risk factors at waves 3 and 4 (n=2164), history of cardiovascular events at wave 3 (n=494) and ≥1 risk factors at wave 3 (n=9541). The final sample included 19 230 risk factor-free participants (mean age 50.2 (SD 9.1) years, 84% women). For details of the sample selection, see figure 1. In terms of age, sex and education, the cohort with wave 1 in 1997/1998 (n=6303, mean age 50.1 (SD 8.7) years, 87% women, 60% high education) did not differ from the cohort with wave 1 in 2000/2002 (n=12 927, mean age 50.3 (SD 9.2) years, 83% women, 61% high education).

The selection of the sample for analysis.
Assessment of physical activity
Physical activity was assessed repeatedly at waves 1, 2 and 3. The respondents were asked to estimate their average weekly hours of both leisure time and commuting physical activity during the past year using four different intensity levels: walking, brisk walking, jogging and running (or other activities with a corresponding intensity level). Each intensity level had five response alternatives, and the class midpoints were used to calculate the time spent for each intensity level: no activity (0 min used for calculation), less than 0.5 hours (15 min), ~1 hour (45 min), 2–3 hours (2.5 hour) and ≥4 hours/week (5 hour).11 The time spent on physical activity at each intensity level, given in hours per week, was multiplied by the average energy expenditure of each activity (3.5, 5, 8 and 11 metabolic equivalents (METs) for walking, brisk walking, jogging and running, respectively). The volume of physical activity at each study wave was quantified as MET-hours/week.12
The participants were categorised into five physical activity categories by (1) the volume of physical activity reported at wave 3 (recent physical activity level) and (2) by the mean level of physical activity across waves 1–3 (long-term physical activity level). The five categories were as follows: inactive (<7 MET-hours/week), low (≥7–<14 MET-hours/week), moderate (≥14–<30 MET-hours/week), high (≥30–<60 MET-hours/week) and vigorous activity level (≥60 MET-hours/week). Most of the participants (81%) had physical activity data available from all of the three study waves.
Assessment of cardiometabolic risk factors
For the cardiometabolic risk factors examined as outcomes, data on hypertension, dyslipidaemia and diabetes were obtained from the national health registers. To identify cases of hypertension, dyslipidaemia and diabetes, we used data on prescription purchases of antihypertensive medication, lipid-lowering medication (statins) and antidiabetic medication, respectively, as described previously.13 Those participants who had become eligible for special reimbursement for antihypertensive or diabetes treatment, or who had purchased antihypertensive, lipid-lowering or diabetes medication for a minimum of 3 months’ dose for the first time after wave 3, were considered as incident cases of hypertension, dyslipidaemia or diabetes.13 Incident obesity was defined as body mass index (BMI) ≥30 kg/m2 based on self-reported body weight and height.
Accumulation of risk factors was calculated for each participant at wave 4 as a sum of incident hypertension, dyslipidaemia, diabetes and obesity (range from 0 to 4), and categorised into 0, 1 and ≥2 risk factors.
Covariates
All covariates were derived from wave 3. Participants’ age and gender were obtained from the employers’ registers. The highest educational level of the participants, obtained from Statistics Finland, was coded as low (≤9 years), intermediate (>9 to≤12 years) or high (>12 years). Occupation was dichotomised into non-manual (ISCO 1–4) and manual (ISCO 5–9) occupations according to the International Standard Classification of Occupations (ISCO).14 Behavioural health risks (high alcohol consumption and current smoking) were defined on the basis of the survey responses. High alcohol consumption was indicated by self-reported average consumption of more than 288 g/week of pure alcohol for men and 192 g/week for women, or having passed out due to excessive alcohol consumption at least once during the past 12 months. Self-reported smoking status was dichotomised into current smoker and current non-smoker. Information on prevalent chronic conditions (0 /≥1), including asthma, rheumatoid arthritis, cancer or depression, was obtained from the national health registers.
Patient and public involvement
This is a secondary analysis of pre-existing datasets. No patients were involved in setting the present research question, the outcome measures or in developing the plans for recruitment, design or implementation of the study. No patients were asked to advice on the interpretation or writing up of results. The dissemination plan is targeted to a wide audience, including members of the public, patients, health professionals and experts in the specialty through various channels: written communication, events and conferences, networks and social media.
Statistical analysis
Logistic regression was used to examine the association between recent and long-term physical activity levels and subsequent 4-year incidence of the individual cardiometabolic risk factors. Multinomial logistic regression was used to examine the association between physical activity levels and accumulation of cardiometabolic risk factors, with those having none of the risk factors as the reference category. All the models were adjusted for age, sex, education, occupation, alcohol consumption, smoking status and prevalent chronic conditions at wave 3. The SAS V.9.4 Statistical Package was used for the analyses (SAS Institute).
Results
At wave 3, the mean age of the participants was 50.2 (SD 9.1) years. Of the participants, 84% were women, 61% had high education, 67% had non-manual occupation, 9% had high alcohol consumption, 11% were current smokers and 22% had ≥1 prevalent chronic conditions (table 1). At wave 3, 8% of the participants reported vigorous, 31% high, 31% moderate, 17% low and 13% inactive physical activity level.
Characteristics of the study population at the start of the risk factor follow-up (wave 3)
Figure 2 shows the associations between recent and long-term physical activity levels and 4-year incidence of different cardiometabolic risk factors. Overall, we found a graded relationship between higher physical activity levels and lower odds for each cardiometabolic risk factor (recent physical activity p for trend ≤0.0095, long-term physical activity p for trend ≤0.0065). Both recent and long-term physical activity levels were similarly associated with the risk of incident hypertension and dyslipidaemia: the lower the activity, the higher the risk. Similar relationships were seen for incident obesity and diabetes, but the odds were two times higher for the less active than for the vigorously active when using the long-term physical activity level as the exposure.

Association between recent and long-term physical activity levels and incident cardiometabolic risk factors. Adjusted for age, sex, education, occupation, alcohol consumption, smoking and prevalent chronic conditions at wave 3.
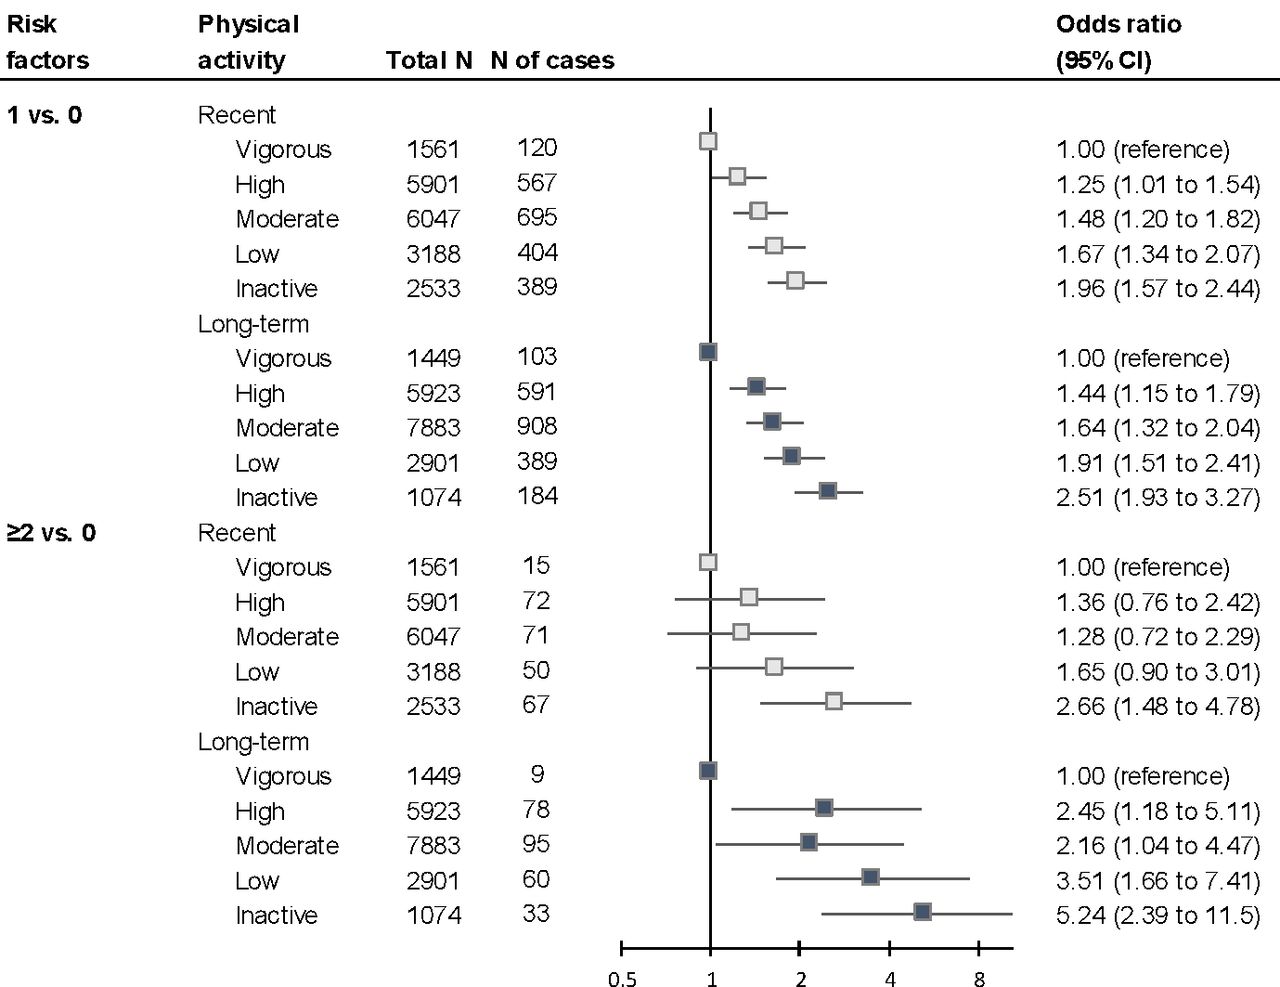
The association between recent and long-term physical activity levels and accumulation of risk factors is illustrated in figure 3. The graded association for developing one risk factor versus none (1 vs 0) was similar for recent and long-term physical activity, the odds being highest for the inactive. The odds for accumulating more than one (≥2 vs 0) risk factors were higher for the long-term physical activity. For example, as compared with the vigorously active participants, the risk of having ≥2 risk factors was 2.7 times higher for the recently inactive and 5.2 times higher for persistently inactive individuals.

Association between recent and long-term physical activity levels and accumulation of cardiometabolic risk factors. Adjusted for age, sex, education, occupation, alcohol consumption, smoking and prevalent chronic conditions at wave 3.
Discussion
In this prospective cohort study based on repeated measurements of physical activity over 8 years, we observed a graded relationship between higher physical activity levels and lower incidence of subsequent cardiometabolic risk factors, namely obesity, hypertension, dyslipidaemia and diabetes. These associations were substantially stronger for long-term physical activity level as compared with a single measurement of recent physical activity level.
Our results corroborate previous findings showing that engagement in regular physical activity reduces the risk of cardiometabolic risk factors.15–18 Our findings also strengthen the evidence of an inverse dose–response relationship between the level of physical activity and cardiometabolic risk.7 19 Furthermore, our study adds new evidence to support the superiority of using repeated measurements of physical activity rather than a single most recent measurement of physical activity for prediction of future cardiometabolic risk, especially among risk factor-free but less active adults. Those who were persistently inactive were at the highest risk for developing and accumulating cardiometabolic risk factors, which further highlights the health burden related to physical inactivity.4
The strengths of this study include the repeated measurements of physical activity in adult population and the large number of risk factor-free participants included in the analysis. Data on all cardiometabolic risk factors, except for obesity, were obtained from reliable national health registers, and the risk factors were explored both individually and for their accumulation. It was not possible to differentiate cases of type 1 and 2 diabetes from the prescription purchase data, but any new cases of diabetes in an adult population at the average age of 50 are likely to be of type 2. Metabolic data were not available for this study, which precludes comparisons of adiposity, glycaemic traits or systolic and diastolic blood pressure between physically active and inactive participants. Since BMI was based on self-reported values, it was likely to be underestimated, which is a weakness of this study.
There are also other limitations that should be acknowledged. The self-reported assessment of physical activity could be regarded as a weakness of this study, because it may be susceptible to under-reporting.20 However, the current physical activity recommendations are still grounded on studies using self-reported physical activity data,21 and it is not yet possible to obtain accelerometer measured data on physical activity over a period of 8 years with a large sample size. We had no information on work-related physical activity and, thus, were unable to obtain an estimate of total activity during the day. Nevertheless, adjustment for occupation, a correlate of work-related physical activity, had little effect on the results, which suggests that this is not a major source of confounding. We were also not able to estimate sedentary behaviour, which is regarded as an independent risk factor for cardiometabolic diseases, at least for those with low levels of physical activity.7 The lack of dietary data is another major limitation of this study, because the cardiometabolic risk factors are strongly influenced by dietary factors.22 23 Changes in the energy intake and/or food quality during the follow-up period may have influenced our findings. Finally, the high proportions of highly educated persons and women in the study participants are in agreement with the characteristics of public sector employees in Nordic welfare settings, but they may limit the generalisability of our results beyond this population.
In conclusion, our findings suggest that cardiometabolic risk associated with physical inactivity is better captured by repeated measurements of physical activity than by a single measurement of activity level.
References
Footnotes
Contributors MK and JV had substantial contributions to the conception of the study, design of the work and acquisition of the data. TL, SS, AP and JP participated to the analysis and interpretation of data. TL drafted the manuscript, and SS, AP, JP, MK and JV revised it critically. All authors approved the final version.
Funding This study was supported by funding granted by the Juho Vainio Foundation, Finland (to TL); the Academy of Finland (Grants 286294, 294154 and 319246 to SS; 633666 to MK; 309526 to TL); the Finnish Ministry of Education and Culture (to SS); NordForsk (to MK and JV) and the UK MRC (Grant K013351 to MK).
Competing interests None declared.
Patient consent for publication Not required.
Ethics approval The Finnish Public Sector study has been approved by the Ethics Committee of the Hospital District of Helsinki and Uusimaa (HUS/1210/2016).
Provenance and peer review Not commissioned; externally peer reviewed.
Data availability statement Data are available upon reasonable request. Deidentified participant data, Finnish Public Sector Cohort.