Article Text

Abstract
Objective Patients with type 2 diabetes mellitus (T2DM) often experience hypoglycaemia and weight gain due to treatment side effects. Sulfonylureas (SU) and the combination of SU and metformin (SU+MET) were the most common monotherapy and combination therapies used in Thailand tertiary care hospitals. This study aimed to assess the glycaemic goal attainment rates, hypoglycaemic episodes, weight gain and treatment compliance among patients with T2DM receiving SU or SU+MET.
Research design and methods A multicentre cross-sectional survey and retrospective review was conducted in five tertiary care hospitals, Thailand. Patients with T2DM aged ≥30 years were included consecutively during a 12-month period. Glycaemic control, experiences of hypoglycaemia, weight gain and compliance were evaluated. Glycaemic goal attainment was defined by HbA1c level less than 7%.
Results Out of the 659 patients (mean age (±SD)), 65.5 (10.0) years and median duration of T2DM (IQR), 10 (5–15) years), 313 (47.5%) achieved the glycaemic goal. HbA1c levels in the patients with goal attainment was significantly lower compared with those without (6.3%±0.5% vs 8.1%±1.2%, p<0.001). Goal attainment was significantly lower among patients treated with SU+MET than those treated with SU alone (43.5% vs 63.0%; OR 0.45, 95% CI 0.31, 0.66, p<0.001). A third of patients reported experiencing hypoglycaemia (30.7%) and weight gain (35.4%). Weight gain in the SU+MET group was lower than those receiving SU alone (33.1% vs 44.6%, p=0.015), but there was no difference in hypoglycaemic events. Major events in the previous 12 months were experienced by 68 patients, most commonly congestive heart failure and ischaemic heart disease. Approximately half of the patients (52.2%) reported not always taking their medication as prescribed.
Conclusions Among patients with T2DM receiving SU or SU+MET, only about half of the patients achieved glycaemic goal and compliance with the treatment. Hypoglycaemia and weight gain posed a significant burden with risk of weight gain higher in the SU group.
- HbA1c
- type 2 diabetes
- sulfonylurea
- metformin
- hypoglycemia
This is an open access article distributed in accordance with the Creative Commons Attribution Non Commercial (CC BY-NC 4.0) license, which permits others to distribute, remix, adapt, build upon this work non-commercially, and license their derivative works on different terms, provided the original work is properly cited, appropriate credit is given, any changes made indicated, and the use is non-commercial. See: http://creativecommons.org/licenses/by-nc/4.0/.
Statistics from Altmetric.com
Strengths and limitations of this study
Glycaemic goal attainment and clinical laboratory results in this study were collected in real-world settings in patients with type 2 diabetes mellitus who were treated with either sulfonylurea (SU) monotherapy or combined treatment of SU and metformin.
Self-reported hypoglycaemia, worry of hypoglycaemia, weight gain, fear of weight gain and compliance with medication were collected and reported along with the related factors.
The study was carried out in tertiary care hospitals, so the results may not be generalisable to patients from other settings.
The observational nature of this study does not rule out the role of residual confounding variables in observed associations.
Use of the patient surveys and self-reported treatment experiences can underestimate hypoglycaemia associated with oral hypoglycaemic agents.
Introduction
Type two diabetes mellitus (T2DM) is the most common form of DM, accounting for approximately 90% of all cases diagnosed worldwide. The clinical heterogeneity of patients with T2DM, in terms of characteristics such as duration of diabetes and comorbid illnesses greatly increase the challenge of providing care.1 A longer duration of diabetes is associated with more complications and difficulty maintaining glycaemic control. The American Diabetes Association (ADA)2 and Diabetes Association of Thailand recommend a haemoglobin A1C (HbA1c) target of <7.0% for most patients. For patients with HbA1c>9%, a combination of two or more oral hypoglycaemic agents and/or insulin should be considered. Sulfonylurea monotherapy (SU) or the combination with metformin (SU+MET) have been the most commonly prescribed oral antidiabetic drugs in some Asian countries.3 In Thailand, about a third of the patients (31%) receive monotherapy and a vast majority (69%) receives combination therapy.4 The prescribing patterns showed that SU-based monotherapies are very common. SU was the most commonly prescribed monotherapy treatment (42%), more so than MET monotherapy, and SU+MET was the most commonly prescribed combination therapy (60.2%).4
Diabetes is associated with nearly double the risk of death, mainly from cardiovascular disease. Some oral hypoglycaemic agents may increase the risk of cardiovascular events.5 6 Related studies have shown users of SU had a 43% increased risk of all-cause mortality and 70% increased risk for cardiovascular disease mortality compared with patients treated with MET.7 8 More recently, monotherapy with first-generation or second-generation SU was significantly associated with a 24%–61% increased risk for all-cause mortality and second-generation SU drugs had 18%–30% increased risk for congestive heart failure.9 Patients with T2DM treated with SU are at high risk of hypoglycaemia, weight gain and cardiovascular disease. In a review of 1418 reported cases of severe hypoglycaemia, 59% of events were related to SU use,10 and in the first year of the UK Prospective Diabetes Study (UKPDS), 31% of patients treated with glibenclamide experienced hypoglycaemic symptoms, which was a similar proportion to those receiving insulin.11
Patients often gain weight due to the side effects of current therapies, particularly SU, insulin and glitazone therapies. In addition, frequent intake of food between regular meals to avoid hypoglycaemic events increases the potential for significant weight gain in a population of patients who are already at an increased risk from cardiovascular morbidity and mortality.12 Due to the barrier of hypoglycaemia and weight gain, therapies such as SU may not be able to lower glycaemic levels sufficiently or long enough to optimally reduce microvascular and macrovascular end points. It may be prudent to avoid SU monotherapy as the first-line treatment, among patients with pre-existing cardiovascular conditions as further research in this area is needed. Therefore, treatment with SU may present a particular risk for patients with pre-existing cardiovascular or renal disease. For patients in these practice settings, treatment patterns, goal attainment rates and long-term diabetes complication rates remain unknown. To address these issues, we assessed the goal attainment rates, frequency and severity of hypoglycaemic episodes, weight gain experiences and treatment compliance among Thai patients with T2DM who had been treated with SU monotherapy or SU and MET combination therapy.
Materials and methods
Study design and setting
A multicentre, observational, retrospective and cross-sectional study was conducted in five tertiary care hospitals in Thailand (ie, Srinagarind, Phramongkutklao, Ramathibodi, King Chulalongkorn Memorial and Siriraj Hospitals). Patients with T2DM clinical charts were retrospectively reviewed in order to identify potential patients. The potential patients were invited and enrolled into the study between February 2013 and March 2015. The potential patients were screened during a 6-month study enrolment period. Eligible patients were enrolled into the study at usual physician office visits. Prespecified medical data were extracted for the 12-month period before a patient’s study enrolment date. Patients satisfying the selection criteria were enrolled in the study after providing written informed consent to participate.
Study population
The study population comprised adults diagnosed with T2DM according to ADA criteria, and 30 years of age or older, who had been treated with SU monotherapy or SU and MET combination (SU+MET) therapy for at least 6 months by an endocrinologist, cardiologist, nephrologist or family practitioner. Patients who required daily concomitant insulin, were pregnant, had diagnosis of T1DM or gestational diabetes, receiving oral diabetic medications other than SU or SU+MET, already participating in another clinical study, or could not complete the questionnaire, were excluded.
Sample size
We estimated the sample size by using the following formula13
 . In the Asia Pacific Real-Life Effectiveness and Care Patterns of Diabetes Management Study,14 the prevalence of hypoglycaemia was reported at 36% (95% CI 33.8% to 37.8%). Assuming a proportion of 0.36, a confidence level of 0.95 and a desired margin of error of ±3.5%, 723 subjects were required for this study.
Study measurements
Age, gender, height, weight, duration of diabetes, age at diagnosis, smoking status, alcohol consumption, physical activity, family history, presence and type of macrovascular and microvascular complications and comorbid conditions were retrospectively reviewed by physicians or trained chart reviewers using the patients’ medical charts and data were entered into standardised data collection forms. The prespecified information from medical charts was extracted for the 12-month period before the patient enrolment date.
On the study enrolment date, all participating patients were subjected to a standard blood draw to cross-sectionally assess HbA1c, fasting plasma glucose (FPG), serum creatinine, total-cholesterol, LDL-cholesterol, HDL-cholesterol, triglyceride and urinary albumin levels after overnight fasting. Since performing the blood and urine tests on the enrolment date was not always possible, the collection of blood or urine samples could be performed within 7 days after the enrolment date. Each patient’s body weight, blood pressure and waist circumference were also cross-sectionally measured and recorded. Goal attainment was defined as having HbA1c <7% on the date of enrolment.
The Experience of Low Blood Sugar (hypoglycaemia) Questionnaire (online supplementary I) developed by the Merck Sharp & Dohme Corp was used to measure patients’ experience of hypoglycaemia during the previous 6 months. The questionnaire contained six items which could be answered by yes/no or by using a 5-point Likert Scale. The patients’ hypoglycaemia symptoms were then stratified by severity (from none, mild, moderate, severe and very severe) and subsequently classified according to having experienced hypoglycaemia (yes/no) and the maximum severity of hypoglycaemic episodes experienced. The patient’s worry of hypoglycaemia was assessed by using the worry scale of the Hypoglycaemia Fear Survey Questionnaire.15 Each item was answered using a 5-point Likert Scale from being never, rarely, sometimes, often and almost always worried, respectively.
Supplemental material
A questionnaire was developed by Mapi Values (online supplementary II) to measure patients’ experiences of weight gain during the previous year. The questionnaire contained five items which could be answered using 3-point, 5-point or 6-point Likert Scales. In addition, the Fear of Weight Gain Questionnaire developed by Mapi Values was used to measure patients’ fears of weight gain (online supplementary III). The questionnaire contained three items, which were answered using a 5-point Likert Scale ranging from never, rarely, sometimes, often and almost always worry, respectively.
Supplemental material
Supplemental material
Self-reported compliance with medication was assessed by the Self-Report Adherence and Barriers Questionnaire.16 The level of compliance with the medication was assessed on a 5-point Likert Scale (five items), that is, always, usually, sometimes, rarely and never take as prescribed.
Statistical analysis
All comparisons were evaluated using the χ2 test, Fisher’s exact test, t-test, rank-sum test or F-test as appropriate. The OR (95% CI) of glycaemic goal attainment, occurrence of hypoglycaemia and weight gain were predicted using a logistic regression model.
Multivariate relationships were conceptualised using directed acyclic graphs (DAGs), and minimum sets of adjustment variables to obtain unbiased estimates of total and direct effects of various exposure variables on occurrence of hypoglycaemia, treatment, compliance, treatment satisfaction, quality of life, worry about hypoglycaemia and fear of weight gain compatible with the conceptual graph identified (online supplementary IV). The DAG was used as the baseline construct for identifying sets of variables on which it was necessary to condition subsequent multivariate logistic or linear regression models in order to minimise bias in the estimated coefficients. DAGs were constructed using DAGitty software (V. 2.3) and all data analyses were performed using STATA V.14.1 (StatCorp, College Station, Texas, USA). Values of p less than 0.05 were considered statistically significant, unless otherwise specified.
Supplemental material
Patient and public involvement
Neither patients nor public were involved in study planning, design, management, evaluation or interpretation.
Results
Participants and demographics
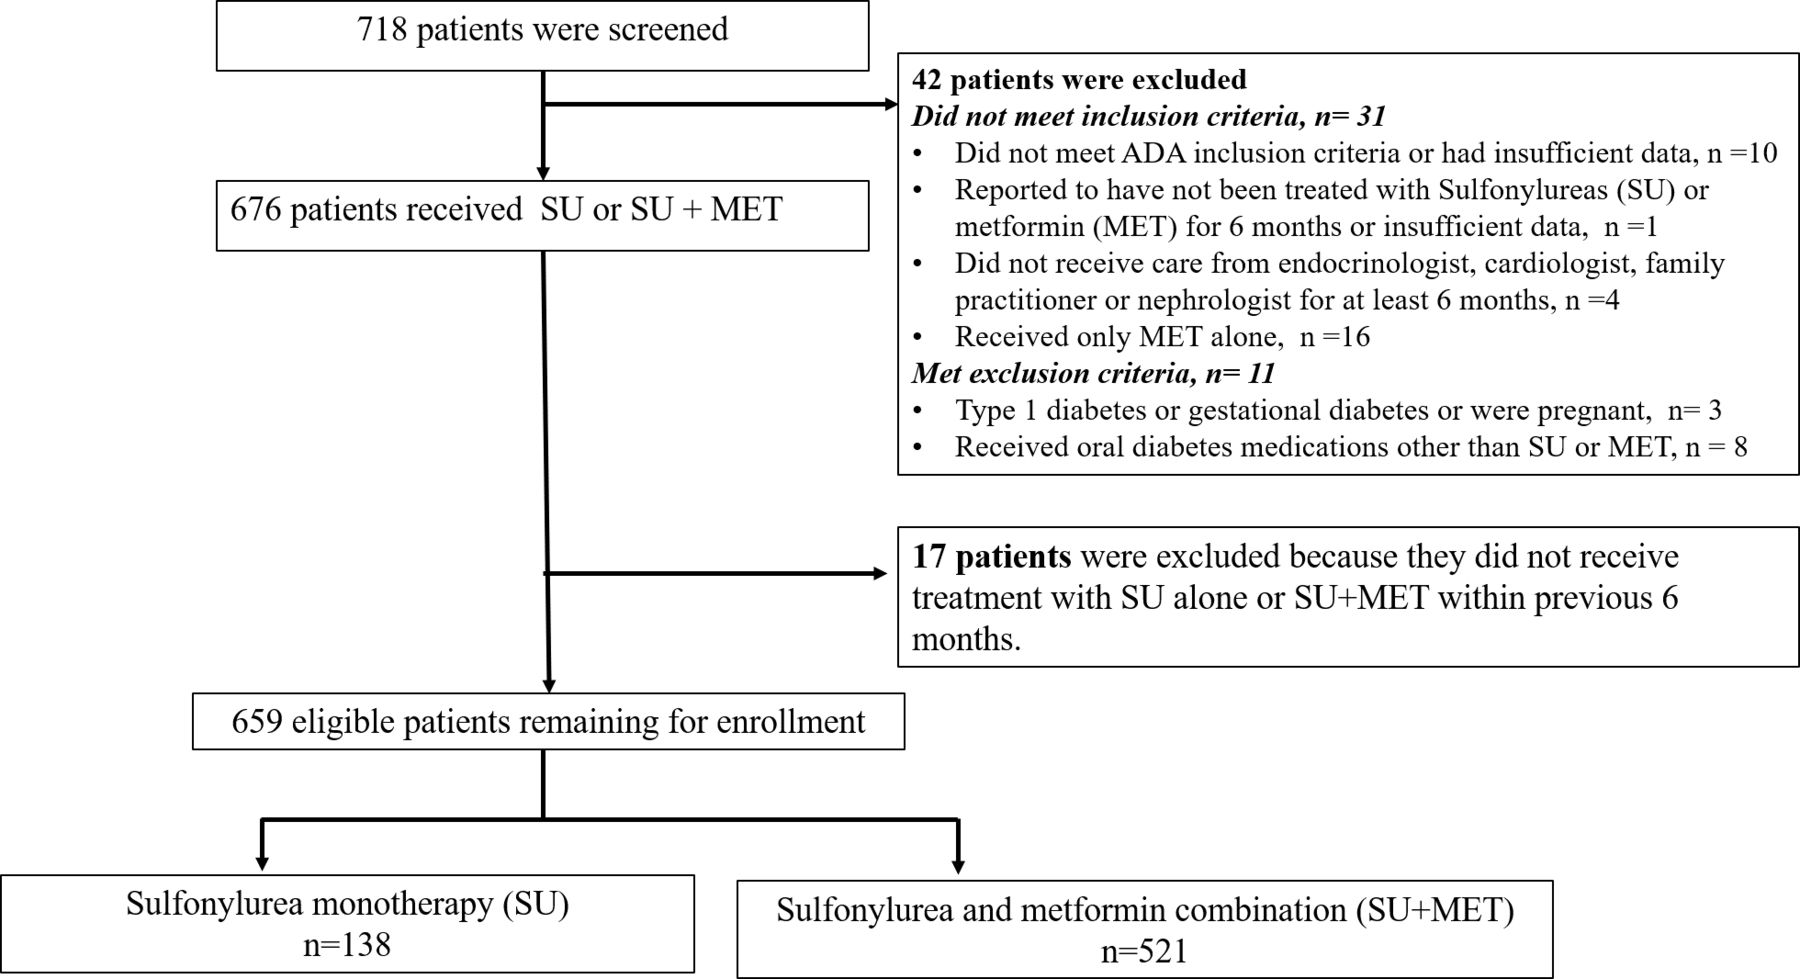
From 718 patients screened, 659 patients were eligible for study analysis. The participant flow is shown in figure 1. One half (50.7%) were female and mean age (±SD) was 65.5 (±10.0) years. Median duration (IQR) since diagnosis of T2DM was 10 (5-15) years; 321 (48.8%) patients reported that a first degree relative had been diagnosed with T2DM (table 1). The number of patients treated by an endocrinologist, cardiologist, nephrologist and family practice physician comprised 304 (46.1%), 172 (26.1%), 119 (18.1%) and 64 (9.7%) of the enrolled patients, respectively.

Participant flow. ADA, American Diabetes Association.
Demographic characteristics of patients receiving SU or SU plus metformin over the previous 6 months (n=659)
A majority of patients (79.1%) had been treated with a combination of SU and MET, while the remaining patients were treated with SU monotherapy (20.9%). The proportion of patients treated with SU alone was highest (41.2%) among those treated in a nephrology clinic and lowest among those treated in an endocrinology clinic (12.5%).
Concomitant medications used in the previous 6 months are shown in table 1. The majority of patients (84.3%) received antihypertensive medications in the previous 6 months. These included angiotensin II receptor blockers, ACE inhibitors, calcium antagonists, β-blockers and others. A similarly large proportion of patients (549, 83.3%) received lipid-lowering medications. These were mostly statins (77.0%) and fibrate class drugs (8%). None of the patients were recorded as having received weight-reducing medication during the 6 months before enrolment.
Goal attainment and related factors
Goal attainment (HbA1c level <7%) was achieved in 313 (47.5%), overall. The levels of HbA1c (6.3%±0.5% vs 8.1%±1.2%, p<0.001) and fasting plasma glucose (125.4±29.8 vs 160.2±46.8, p<0.001) were significantly lower among patients with goal attainment than patients without. Goal attainment was significantly lower among patients treated with SU and MET combination than among those treated with SU alone (43.5% vs 63.0%; OR: 0.45, 95% CI 0.31 to 0.66, p<0.001). The other demographic and laboratory variables did not differ significantly between patients with and without goal attainment (table 2).
Goal attainment (HbA1c <7% on the date of enrolment) by patients’ demographics, medical history, and laboratory and clinical measurements
Hypoglycaemia and related factors
Overall, 202 patients (30.7%) reported experiencing at least one hypoglycaemic event in the previous 6 months. Mild hypoglycaemia episodes (27.8%) were more frequently experienced than severe episodes. Among all patients, the maximum severity of hypoglycaemia ranged from mild (n=119, 18.1%) to moderate (n=67, 10.2%) and severe or very severe (n=15, 2.3%). No significant difference was observed in the proportion experiencing hypoglycaemia, or the maximum hypoglycaemia severity, between treatment with SU alone and treatment with a combination of SU and MET (table 3).
Experience of hypoglycaemic episodes in the previous 6 months by treatment type (n=659)
Demographic and health behaviour variables generally did not differ significantly between patients experiencing and those not experiencing hypoglycaemia. However, the patients having hypoglycaemic episodes were slightly younger (63.9±10.6 years vs 66.2±9.6 years, p=0.008), reported higher frequencies of taking a low sugar diet (57.7% vs 47.6%, OR 1.61, 95% CI 1.06 to 2.44, p=0.018) and were more likely to regularly check their finger-stick blood glucose (22.3% vs 15.1%, OR 1.50; 95% CI 1.08 to 2.10, p=0.033). Laboratory results and clinical measurements on the date of enrolment showed no significant differences between hypoglycaemia groups with the exception of a slightly lower waist circumference among those experiencing hypoglycaemia (table 4). Worry about hypoglycaemia score (ranged from 0 to 4) was progressively greater among patients who experienced greater severity of hypoglycaemia with mean (95% CI) values of 0.28 (0.08 to 0.32), 0.48 (0.37 to 0.59), 0.79 (0.64 to 0.93) and 1.05 (0.75 to 1.36); p<0.001, for no hypoglycaemia, mild, moderate and severe/very severe hypoglycaemia, respectively.
Clinical factors between patient with and without hypoglycaemia in previous 6 months
Multivariate analysis showed that greater maximum severity of hypoglycaemia in the previous 6 months was associated with adherence to a regular diabetic diet (OR 1.68; 95% CI 1.06 to 2.67), whereas lower severity was associated with adherence to a regular exercise plan (OR 0.63; 95% CI 0.45 to 0.88).
Weight gain and related factors
Weight gain in the previous 12 months was reported among 223 patients (35.4%), with no significant differences among clinic settings, but a lower proportion among those receiving SU and MET combination compared with those receiving SU alone (33.1% vs 44.6%, respectively; OR 0.61, 95% CI 0.41 to 0.91, p=0.015). The other demographic and laboratory variables did not differ significantly between patients experiencing and not experiencing weight gain except for significantly higher systolic blood pressure found among patients experiencing weight gain (137.7±17.7 mm Hg vs 133.9±16.5 mm Hg, p=0.007) (table 5). Fear of weight gain score (ranges 0–4) was greater among patients experiencing weight gain (mean (95% CI) 1.08 (0.97 to 1.18) vs 0.40 (0.28 to 0.44), p<0.001). Two variables, hypoglycaemic agents and regular physical activity were identified by the DAG to have an effect on weight gain. However, only hypoglycaemic agents were significant variables based on univariate analysis.
Clinical factors between patient with and without weight gain in previous 12 months
Major events and vascular complications
Major events in the previous 12 months were experienced by 68 patients (10.4%), most commonly congestive heart failure (27.9%) and ischaemic heart disease (11.8%). There was no difference in the number of the major cardiac events, that is, ischaemic heart disease, myocardial infarction and stroke, between the patients treated with SU and SU+MET (online supplementary V). Twenty-eight patients were hospitalised due to the major event. Length of hospital stay ranged from less than 1 day to 43 days, with a mean hospital stay of 6.9 days. Macrovascular and/or microvascular complications were experienced by 137 patients (20.8%), ischaemic heart disease (56.9%), renal failure (13.1%) and stroke (12.4%). For obvious reasons, patients with ischaemic heart disease, congestive heart failure and myocardial infarction were mostly treated in a cardiology clinic and patients with renal failure in a nephrology clinic. Renal failure was more common among patients treated with SU alone (7.3%) than among those treated with a combination of SU and MET (1.5%) which was statistically significant.
Supplemental material
Compliance with medications
Compliance with medication reported on the 5-level Likert Score was collapsed into two categories: always taking the medication exactly as prescribed and less than always. Slightly more than a half of patients (52.2%) reported not always taking their medication as prescribed. Compared with those reporting that they always took their medication as prescribed, those with lower compliance reported a higher percentage of being bothered by side effects (31 (9.1%) vs 14 (4.5%), p=0.013) and/or having problems with filling their prescription all or most of the time (31 (9.1%) vs 13 (4.2%), p=0.021). There was no difference in the experience of hypoglycaemia, recorded weight gain and the treatment (SU vs SU+MET) between the two compliance groups.
Discussion
The present study indicated that SU or a combination of SU and MET were important tools in attaining glycaemic control <7% among patients with advanced T2DM in Thailand. The burden of hypoglycaemia and weight gain was high in patients with T2DM up to 10 years after diabetes diagnosis, with majority of surveyed patients reporting mild symptoms of hypoglycaemia. Initiation of treatment with SU alone was associated with higher average weight gain. Overall, the findings support recommendations to adopt a patient-centred approach in selecting T2DM interventions. Choice of treatment should prioritise achievement of glycaemic goals that at the same time minimises the risk of hypoglycaemia and weight gain.
Overall, 47.5% of patients had HbA1c values less than 7%. The quality of the glycaemic control in our study may seem relatively high with SU plus MET or SU alone when compared with the UKPDS intervention group. In our study, the average HbA1c after a median follow-up of 10 years was approximately 7.1%–7.2%, depending on the treatment group, and the reference range of HbA1c was 7.2%–7.4% in UKPDS after 6 years.17 Similar to UKPDS, the average age (65 years) of the study population and approximately 50% compliance that was reported may explain the results for glycaemic control and HbA1c goal attainment.
SUs were the most commonly used monotherapy in Thai patients,4 although the ADA and the European Association for the Study of Diabetes algorithm for T2DM treatment recommend starting with MET.18 If SU monotherapy fails to achieve the glycaemic target, combination therapy with a second agent with a different mechanism of action is usually initiated. The most commonly prescribed combination therapy in Thai patients is SU plus MET.4
In our study, we observed a significant lower incidence of HbA1c goal attainment among patients treated with SU+MET than those treated with SU alone. There was no difference in the duration of diabetes between the SU and SU+MET groups (median (IQR), 10 (5 to 15) and 10 (6 to 15) years, respectively, p=0.416). More than half of the patients treated with SU+MET for at least 6 months failed to achieve glycaemic control (294 from 521, 56.4%) in our study. This may show that the use of the combination to achieve the glycaemic target may be insufficient to help these patients achieve the desired glycaemic control. Other confounding variables might have affected the outcomes in this observational study design, such as delay in initiating combination therapy in uncontrolled diabetes and patient non-compliance. The patients in this study had very low adherence to a regular diabetic diet (13%). The root cause for failure to achieve glycaemic control and/or to prevent complications will require additional investigation and development of novel diabetic agents.
Patients with increased numbers of hypoglycaemia events are at risk for long-term complications and mortality,19–21 and hypoglycaemia remains a major limiting factor in treating patients with T2DM, with the approximate prevalence ranging from 10% to 30% depending on treatment.21–24 Among the various antidiabetic medications available for T2DM, SU was more likely to be associated with hypoglycaemia than non-SU antidiabetic medications.21 25 Our study confirmed that patients taking SU with their antidiabetic medications had a high incidence of symptomatic hypoglycaemia (30%). However, the actual rate of hypoglycaemia may vary from that reported herein due to the study design, study population, differences in diabetes education and social status. In the present study, patients with T2DM having advanced age and Thai ethnicity, were more likely to have a high incidence of hypoglycaemia. Moreover, hypoglycaemic events, captured using a medical survey, might have underestimated the true incidence of hypoglycaemia due to a recall bias and missed symptoms of mild hypoglycaemia.26 A study in Europe found that many patients with diabetes rarely or never informed their general practitioner/specialist about hypoglycaemia events.27 Therefore, the real burden of hypoglycaemia may be underestimated.
The study results showed that the patients with lower compliance reported a higher percentage of being bothered by side effects while self-reported experience of hypoglycaemia and weight gain did not differ significantly between the two compliance groups. Further research to explore other side effects that might be drivers for non-compliance, in addition to hypoglycaemia and weight gain, is needed.
In our subanalysis, the greater number of hypoglycaemia events observed in patients with a low dietary sugar intake and frequent finger-stick glucose monitoring, may be due to more aggressive glycaemic control measures taken by the patient. The increased hypoglycaemia events observed in this setting were assumed to be due to implementing more stringent goals for metabolic control. In addition, our observational study did not rule out the role of other confounding variables.
In the present study, physicians largely followed the recommendations to prescribe MET to the most obese patients and SU to patients with lower body weight. Similarly to related studies,28 29 we observed a higher incidence of weight gain in the group with only SU treatment, and body weight did not change following treatment with a combination of MET and SU. Therefore, for patients with T2DM, whose disease cannot be controlled by SU, biguanides might be an appropriate choice depending on whether the patient is overweight and on the severity of their symptoms.
Macrovascular or microvascular complications were present among 20.8% of the patients. Related studies have shown that hypoglycaemia increased the risk of cardiovascular disease possibly because of reduced coronary blood flow in the heart and major metabolic stress leading to cardiac arrhythmia.30 31 However, none of the patients with T2DM in our study were observed to have cardiovascular symptoms during a hypoglycaemia attack.
By design, this was a cross-sectional survey and a retrospective cohort study, limited to patients from tertiary care hospitals, so the results may not be generalisable to patients in other healthcare settings. The observational nature of this study does not rule out the role of residual confounding variables in the observed associations. In addition, hospitals’ medical records, patient surveys and self-reported treatment experience might have underestimated the true incidence of hypoglycaemia events.
Conclusions
The major finding among Thai patients with T2DM receiving SU or SU+MET was that only about half of the patients achieved glycaemic goal and compliance with the treatment was low in both groups. Hypoglycaemia and weight gain were common. Patients with a pronounced weight gain were often treated with SU monotherapy. Fear and worry about hypoglycaemia and weight gain were higher among the patients who experienced hypoglycaemic events and weight gain. Therefore, clinicians should collect information about patients’ past experiences and treatment of prior side effects. Improving compliance and selecting the most effective treatments with lowest risk of side effects, among patients failing to achieve their target glycaemic goals, will have the greatest likelihood of improving their treatment outcomes.
Acknowledgments
The authors thank the participating patients and general practitioners for their contributions. The authors also thank Alan Geater and Walailuk Jitpiboon from the Epidemiology Unit, Faculty of Medicine, Prince of Songkhla University for their assistance in statistical analysis. The authors also thank Dr Mariusz Wojnarski from the Armed Forces Research Institute of Medical Sciences (USAMD-AFRIMS) for his assistance in editing.
References
Footnotes
Contributors BS, TP, BO, SS, YB and WN collected the data, drafted the article, reviewed the literature and revised it critically equally. BS and WN provided valuable input in study design, data collection and literature review. All authors read and approved the manuscript and met the criteria for authorship.
Funding Merck Sharp & Dohme Corp (Thailand) Ltd provided funding for this study (eg, cost of materials, data management, data analysis and publication).
Competing interests None declared.
Patient consent for publication Not required.
Ethics approval This study was approved by the Human Research Ethics Committee of each hospital. (Royal Thai Army Medical Department IRB. Ref No: P039h/55, Khon Kaen University EC. Ref No: HE551257, Ramathibodi Hospital EC. Ref No: 11-55-24, Faculty of Medicine, Chulalongkorn University, IRB Ref No: 412/55, Siriraj Hospital Ref No: 636/2555(EC4)).
Provenance and peer review Not commissioned; externally peer reviewed.
Data availability statement Data are available upon reasonable request. Other statistical analysis results to support the findings of this study are available for one year after publication from the corresponding author by email upon reasonable request. Individual patient data and materials are not provided as supplements will not be shared.